DOW JONES UTLITY AVERAGE – END OF SECULAR BULL UPTREND?
by WaveTrack International| July 12, 2017 | No Comments
List of Stocks traded in the Dow Jones Utility Average
The Dow Jones Utility Average (DJUA) is a price-weighted average of 15 utility stocks traded in the United States – the current components are as follows:
• AES Corp., (AES) – electric utilities
• American Electric Power Co., Inc. (AEP) – electric utilities
• American Water Works Company, Inc. (AWK) – water utilities
• CenterPoint Energy, Inc. (CNP) – diversified utilities
• Consolidated Edison, Inc. (ED) – electric utilities
• Dominion Resources, Inc. (D) – electric utilities
• Duke Energy Corp. (DUK) – electric utilities
• Edison International (EIX) – electric utilities
• Exelon Corp. (EXC) – diversified utilities
• FirstEnergy Corp. (FE) – electric utilities
• NextEra Energy Inc. (NEE) – electric utilities
• NiSource, Inc. (NI) – diversified utilities
• PG&E Corp. (PCG) – electric utilities
• Public Service Enterprise Group, Inc. (PEG) – diversified utilities
• Southern Company, Inc. (SO) – electric utilities
Dow Jones History
The Dow Jones UA began trading on the 2nd January 1929 at a level of 85.64 when utility stocks were removed from the Dow Jones Industrial Average (DJIA). An interesting point of early history was that during the Great Depression collapse between 1929-1932, the DJUA underperformed the recovery that began in the Dow Jones Industrial Average (DJIA) from 1932 onwards – in fact, it traded to an historical lower-low in March 1942 at 11.40. So this date is the starting point for its secular-bull uptrend.
Dow Jones UA a ‘defensive player’
In the modern era, the DJUA is considered to be a ‘defensive play’ for portfolio managers. For example, in the first four months of 2016, the Dow Jones Utility Average was up 13.3% per cent versus a 1.0% per cent gain for the S&P 500 index – pretty good performance although allowance is given to the S&P as it declined sharply during January by -9.93% per cent so took another 2-months to recover. But you get the point. Usually, in secular-bull uptrends, the main outperformance comes from technology stocks which has recently been evident by the last 18-month performance of the Nasdaq 100. But Utility stocks are worth watching, especially at times of financial stress.
Using the DJUA as a ‘defensive play’ isn’t always a good idea though – the long-term uptrend from the year-1946 low proves that, in other words, it is not 100% negatively correlated but it can limit losses in a portfolio relative to the DJIA or the S&P when a portfolio manager MUST BE INVESTED IN THE MARKET pretty much all the time, with only an cash-fund allowance of perhaps 5-7% per cent.
Current Academic Forecasts for the Dow Jones UA
We already know that certain academics are forecasting a more immediate end to the secular-bull uptrend for the DJIA and the S&P 500, Nasdaq 100 etc. based upon cyclically adjusted price/earnings ratio, or CAPE, made famous by Yale University finance professor and Nobel laureate Robert Shiller. The CAPE is currently near an historical peak which reads the most bearish for the stock market than at any other time since year-1880 with only two exceptions – right before the 1929 stock market crash and in the months prior to the bursting of the internet bubble in year-2000. Can the current set-up be proven from taking a look at the Dow Jones Utility Average (DJUA) from an Elliott Wave perspective?
Elliott Wave Insight
No, the Elliott Wave Principle suggests there will be more upside potential before the DJUA signals an end to the secular-bull uptrend for the DJIA, S&P 500 and Nasdaq100 – see fig #1. From an orthodox Elliott Wave standpoint though, the secular-bull uptrend for the DJUA ended already in November 2000 at 418.30 with the following decline/advance to current levels unfolding as the first two sequences of a multi-decennial EXPANDING FLAT pattern, i.e. A-B-C subdividing 3-3-5.
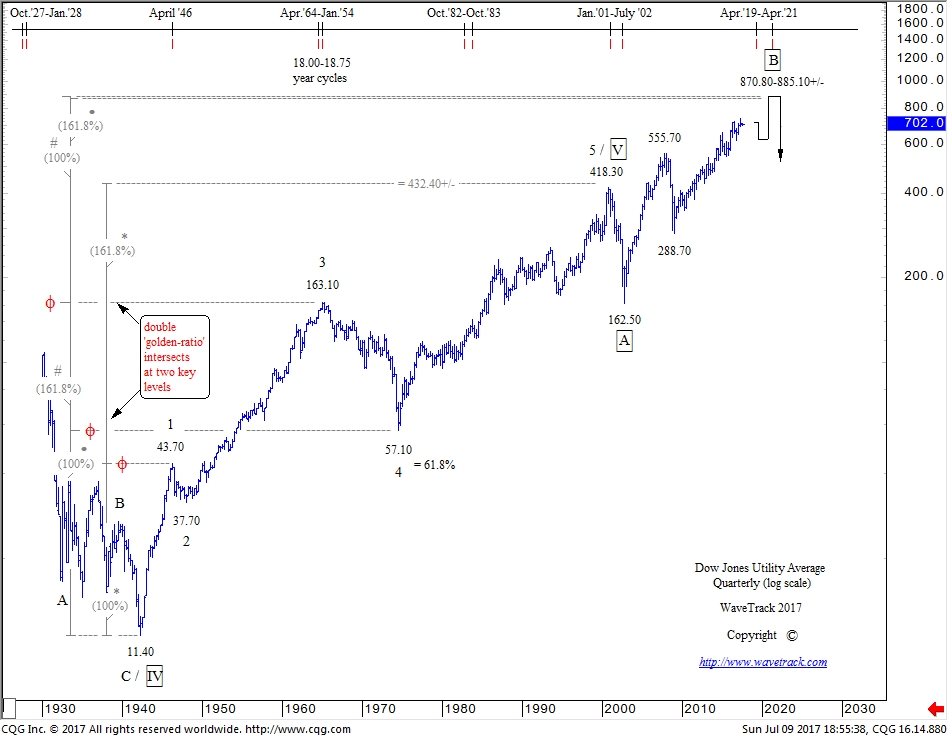
Dow Jones Utilities Average – Quarterly Chart by WaveTrack International
The secular-bull uptrend from the year-1946 low of 11.40 can be seen unfolding into a cycle degree five wave expanding-impulse pattern labelled 1-2-3-4-5. To begin with, it is worth noting that the 5th wave is classified as the ‘extended’ sequence because it is larger than waves 1 and 3. There are also some amazing FIB-PRICES-RATIOs in this pattern. For example, extending cycle wave 1 by a fib. 161.8% ratio projects the terminal high for wave 5 towards 432.40+/-. The actual high traded to 418.30!
The following activity then begins the counter-trend phase of this advance by unfolding into the multi-decennial EXPANDING FLAT pattern. Labelled in super-cycle degree, A-B-C, wave A completed a seven wave double zig zag decline into the Oct.’02 low of 162.50. The following recovery began super-cycle wave B which is itself unfolding into a single zig zag which remains incomplete. We know it is incomplete because of the internal structure of cycle wave C of this zig zag. It requires more upside so that it subdivides into a five wave impulse pattern. But can we ‘proof’ this from using FIB-PRICE-RATIO’s?
Fib-Price-Ratio Answers!
Yes we can. The ‘B’ waves of an expanding flat often trade to higher-highs at the price level intended for the terminal high of the preceding secular-bull uptrend. When the secular-bull uptrend ends short, the ‘B’ wave of the correction compensates by reaching the fib-price-ratio target. This is what we anticipate recurring in the DJUA. For example, extending cycle waves 1-3 of the secular-bull uptrend by a fib. 61.8% ratio projects super-cycle wave B towards 885.10+/-. Also, extending waves 1-4 by an inverse fib. 161.8% ratio projects wave B towards 870.80+/-. This double ‘golden-ratio’ level is the markets ‘harmonic’, it is attracting the price towards it which means the current advance cannot collapse into a secular-bear downtrend until reached sometime over the next few years.
Note that in times of real financial stress, the DJUA collapsed at the same time as all the other indices in 2000-2002, and in 2007-2009 but it tends to provide its defensive role OUTPERFORMANCE at times of lesser importance, like in Q1 2016 (see comments above).
Timing of the end of the Securlar-Bull Uptrend
As for timing the end of a secular-bull uptrend for the DJIA, S&P 500 and the Nasdaq 100, this will be such a major event that we’d expect the Dow Jones UA to also decline rapidly, just as it did in those two previous occasions. The 18.00 and 18.75 year cycles shown at the top of the chart depict a time-horizon anywhere between April ’19 and April ’21. That might seem a big gap to trade in, but it does eradicate the idea from CAPE that a more imminent ‘BLACK SWAN’ event could happen now. We’ll be relying on the final Elliott Wave pattern sequences within super-cycle wave B to help pinpoint the exact timing.
This article is an extract from WaveTrack International’s latest monthly institutional Elliott Wave Navigator report.
For institutional enquiries/subscriptions, please visit us @ www.wavetrack.com or contact us direclty via services@wavetrack.com
Currencies (FX) & Interest Rates Video Series | PART III/III | USD 7.8 year Cycle
by WaveTrack International| June 27, 2017 | No Comments
Currencies and Interest Rates Video – Mid-Year 2017 Update!
US$ Dollar in early stages of new 7.8-year cycle |
EURO to rebuff doomsday forecasters |
Commodity Currencies to strenghten
USD Safe-Haven Status
Amongst the world currencies the US$ dollar is quite rightly perceived as a ‘safe-haven’ currency. During times of uncertainty or financial stress, the US$ dollar index strengthens against its G10 trading partners. This was certainly the case during the last two major financial crises. Firstly, when the S&P declined -50% per cent during years 2000-2002 and the secondly, by -57% per cent during 2007-2009. In the first case, the US$ dollar only managed a gain of +8% per cent but +27% per cent during the Lehman-crisis. So there seems no relative ‘amplitude’ guidance for these two events. There are obviously other dynamics that affect its performance.
When the S&P began its new uptrend from the March ’09 low, the US$ dollar began to weaken again as the safe-haven protection was unwound. The dollar nose-dived -18.8% per cent forming a secondary low in May ’11. A huge move – that seems logical enough! But the risk-on/risk-off strategy disengaged afterwards with the dollar gaining a massive +42.8% into this year’s January ’17 peak whilst during the same period, the S&P gained 82.4% per cent. Positive correlation?
The accepted explanation is that widening interest rate differentials and a more robust U.S. economic recovery has led to this strengthening period of the US$ dollar – it has nothing to do with its ‘safe-haven’ status.
From these two exogenous events, we gain a glimpse on how the dollar performs, but is there a way to predict its next major direction? What is its current dominant driver? Is it going to strengthen basis another stock market crash? – strengthen because the U.S. economy is expanding? – or strengthen on further Federal Reserve interest rate hikes? Either way, there’s not much of a case to think entirely in the opposite direction, for a weakening US$ dollar – or is there?
Forecasting Major Inflexion Points
Trading success often means training oneself to think outside the box – knowing when to detach from the herd and run against it – to become the independent free thinker, trader. If you’re familiar with the Elliott Wave Principle (EWP) and Cycle Theory (CT), you already know what I’m talking about. It’s a plain fact that when major inflexion or turning points occur in the markets, the ‘herd’ is stampeding into a canyon with not exit other than that where it came from – it must reverse course. But it’s not obvious to identify these moments – it takes practice and a strong ‘emotive’ but objective conviction that an opportunity is waiting.
How else did Warren Buffet manage to buy cheap Goldman Sachs stock at the bottom of the financial-crisis? He didn’t speculate – he KNEW that an opportunity beckoned because all the characteristic traits were evident in the way investors were reacting – he knew there was emotional panic – he knew values were fifty per cent cheaper than a year earlier – he knew there was a demand for cash. But not all major inflexion or turning points are so obvious – some begin quietly, almost unnoticed which means we have to use tools to identify these, more subtle changes of direction and we can’t think of anything better to use than the EWP + Cycle Analysis.
Elliott Wave – US$ Dollar Index & its 7.8-Year Cycle
It’s hard to dispute the US$ dollar index is unfolding to the rhythm of a 15.6-year cycle which connects peak-to-peak, trough-to-trough – see fig #1. If you showed this repeating cycle to several hundred asset managers, what percentage do you think would liquidate their exposure to the US$ dollar? – especially when you consider the current bullish drivers in place!
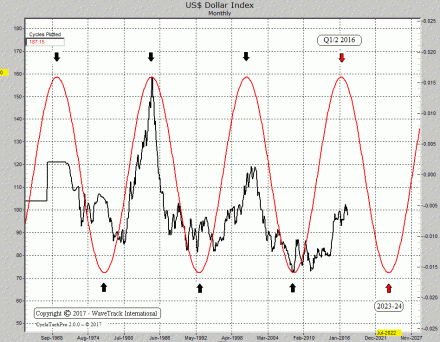
USD Index – Monthly – Currencies Composite Cycle – (C) WaveTrack International
The recent in-depth survey conducted by Bank of America/Merrill Lynch which included 213 respondents with $645bn assets under management highlighted some interesting facts. When asking asset managers what is the ‘most crowded trade’, the answer was the Nasdaq for the first time in five months – it overtook the US$ dollar which has headed the list on an average basis for the last several years. It reached a mid-30’s per cent peak earlier in the year on a scale where +50 to -70 has contained the US$ dollar index price for the last 13-year period. That’s historically overbought by any measure and yet the market savvy asset managers sensed this. But what they don’t know is that a far greater directional change is at hand.
Multidisciplinarity – Elliott Wave and Cycle Theory
The alternating 15.6-year cycle is composed of a near-centrally translated 7.8-year interval from peak-to-trough-to-peak etc. That means the last cycle-trough traded in March ’08 was due to peak next in Q1/Q2 2016. It was a little late which is due to the fact that the centrally translated rhythm is not exact but its close enough if backed up by Elliott Wave analysis. The March ’08 advance is labelled as a corrective upswing, a zig zag or double zig zag pattern. Using WaveTrack’s proprietary fib-price-ratio model for this pattern, extending the first zig zag into the March ’09 peak at 89.62 by a fib. 61.8% ratio projects a terminal high for the secondary zig zag to 103.77+/-. January ‘17’s high at 103.82+/- traded within 5 pips of this number, then responded lower afterwards. It has been declining since. See fig #2.
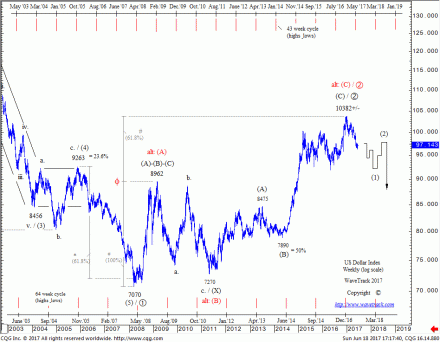
USD Index – Weekly
These two disciplines, Elliott Wave and Cycle Theory are confirming the US$ dollar ended its 7.8-year advance which encompassed the financial-crisis and U.S. economic expansion. But this is changing now. We (unfortunately) don’t have a crystal ball to determine why the US$ dollar should begin a new 7.8-year cycle decline – we can, of course, hypothesise, just as you can too, but from my experience, the outcome can often be totally different. So many times in the past have we saw a different fundamental/economic reason unfold than we thought and yet still validating the Elliott Wave analysis. One thing for sure though, there’s plenty of room for fund managers to catch up on the larger downtrend later, even if their current outlook is somewhat restricted.
The Next 6-Months – New CURRENCIES & INTEREST RATE Mid-Year Video
In the meantime, the US$ dollar’s medium-term trend along with many other major crosses and pairs are updated in our latest MID-YEAR CURRENCIES and INTEREST RATE video. This is the 3rd and final video in this TRILOGY series which includes Stock Indices/Equities and Commodities. This PART III video commentary examines the major US$ dollar crosses including cycles for the EURO/US$, Elliott Wave analysis for STLG/BRITISH POUND against the DOLLAR, the EURO and the YEN, how the commodity currencies are set to continue like the AUSSIE DOLLAR and its performance against the KIWI – the CANADIAN DOLLAR and several ASIAN FX pairs that make up the ASIAN DOLLAR INDEX. The video also updates the MEXICAN PESO, BRAZILIAN REAL, SOUTH AFRICAN RAND, RUSSIAN ROUBLE, POLISH ZLOTY and CHINA’S RENMINBI/YUAN.
This is probably the most comprehensive, most accurate ELLIOTT WAVE FX analysis ever conceived – there are 56 charts and tables + a downloadable .pdf. Even if you’re trading short-term CURRENCY set-ups, this video is an ‘absolute-must’ in giving perspective to your existing strategies. Don’t delay, order you video and accompanying .pdf charts NOW! Just follow the links below and we’ll see you soon!
Most sincerely,
Peter Goodburn
Founder and Head Elliott Wave Analyst
WaveTrack International
CURRENCIES and INTEREST RATES Table of Contents: 56 charts
• US$ Index and Cycles
• Euro/US$ and Cycles
• Stlg/US$
• US$/Yen
• US$/CHF
• AUD/US$
• NZD/US$
• US$/CAD
• Euro/Stlg
• STLG/Yen
• Euro/Yen
• Asian ADXY
• US$/IDR
• US$/ZAR
• US$/BRL
• US$/RUB
• US$/CNY
• USD/MXN
• ZAR/US$
• GBP/ZAR
• US$/BRL
• US$/RUB
• US$/PLZ
• US 30yr Yield
• US 10yr Yield
• US 10yr TIPS Break Even Inflation Rate
• DE 10yr Yield
• JPY 10yr Yield
How can you order the new CURRENCIES and INTEREST RATES video forecast?
PART III CURRENCIES and INTEREST RATES VIDEO is available now, at only $48.00! (1 hour 50 mins long)
We’ll send you a personal link so that you can watch the video, anytime at your convenience.
And if you’d like to subscribe to the CURRENCIES and INTEREST RATES VIDEO offer, you can receive ALL THREE for $96.00! – that’s a saving of 33% per cent!
• Single Video – $48.00
• Triple Package offer – $96.00 (saving 33%)!
CONTACT US NOW VIA EMAIL – SELECT YOUR PACKAGE
Single Video – $48.00 – PART III CURRENCIES and FIXED INCOME (June ’17)
Triple Package offer – $96.00 (saving 33%)! – PART I – PART II – PART III (June ’17)
PART I – the latest STOCK INDICES video runs for 1 h 50 minutes featuring 46 charts – click here
PART II – the latest COMMODITIES video runs for 1 h 30 minutes featuring 52 charts – click here
To receive your VIDEO UPDATE please click here to contact us.
– Please state if you wish to purchase the SINGLE VIDEO for CURRENCIES and INTEREST RATES for USD 48.00?
– Or opt for the TRIPLE PACKAGE for USD 96.00 in total?
– Next we will send you a PayPal payment request and provide you with the video link & PDF report once confirmed.
Havn’t got a a PayPal account? We accept all major credit cards – just tell us your preferred payment method in your email and we’ll send you instructions.
Visit us @ www.wavetrack.com
COMMODITIES VIDEO – Precious Metals Soar!
by WaveTrack International| June 19, 2017 | No Comments

NEW Mid-Year Commodities Video – PART II
Commodities Video Series | PART II/III
INDUSTRIALS, ENERGY SET TO RESUME HIGHER – PRECIOUS METALS TO SOAR!
Includes new 6-MONTH OUTLOOK FORECASTS
The grand ‘RE-SYNCHRONISATION’ process of 2016 produced a realignment of major asset classes following divergences over the preceding years from the 2011 peaks. Developed and Emerging market indices synchronised in January/February 2016 by ending major corrections into the lows, then resuming secular-bull uptrend thereafter. But it wasn’t just stock markets that underwent this recycling. Commodities also formed major corrective lows into the exact same time zone which was the reason behind such huge percentage gains that were recorded into the first half of last year.
The grand re-synchronisation was probably the most important even of last year but it was largely unrecognised by the financial community. Mainly, because asset managers are mostly specialising in individual asset classes rather than taking a macro-holistic approach to investment.
Not only that, but when these different asset classes are lined-up together with the help of viewing them through the lens of the Elliott Wave Principle, suddenly we see a glimpse into the future. That realisation is very profound because ‘seeing’ into the future price development of markets can be, is a humbling experience. I’ve witnessed this so many times during my 40-years in trading and yet each new glimpse is as special as all those of the past.
Impulses, Zig Zags & Expanding Flats
What makes the ‘RE-SYNCHRONISATION’ process special is the way it aligns disparate Elliott Wave pattern development into an alignment of ‘POSITIVE-CORRELATION’.
When stock markets peaked in 2007/08, so did commodity markets and when prices collapsed during the 2008/09 financial-crisis, both asset classes formed major lows within just a few months of each other. The recovery phase also saw both trend higher afterwards and that’s where the great puzzle begins.
Whilst U.S. stock markets began new secular-bull 5-wave impulse uptrends, many commodity markets began the same advance but as 3-wave zig zags, or in some cases double zig zags. And these zig zags are simply the second sequence within even larger, multi-decennial expanding flat patterns – yes it all gets a little complicated. But herein lies the hidden path that future price development is taking.
It’s no wonder that during 2011-2016, commodity prices declined rapidly whilst U.S. stock markets trended higher because it was a necessary function in order to allow the 5-wave development of one to play out whilst allowing a 3-wave pattern unfold in the other. In fact, the commodity correction in 2011-2016 realised wave ‘B’ within the zig zag upswing unfolding from the financial-crisis lows whilst the 3rd wave uptrend continued in stocks. The resynchronisation occurred when wave ‘B’ ended last January/February at the same time a minor fourth wave correction completed in stocks.
From an Elliott Wave pattern perspective, they were now realigned in positive-correlation and can both head higher in the next major phase of their respective patterns. But what of 2017?
The Next 6-Months
So far, this year has delivered different performances following last year’s impressive commodity gains. Base Metals have undergone counter-trend retracements as has the Energy sector. These are seen co-existing in a shorter-term positive-correlation environment which is largely dependent on how supply imbalances are being worked off. Precious metals ended their corrective declines earlier, last December (2016) and are already resuming larger uptrends established from last year’s lows as geopolitical events have a positive impact.
Just recently however, the Base Metals and Energy sectors have or are approaching the end of these shorter-term corrective phases that began from last year’s peaks. This is happening at the same time that Precious Metals are building a strong platform of support in preparation for the next stage of accelerative advances. From this we can determine that all three commodity sectors are poised to surge higher for the remainder of 2017!
New Commodities Mid-Year Video Forecast
This MID-YEAR 2017 COMMODITIES video takes a look at how these shorter-term realignments fit together across Base Metals, Precious Metals and the Energy complex for Crude and Brent Oil. We show how the ‘RE-SYNCHRONISATION’ process of 2016 dovetails with ‘POSITIVE-CORRELATION’ studies, how these interact and combine to reveal this next stage of major price advances into the second-half of this year, 2017.
We invite you to take this next part of our financial journey with us – video subscription details are below – just follow the links and we’ll see you soon!
Most sincerely,
Peter Goodburn
Founder and Head Elliott Wave Analyst
WaveTrack International
COMMODITIES VIDEO Table of Contents: 52 charts
• S&P- Hang Seng-MSCI Emerging Markets-Singapore Straits – Correlation
• S&P 500 - Crude Oil- Copper – Correlation
• MSCI EM vs. Copper – Correlation
• Palladium vs. Nasdaq 100 – Correlation
• Crude Oil vs. Copper – Correlation
• Copper/EM – EW Pattern
• Base Metals Miners – EW Pattern
• Precious Metal Miners – EW Pattern
• Crude Oil – EW Pattern
• AUD vs. CRB Cash Index – Correlation
• CRB Cash Index – Weekly – Cycle
BASE METALS
• Copper vs. AUD – Weekly – Correlation
• Copper – Weekly – Composite Cycle
• Aluminium – Daily
• Lead – Weekly
• Zinc – Daily
• Nickel – Daily
• XME – Metals Mining – Daily
• BHP Billiton – Weekly
• Freeport McMoran – Weekly
• Antofagasta PLC – Weekly
• Anglo American – Weekly
PRECIOUS METALS
• Silver vs. Copper – Weekly – Correlation
• Gold – Monthly – Composite Cycle
• Gold – Count #1 and #2
• GDX – Gold Miners Index – Weekly
• Newmont Mining – Weekly
• GoldCorp Inc. – Weekly
• Amer Barrick – Weekly
• Agnico-Eagle Miners – Weekly
• AngloGold Ashanti – Weekly
• Silver – Composite Cycle and Count #1 and #2
• XAU – Gold/Silver Miners – Weekly
• Gold/Silver Ratio vs. Silver – Correlation
• Gold/Silver Ratio – Weekly
• Palladium vs. Silver – Correlation
• Palladium – Monthly
• Palladium vs. Silver – Correlation
• Platinum – Weekly
ENERGY / CRUDE OIL
• Crude Oil – Weekly – Composite Cycle
• Crude Oil – Count #1 and #2
• Brent Oil – Weekly
How can you order the new COMMODITIES video forecast?
PART II COMMODITIES VIDEO is available now, at only $48.00! (1 hour 30 mins long)
We’ll send you a personal link so that you can watch the video, anytime at your convenience.
And if you’d like to subscribe to the STOCK INDICES video PART I and up-coming CURRENCIES videos PART III, you can receive ALL THREE for $96.00! – that’s a saving of 33% per cent!
• Single Video – $48.00
• Triple Package offer – $96.00 (saving 33%)!
CONTACT US NOW VIA EMAIL – SELECT YOUR PACKAGE
Single Video – $48.00 – PART II COMMODITIES (June ’17)
Triple Package offer – $96.00 (saving 33%)! – PART I – PART II – PART III (June – July ’17)
The latest STOCK INDICES video runs for 1 h 50 minutes featuring 46 charts – click here
PART III for Currencies and Interest Rates will be available in a few weeks’ time (June/July 2017!) – we’re working on it!
To receive your VIDEO UPDATE please click here to contact us.
– Please state if you wish to purchase the SINGLE VIDEO for COMMODITIES for USD 48.00?
– Or opt for the TRIPLE PACKAGE for USD 96.00 in total?
– Next we will send you a PayPal payment request and provide you with the video link & PDF report once confirmed.
Havn’t got a a PayPal account? We accept all major credit cards – just tell us your preferred payment method in your email and we’ll send you instructions.
Visit us @ www.wavetrack.com
FAAMG – Why tech stocks collapsed?
by WaveTrack International| June 16, 2017 | No Comments
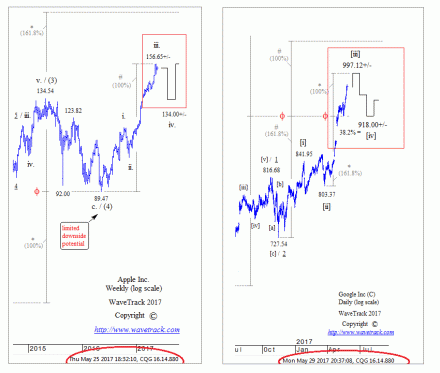
Apple Inc vs. Google Inc. – Weekly Chart – FAAMG
FAAMG – TECH SNAPSHOT!
Since the Nasdaq 100 staged a reversal-signature exactly 1-week ago (Friday 9th June) from an all-time-high of 5907.50 (futures), pundits have attempted to explain why technology stocks collapsed.
Analysts were quick to issue their forecast revisions for some of the FAAMG’s, Facebook, Amazon, Apple, Microsoft and Alphabet (Google). As a consequence, the investment bank Mizuho lowered their targets for Apple Inc. from $160.00 to $150.00 retrospectively, Monday morning even though they commented that the timing of this release was a coincidence as the research took weeks to compile – the stock has since traded down to $142.21!
But there was a definitive lacking in fundamental logic? Yes, commentators cited a frothy over-extended market but they’ve been saying that for weeks. Yet, that’s not a concrete explanation for the timing.
FAAMG – THE REAL REASON WHY TECH STOCKS CHOSE THEIR MOMENT TO COLLAPSE
Here’s our explanation. Elliott Wave analysis identified 3rd wave completions into these highs. Apple Inc. hinted it was preparing for this decline over 2-weeks before it happened (see chart, left). It’s peak at 156.65+/- was already cited as ending its 3rd wave that began from last November’s low of 104.08 had completed late-May. Now, opening the way for a corrective decline in a 4th wave towards $134.00+/-.
Likewise, Google Inc. was also heading into a major peak. Elliott Wave analysis forecast an approach to important 3rd wave highs towards $997.12+/-, the actual high trading marginally short at $988.25 (see chart, right). Its 4th wave downside targets to $918.00+/- has already been realised to 915.23. In fact, we shall be revising the completion even lower now.
Elliott Wave analysis combined with Fibonacci-Price-Ratios become an effective tool in forecasting, projecting these types of up-coming reversal-signatures. To learn more, following the links!
Interested in GOOGLE Alphabet C stocks? Get our latest equity report here
Commodities Video Series | PART II/III – Precious Metals to Soar!
by WaveTrack International| June 13, 2017 | No Comments
NEW Mid-Year Commodities Video – PART II
Commodities Video Series | PART II/III
INDUSTRIALS, ENERGY SET TO RESUME HIGHER – PRECIOUS METALS TO SOAR!
Includes new 6-MONTH OUTLOOK FORECASTS
The grand ‘RE-SYNCHRONISATION’ process of 2016 produced a realignment of major asset classes following divergences over the preceding years from the 2011 peaks. Developed and Emerging market indices synchronised in January/February 2016 by ending major corrections into the lows, then resuming secular-bull uptrend thereafter. But it wasn’t just stock markets that underwent this recycling. Commodities also formed major corrective lows into the exact same time zone which was the reason behind such huge percentage gains that were recorded into the first half of last year.
The grand re-synchronisation was probably the most important even of last year but it was largely unrecognised by the financial community. Mainly, because asset managers are mostly specialising in individual asset classes rather than taking a macro-holistic approach to investment.
Not only that, but when these different asset classes are lined-up together with the help of viewing them through the lens of the Elliott Wave Principle, suddenly we see a glimpse into the future. That realisation is very profound because ‘seeing’ into the future price development of markets can be, is a humbling experience. I’ve witnessed this so many times during my 40-years in trading and yet each new glimpse is as special as all those of the past.
Impulses, Zig Zags & Expanding Flats
What makes the ‘RE-SYNCHRONISATION’ process special is the way it aligns disparate Elliott Wave pattern development into an alignment of ‘POSITIVE-CORRELATION’.
When stock markets peaked in 2007/08, so did commodity markets and when prices collapsed during the 2008/09 financial-crisis, both asset classes formed major lows within just a few months of each other. The recovery phase also saw both trend higher afterwards and that’s where the great puzzle begins.
Whilst U.S. stock markets began new secular-bull 5-wave impulse uptrends, many commodity markets began the same advance but as 3-wave zig zags, or in some cases double zig zags. And these zig zags are simply the second sequence within even larger, multi-decennial expanding flat patterns – yes it all gets a little complicated. But herein lies the hidden path that future price development is taking.
It’s no wonder that during 2011-2016, commodity prices declined rapidly whilst U.S. stock markets trended higher because it was a necessary function in order to allow the 5-wave development of one to play out whilst allowing a 3-wave pattern unfold in the other. In fact, the commodity correction in 2011-2016 realised wave ‘B’ within the zig zag upswing unfolding from the financial-crisis lows whilst the 3rd wave uptrend continued in stocks. The resynchronisation occurred when wave ‘B’ ended last January/February at the same time a minor fourth wave correction completed in stocks.
From an Elliott Wave pattern perspective, they were now realigned in positive-correlation and can both head higher in the next major phase of their respective patterns. But what of 2017?
The Next 6-Months
So far, this year has delivered different performances following last year’s impressive commodity gains. Base Metals have undergone counter-trend retracements as has the Energy sector. These are seen co-existing in a shorter-term positive-correlation environment which is largely dependent on how supply imbalances are being worked off. Precious metals ended their corrective declines earlier, last December (2016) and are already resuming larger uptrends established from last year’s lows as geopolitical events have a positive impact.
Just recently however, the Base Metals and Energy sectors have or are approaching the end of these shorter-term corrective phases that began from last year’s peaks. This is happening at the same time that Precious Metals are building a strong platform of support in preparation for the next stage of accelerative advances. From this we can determine that all three commodity sectors are poised to surge higher for the remainder of 2017!
New Commodities Mid-Year Video Forecast
This MID-YEAR 2017 COMMODITIES video takes a look at how these shorter-term realignments fit together across Base Metals, Precious Metals and the Energy complex for Crude and Brent Oil. We show how the ‘RE-SYNCHRONISATION’ process of 2016 dovetails with ‘POSITIVE-CORRELATION’ studies, how these interact and combine to reveal this next stage of major price advances into the second-half of this year, 2017.
We invite you to take this next part of our financial journey with us – video subscription details are below – just follow the links and we’ll see you soon!
Most sincerely,
Peter Goodburn
Founder and Head Elliott Wave Analyst
WaveTrack International
COMMODITIES VIDEO Table of Contents: 52 charts
• S&P- Hang Seng-MSCI Emerging Markets-Singapore Straits – Correlation
• S&P 500 - Crude Oil- Copper – Correlation
• MSCI EM vs. Copper – Correlation
• Palladium vs. Nasdaq 100 – Correlation
• Crude Oil vs. Copper – Correlation
• Copper/EM – EW Pattern
• Base Metals Miners – EW Pattern
• Precious Metal Miners – EW Pattern
• Crude Oil – EW Pattern
• AUD vs. CRB Cash Index – Correlation
• CRB Cash Index – Weekly – Cycle
BASE METALS
• Copper vs. AUD – Weekly – Correlation
• Copper – Weekly – Composite Cycle
• Aluminium – Daily
• Lead – Weekly
• Zinc – Daily
• Nickel – Daily
• XME – Metals Mining – Daily
• BHP Billiton – Weekly
• Freeport McMoran – Weekly
• Antofagasta PLC – Weekly
• Anglo American – Weekly
PRECIOUS METALS
• Silver vs. Copper – Weekly – Correlation
• Gold – Monthly – Composite Cycle
• Gold – Count #1 and #2
• GDX – Gold Miners Index – Weekly
• Newmont Mining – Weekly
• GoldCorp Inc. – Weekly
• Amer Barrick – Weekly
• Agnico-Eagle Miners – Weekly
• AngloGold Ashanti – Weekly
• Silver – Composite Cycle and Count #1 and #2
• XAU – Gold/Silver Miners – Weekly
• Gold/Silver Ratio vs. Silver – Correlation
• Gold/Silver Ratio – Weekly
• Palladium vs. Silver – Correlation
• Palladium – Monthly
• Palladium vs. Silver – Correlation
• Platinum – Weekly
ENERGY / CRUDE OIL
• Crude Oil – Weekly – Composite Cycle
• Crude Oil – Count #1 and #2
• Brent Oil – Weekly
How can you order the new COMMODITIES video forecast?
PART II COMMODITIES VIDEO is available now, at only $48.00! (1 hour 30 mins long)
We’ll send you a personal link so that you can watch the video, anytime at your convenience.
And if you’d like to subscribe to the STOCK INDICES video PART I and up-coming CURRENCIES videos PART III, you can receive ALL THREE for $96.00! – that’s a saving of 33% per cent!
• Single Video – $48.00
• Triple Package offer – $96.00 (saving 33%)!
CONTACT US NOW VIA EMAIL – SELECT YOUR PACKAGE
Single Video – $48.00 – PART II COMMODITIES (June ’17)
Triple Package offer – $96.00 (saving 33%)! – PART I – PART II – PART III (June – July ’17)
The latest STOCK INDICES video runs for 1 h 50 minutes featuring 46 charts – click here
PART III for Currencies and Interest Rates will be available in a few weeks’ time (June/July 2017!) – we’re working on it!
To receive your VIDEO UPDATE please click here to contact us.
– Please state if you wish to purchase the SINGLE VIDEO for COMMODITIES for USD 48.00?
– Or opt for the TRIPLE PACKAGE for USD 96.00 in total?
– Next we will send you a PayPal payment request and provide you with the video link & PDF report once confirmed.
Havn’t got a a PayPal account? We accept all major credit cards – just tell us your preferred payment method in your email and we’ll send you instructions.
Visit us @ www.wavetrack.com
Nasdaq100 – Fib-Price-Ratios Pinpoint Friday’s Peak
by WaveTrack International| June 12, 2017 | No Comments
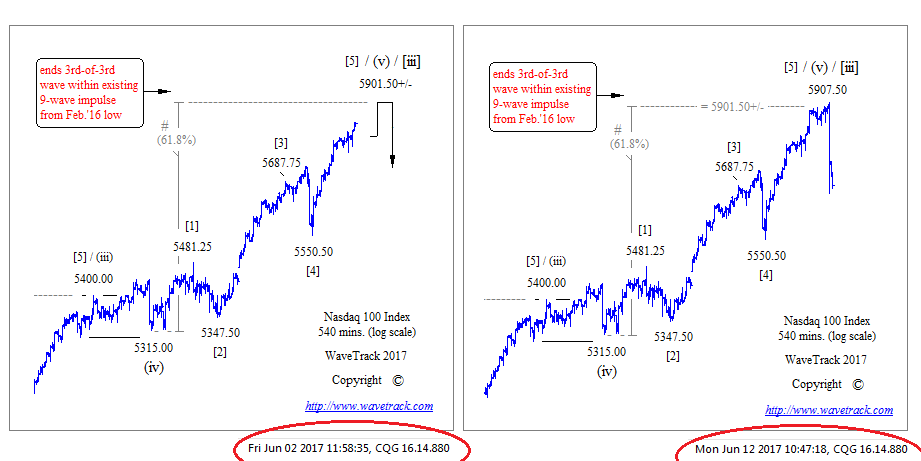
Nasdaq100 – Track Record for Fibonacci-Ratio Success
Which Fibonacci-Price-Ratios were pinpointing Friday’s Peak for the Nasdaq100?
Nasdaq100 responds to Fib-Price-Ratio projection for terminal 5th wave towards 5901.50+/-. Actual high at 5907.50 – down 238.50 points (-4% per cent)!
This 5th wave is the final impulse sequence that began from last November’s low of 4558.50 – it measures a fib. 61.8% ratio of the nett advance between the 1st-3rd wave sequence that completed into the early-March high of 5400.00.
Once again, the fib. 61.8% ratio has confirmed geometric consistency in forecasting major reversals. A counter-trend correction has since begun and this is expected to last the next few weeks prior to a resumption of the larger uptrend.
Learn how to take advantage of WaveTrack’s Fibonacci-Price-Ratios!
Watch WaveTrack’s Fib-Price-Ratio videos on youtube to see how these measurements can be applied. These videos are gems of know-how for those who have eyes to see! WaveTrack’s first Elliott Wave Academy video
Keep tuned for more updates!
Interested in more state of the art Elliott Wave Stock Index forecasts?
We have just published a new 1 h 50 mins Stock Indices Video! – Read more about this amazingly insightful video by click on this link
PART I Stock Indices VIDEO is available now, at only $48.00! (1 hour 50 mins long)
We’ll send you a personal link so that you can watch the video, anytime at your convenience.
And if you’d like to subscribe to the up-coming COMMODITIES & CURRENCIES videos in PART II & PART III, you can receive ALL THREE for $96.00! – that’s a saving of 33% per cent!
• Single Video – $48.00
• Triple Package offer – $96.00 (saving 33%)!
CONTACT US NOW VIA EMAIL – SELECT YOUR PACKAGE
Single Video – $48.00 – PART I STOCK INDICES (June ’17)
Triple Package offer – $96.00 (saving 33%)! – PART I – PART II – PART III (June – July ’17)
PARTS II & III will be available in a few weeks’ time (June/July 2017!) – we’re working on it!
HOW CAN YOU RECEIVE THE VIDEO FORECAST?
To receive your VIDEO UPDATE please click here to contact us.
– Please state if you wish to purchase the SINGLE VIDEO for STOCK INDICES for USD 48.00?
– Or opt for the TRIPLE PACKAGE for USD 96.00 in total?
– Next we will send you a PayPal payment request and provide you with the video link & PDF report once confirmed.
Havn’t got a a PayPal account? We accept all major credit cards – just tell us your preferred payment method in your email and we’ll send you instructions.
Visit us @ www.wavetrack.com
Ensure you’re tracking our forecasts – subscribe online for the EW-COMPASS REPORT.
Visit us @ www.wavetrack.com and subsribe to our latest EW-COMPASS report!
Stock Index Video Series available now – PART I/III
by WaveTrack International| June 6, 2017 | No Comments

Stock Index Video Series | PART I/III
STOCK INDEX HIGHLIGHT – Technology Sector leads the way higher!
Includes new SENTIMENT & ECONOMIC INDICATOR STUDIES
For the stock index market 2016 marked the Elliott Wave pattern realignment of Developed Markets (DM’s) and Emerging Markets (EM’s) within the secular-bull uptrend, in what we termed as the grand ‘RE-SYNCHRONISATION’ process. Currently, 2017 has so far been the year where the TECHNOLOGY SECTOR leads the way higher!
Since updating the medium-term outlook for the various indices last December/January, the bullish forecasts have yielded huge gains in just 6-months – the benchmark S&P 500 is up +8.0% per cent but the tech-heavy Nasdaq 100 is up by a massive +19.6% per cent. But can this outperformance last?
Well, that depends on our current location within the SECULAR-BULL-UPTREND. But in order to answer the question, we must first revisit the main themes that we’ve highlighted over the last several years in order to get a fix on the market’s positon.
Three’s into Five’s
Winding the clock back to December ’14, the annual EW video/forecasts for 2015 re-examined the bullish zig zag forecasts that originated back in 2010 which described the S&P 500 approaching a major high towards targets of 2139.37 – the actual high was 2134.72. When we checked the location of other global indices and commodities, we could see that they were still engaged in a decennial advance from the financial-crisis lows that would stretch into the end of the decade. For a major stock market peak to occur, all would need to be aligned, just as they were at the peaks of 2000 and 2007 – but this time they weren’t. This realisation translated itself into the current secular-bull-uptrend schematic for all the major U.S. indices.
Re-Synchronisation
A year later, in December ’15, we could see that Emerging Markets and Commodities were in the final stages of counter-trend declines that originated back at the 2011 peaks. One additional but hefty decline was forecast into early-2016 but then forming a major low, turning around and heading higher to begin the 2nd phase of the INFLATION-POP. This also occurred at the same time major Developed Market indices were ending the largest percentage declines since 2011 – the S&P sank by -15% per cent into the Feb.’16 low. The annual 2016 EW video/forecasts termed the dual corrective lows in Developed and Emerging markets as the grand ‘RE-SYNCHRONISATION’ process. This was a major event that could only be appreciated for its importance from an ELLIOTT WAVE perspective.
When the post-financial-crisis recovery occurred, the developed and emerging markets, even commodities were all aligned in positive correlation. This was maintained until late 2012 when DM indices soared to new record highs whilst EM’s and commodities traded lower. This divergence was a necessary function of each’s specific Elliott Wave pattern development. DM indices were engaged in five wave secular-bull impulse uptrends whilst EM indices and Commodities were adhering to a totally different pattern – an advancing three wave decennial zig zag!
In order to reach their individual upside destinations years into the future, there had to be a period of divergence, where the normalised positive-correlation would break down. How else can a five wave impulse pattern be ‘overlaid’ to a three wave zig zag? At some stage, they will separate before re-synchronising later, and that is exactly what happened during 2011-2016.
Technology Outperformance
The January/February ’16 re-synchronisation means that major DM and EM indices along with commodity markets were set to trend higher, together. This is why global economic growth has made headline news for most of last year, then given another energised prod following Donald Trump’s appointment as President. The news fits the established uptrend!
Those uptrends have continued this year, in 2017 although there has been a marked outperformance in the Nasdaq 100. Which comes back to our question – can it continue? Yes it can, at least until the five wave impulse pattern that began from the Feb.’16 low ends later this year.
Within the secular-bull uptrend, its 3rd wave is approaching upside completion which is expected to complete late-2017/early-2018 so outperformance is expected to be maintained until then. There will be shorter-term retracements along the way though, and these will inevitably cause pockets of underperformance simply because the Nasdaq 100 has a much higher ‘beta’. But there’s safety in knowing the direction of the dominant trend.
Sentiment & Economic Indicator Studies
This latest MID-YEAR 2017 STOCK INDEX video series takes an in-depth look at all these major developments, adjusts and updates price-levels from earlier this year using our proprietary FIBONACCI-PRICE-RATIO methodologies. But we also add some major SENTIMENT & ECONOMIC INDICATOR STUDIES too!
R.N. Elliott recognised that human behavioural excesses often precede or are at least aligned to important reversal-signatures. As a result, in today’s modern era of collective data retrieval, these excesses are often visible in sentiment indicators. The video also takes a look at various measures, the VIX volatility index, NYSE Advance-Decline ratio, the S&P’s COT data, extracts from Bank of America/Merrill Lynch’s latest Fund Manager Survey together with results from AAII’s bullish sentiment survey and Elliott Wave analysis of U.S. Consumer Sentiment and Gross Domestic Product.
It all makes fascinating reading – viewing!
New Stock Index Mid-Year Video Forecast
This MID-YEAR 2017 STOCK INDEX video is like nothing you’ve seen anywhere else in the world – it’s unique to WaveTrack International, how we foresee trends developing through the lens of Elliott Wave and how its forecasts interplay with Cycles, Sentiment extremes and Economic data trends.
We invite you to take this next part of our financial journey with us – video subscription details are below – just follow the links and we’ll see you soon!
Most sincerely,
Peter Goodburn
Founder and Head Elliott Wave Analyst
WaveTrack International
Stock Index – Contents: 46 charts
• S&P 500 + Cycles
• Dow Jones Industrial Average
• Vix Volatility Index
• NYSE Advance-Decline
• S&P 500 COT data
• Bank of America/Merrill Lynch FMS Survey
• AAII Bullish Sentiment
• Consumer Sentiment
• US GDP data
• Nasdaq 100
• Russell 2000
• KBW Banking Index
• XLK Technology
• XLY Consumer Discretionary
• XLE Energy
• NDX-BioTech
• Eurostoxx 50
• Xetra Dax
• FTSE-100
• MSCI Emerging Market
• MSCI BRIC
• Bovespa
• Russia RTS
• Nifty 50
• MSCI China
• Shanghai Composite
• China Enterprises
• MSCI Hong Kong
• Hang Seng
• Singapore Straits
• ASX 200
• Nikkei 225
How can you order the new STOCK INDEX video forecast?
PART I Stock Indices VIDEO is available now, at only $48.00! (1 hour 50 mins long)
We’ll send you a personal link so that you can watch the video, anytime at your convenience.
And if you’d like to subscribe to the up-coming COMMODITIES & CURRENCIES videos in PART II & PART III, you can receive ALL THREE for $96.00! – that’s a saving of 33% per cent!
• Single Video – $48.00
• Triple Package offer – $96.00 (saving 33%)!
CONTACT US NOW VIA EMAIL – SELECT YOUR PACKAGE
Single Video – $48.00 – PART I STOCK INDICES (June ’17)
Triple Package offer – $96.00 (saving 33%)! – PART I – PART II – PART III (June – July ’17)
PARTS II & III will be available in a few weeks’ time (June/July 2017!) – we’re working on it!
HOW CAN YOU RECEIVE THE VIDEO FORECAST?
To receive your VIDEO UPDATE please click here to contact us.
– Please state if you wish to purchase the SINGLE VIDEO for STOCK INDICES for USD 48.00?
– Or opt for the TRIPLE PACKAGE for USD 96.00 in total?
– Next we will send you a PayPal payment request and provide you with the video link & PDF report once confirmed.
Havn’t got a a PayPal account? We accept all major credit cards – just tell us your preferred payment method in your email and we’ll send you instructions.
Visit us @ www.wavetrack.com
EUR/USD CORRECTION CONFIRMS LARGER UPTREND INTACT
by WaveTrack International| May 31, 2017 | No Comments
GOLDEN-SECTION PHI IN EUR/USD CORRECTION!
There was a noticeable increase in short-covering of G4 currencies against the US$ dollar towards the end of last week (basis the latest IMM positioning reports). The aggregate USD dollar long positioning declined to a new multi-month low at $7.5bn. Meanwhile, the Euro remained the most net-long currency at €9.1bn, a new multi-year high.
When figures like this occur for the Euro, a check on the underlying Elliott Wave pattern progression is useful in determining direction and whether a contrarian bearish stance is appropriate.
The EUR/USD has driven higher since January’s low traded at 1.0341 into last week’s high at 1.1268. No wonder traders have covered shorts in the Euro and are now net long – that’s a huge move.
But is the 1.1268 high the end of this advance, or just part of a new uptrend?
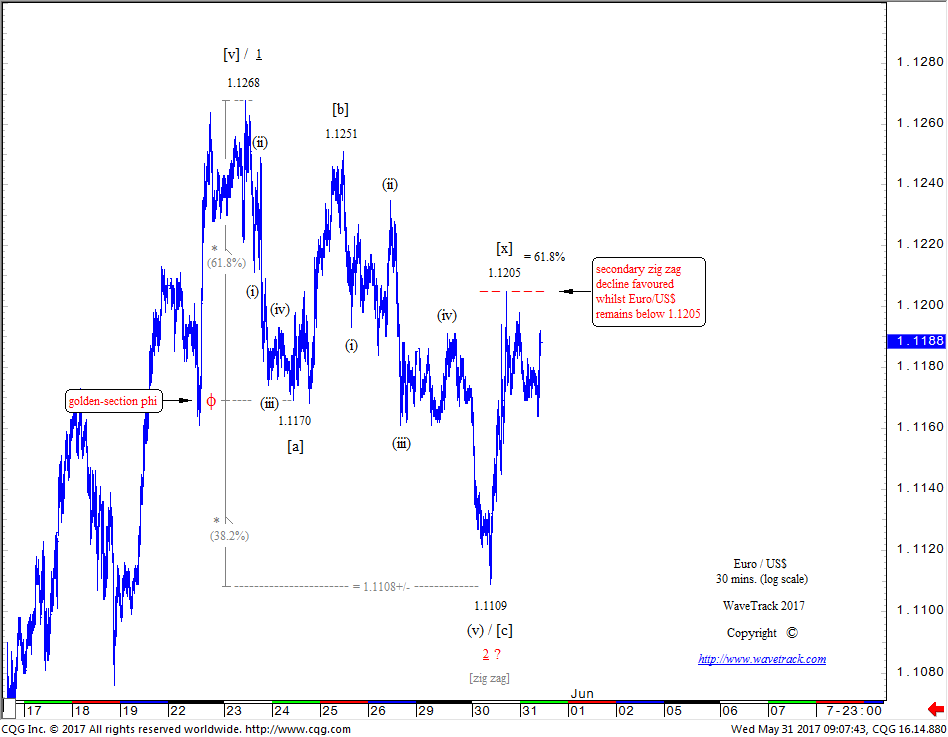
EUR/USD – 30 mins.
One thing for sure, last week’s decline from 1.1268 has just completed unfolding into a corrective zig zag pattern to 1.1109 – see fig #1. Labelled in minuette degree, [a]-[b]-[c] and subdividing 5-3-5, the zig zag can be ‘proofed’ using fib-price-ratios – for example:
Wave [a] x 61.8% -1.1170 = wave [c] @ 1.1108+/-
The actual low at 1.1109 was only 1 pip deviation! – the fib. 61.8% extension ratio marks the location of the ‘golden-section’ phi
Two observations can be derived from this zig zag. First, it confirms the EUR/USD remains within a larger uptrend despite the current long-positioning extreme revealed in the IMM reports. Second, as the Euro/US$ is somewhat overbought basis the IMM stats, this zig zag could easily neutralise this excess by continuing to decline into a deeper double zig zag pattern, breaking below 1.1109.
To extend the current zig zag into a double pattern, wave [x] resistance must be maintained below the 1.1268 high. And preferably below Tuesday’s high of 1.1205 which happens to be a test to the fib. 61.8% retracement level of the preceding zig zag.
The probability of extending lower, below 1.1109 outweighs a more immediate attempt to higher-highs – but conditional on remaining below nearby resistance.
Learn how to take advantage of WaveTrack’s Fibonacci-Price-Ratios!
Watch WaveTrack’s Fib-Price-Ratio videos on youtube to see how these measurements can be applied. These videos are gems of know-how for those who have eyes to see! WaveTrack’s first Elliott Wave Academy video
Ensure you’re tracking our forecasts – subscribe online for the EW-COMPASS REPORT.
Visit us @ www.wavetrack.com and subsribe to our latest EW-COMPASS report!
GDXJ-Junior Gold Miners – ZIG ZAG PERFECTION
by WaveTrack International| May 26, 2017 | No Comments
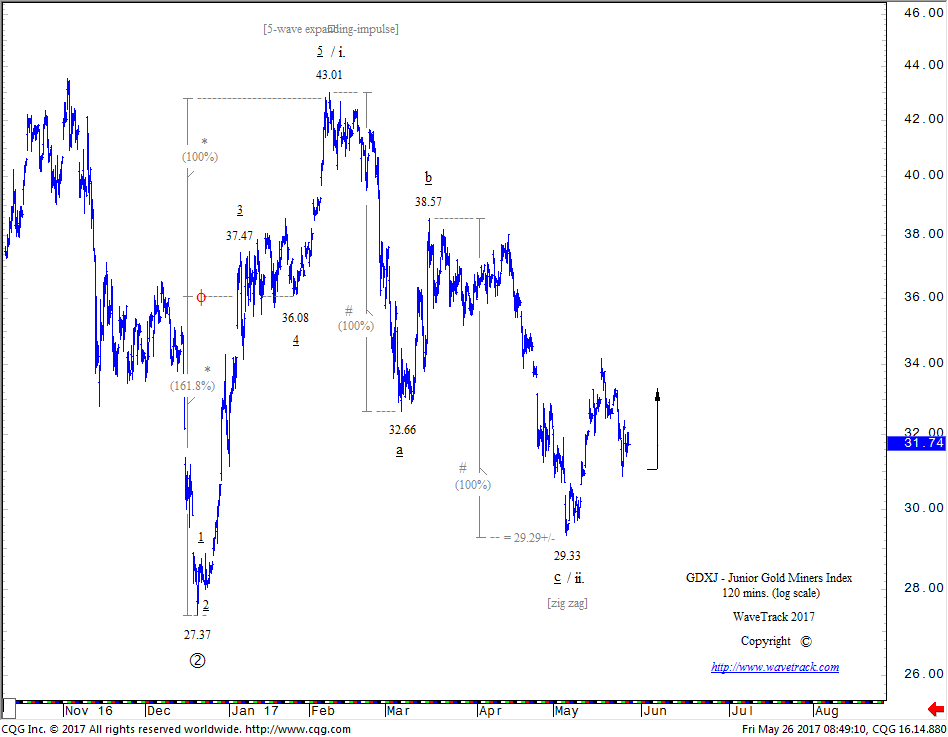
GDXJ Junior Gold Miners – 120 mins.
GDXJ-Junior Gold Miners ZIG ZAG PERFECTION! – GDXJ ENDS CORRECTION INTO $29.33 LOW
Towards the end of last February, the 27th to be exact, we posted an update of the GDXJ-Junior Gold Miners ETF showing how it had just ended a strong 5-wave impulse upswing at $43.01 from December’s low. This was providing confirmation of upside continuity in the future. In fact, this initial five wave impulse was simply the beginning of a much larger, multi-year uptrend – a 1st wave.
But before that can continue, in compliance with Universal Law, action must be followed by reaction. In the GDXJ’s case, a counter-trend decline must begin to unfold. R.N. Elliott’s guideline is that a correction commonly returns to the area of ‘fourth wave preceding degree’ which is around the $36.08 area – see chart. Whilst corrections can end into this minimum area, they can also extend beyond, or lower. This all depends on the depth of the preceding fourth wave in relation to the fifth and the labelling of the preceding impulse.
In this specific case, the GDXJ was beginning a correction as a 2nd wave. Yet, 2nd waves are notorious for unfolding far deeper than simply levels at fourth wave preceding degree. Anticipating such declines are really dependent on how the initial stage of the correction unfolds. If declining into a five wave pattern as it did to $32.66, then we already know that another deeper part of this correction is taking place, eventually taking the form of a 5-3-5 zig zag.
Why Fib-Price-Ratios are the key to forecast termination levels for Zig Zag Patterns
This is where fib-price-ratios are crucial in measuring the termination level of the zig zag. There are various ways to accomplish this but one of the most common ratios is well-known – where waves ‘a’ and ‘c’ measure to quality, or by a fib. 100% correlative ratio. As you can see from the chart, this was zig zag perfection because this ratio projected a terminal low to $29.29+/- with the actual low coming-in at $29.33!
The $29.33 low as this 2nd wave was also testing the fib. 85.4% retracement of its 1st wave predecessor [100-14.58 = 85.4]. When pattern meets fib-price-ratios and prices respond by trading higher afterwards, it confirms a ‘reversal-signature’ or a trend reversal. And so in terms of probability, this set-up is about as good as it gets – risk-reward is excellent basis negation below 29.33 – the prevailing, dominant uptrend is expected to resume higher now.
Learn how to take advantage of WaveTrack’s Fibonacci-Price-Ratios!
Watch WaveTrack’s Fib-Price-Ratio videos on youtube to see how these measurements can be applied. These videos are gems of know-how for those who have eyes to see! WaveTrack’s first Elliott Wave Academy video
Keep tuned for more updates!
Ensure you’re tracking our forecasts – subscribe online for the EW-COMPASS REPORT.
Visit us @ www.wavetrack.com and subsribe to our latest EW-COMPASS report!
APPLE INC. – Hold or Sell? Learn more why Fib-Price-Ratios might be the key!
by WaveTrack International| May 22, 2017 | No Comments

Apple Inc. (APPL) has outperformed over the last year. And only last week, the stock price for Apple reached a record high at 156.65. Apple’s share price is now moving ever so close to our last May’s upside target of 157.23+/-. In May 2016 the price was still trading at 96.43 representing a gain of +62.44% per cent.
But does the fact that prices have traded into fib-price-ratio upside targets mean the five wave expanding-impulse pattern that originated from the April ’13 low of 55.01 has already completed primary wave 5?
The answer is no.
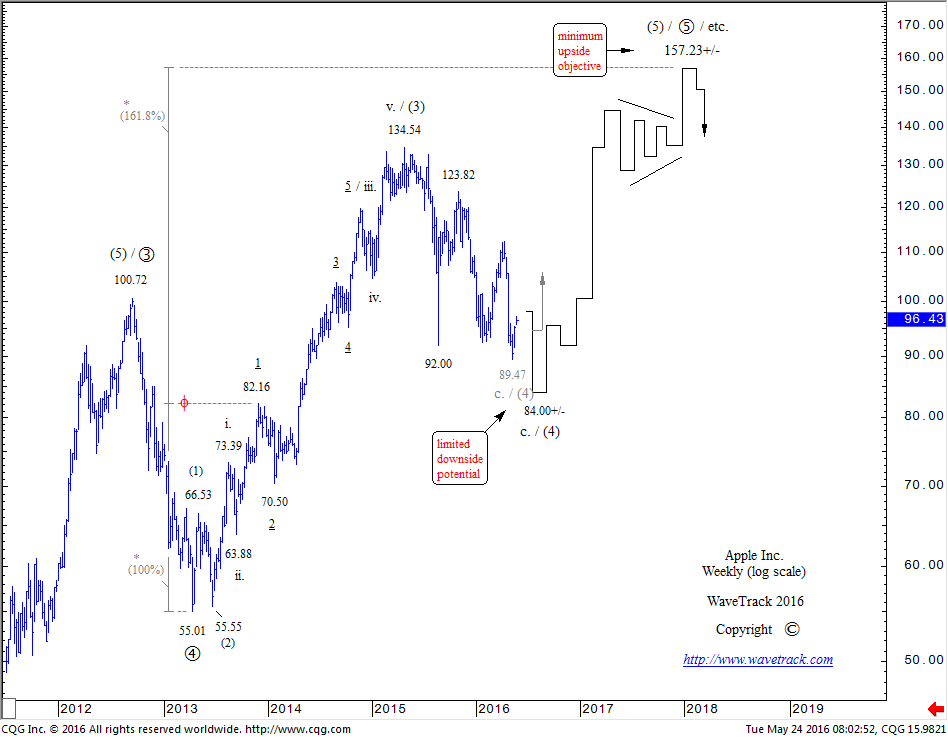
APPLE INC. (AAPL) – Forecast 24th May 2016
If you take a closer look at intermediate wave (5)’s advance from the May ’16 low of 89.47, you’ll notice only a three wave subdivision within the advance to last week’s high. Yes, a smaller fourth wave retracement would necessitate a shorter-term decline continuing in the weeks ahead. This would indicate that the next price development will probably go down towards the fib. 23.6% retracement area at 142.24 or 38.2% to 132.75 but afterwards, a fifth wave advance to higher-highs! Aren’t Fibonacci price ratios amazing?

APPLE INC. – Result! 22nd May 2017 – 1 year later!
Apple Inc. – Forecast May 2016 and phenomenal Result in May 2017!
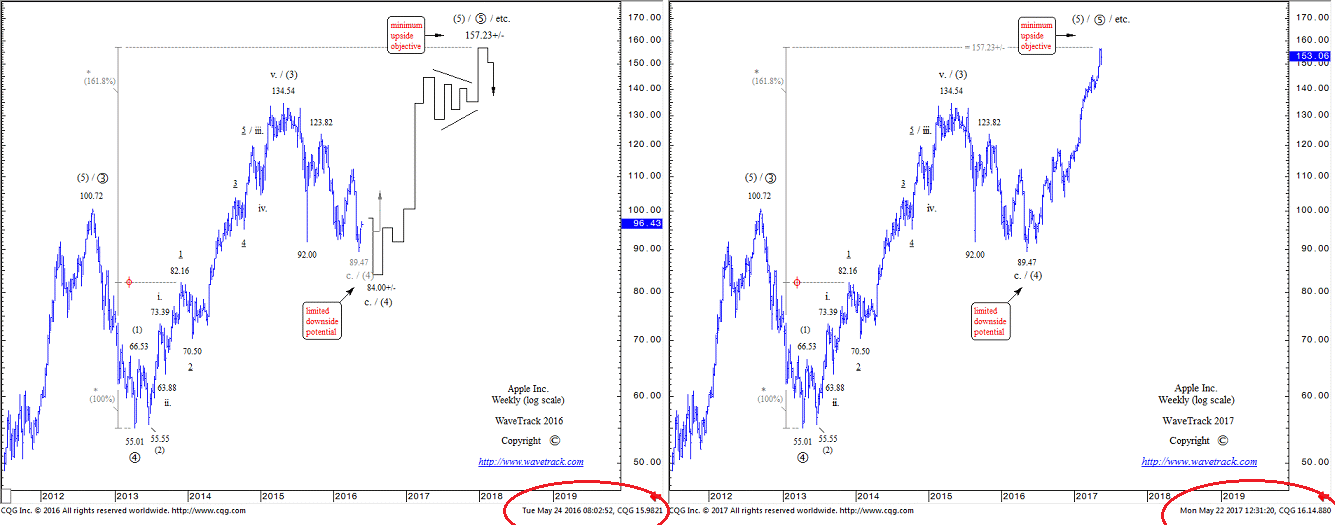
APPLE INC. – Forecast 2016 – RESULT! 2017
Compare the charts again – it is easy to recognise that the Elliott Wave forecast for Apple Inc. is yet another example reason why you should find out more about Fib-Price-Ratios! Ready?
Learn how to take advantage of WaveTrack’s Fibonacci-Price-Ratios!
Watch WaveTrack’s Fib-Price-Ratio videos on youtube to see how these measurements can be applied. These videos are gems of know-how for those who have eyes to see! WaveTrack’s first Elliott Wave Academy video
Keep tuned for more updates!
Ensure you’re tracking our forecasts – subscribe online for the EW-COMPASS REPORT.
Visit us @ www.wavetrack.com and subsribe to our latest EW-COMPASS report!
Tags: AAPL > Equity > Shares > stocks

Recent Posts
Recent Comments
Archives
- August 2026
- July 2026
- June 2026
- February 2026
- December 2025
- August 2025
- July 2025
- June 2025
- March 2025
- February 2025
- January 2025
- December 2024
- August 2024
- July 2024
- June 2024
- May 2024
- April 2024
- February 2024
- January 2024
- December 2023
- August 2023
- July 2023
- June 2023
- March 2023
- February 2023
- January 2023
- December 2022
- November 2022
- October 2022
- August 2022
- July 2022
- June 2022
- May 2022
- March 2022
- February 2022
- January 2022
- December 2021
- August 2021
- July 2021
- June 2021
- March 2021
- February 2021
- January 2021
- December 2020
- November 2020
- August 2020
- July 2020
- June 2020
- May 2020
- April 2020
- March 2020
- February 2020
- January 2020
- December 2019
- October 2019
- September 2019
- July 2019
- June 2019
- May 2019
- April 2019
- March 2019
- February 2019
- January 2019
- December 2018
- November 2018
- September 2018
- August 2018
- July 2018
- June 2018
- May 2018
- April 2018
- March 2018
- February 2018
- January 2018
- December 2017
- November 2017
- October 2017
- September 2017
- August 2017
- July 2017
- June 2017
- May 2017
- March 2017
- February 2017
- January 2017
- December 2016
- November 2016
- October 2016
- September 2016
- August 2016
- July 2016
- June 2016
- May 2016
- April 2016
- March 2016
- February 2016
- January 2016
- December 2015
- November 2015
- October 2015
- September 2015
- August 2015
- July 2015
- June 2015
- May 2015
- April 2015
- March 2015
- February 2015
- January 2015
- December 2014
- November 2014
- October 2014
- September 2014
- August 2014
- July 2014
- June 2014
- May 2014
- April 2014
- March 2014
- February 2014
- January 2014
- December 2013
- November 2013
- October 2013
- September 2013
- August 2013
- July 2013
- June 2013
- May 2013
- April 2013
- March 2013
- February 2013
- January 2013
- December 2012
- November 2012
- October 2012
- September 2012
- August 2012
Categories
- ADXY Index
- Agnico Eagle Mines
- AI Artificial Intelligence
- Alcoa
- Amazon
- AngloGold Ashanti
- Antofagasta
- APPL
- Apple
- ASX 200
- AUD vs USD
- AUD/YEN
- AUDNZD
- AUDUSD
- Australia ASX 200
- Baltic Dry Index
- Banking
- Base Metals
- Biotechnology
- Bitcoin
- Bovespa
- Broadcom
- Campanhia Siderugica
- Catalexit
- central banks
- CHF/Yen
- Christmas
- Commodities
- Commodities Video Outlook
- Commodities Video Outlook 2020
- Conference
- Copper
- Coronavirus Sell-Off
- CRB
- Crude oil
- crude oil price chart
- CryptoCurrency
- Currencies
- Currencies + Interest Rates Video Outlook
- Cycles
- Dax 30
- deutsche bank
- Dewey Cycle
- DJ Transportation Average
- DJ Utilities
- Dow Jones 30
- Dow Theory
- ECB
- economy
- Elliott Wave
- Elliott Wave Charts
- Elliott Wave Patterns
- Elliott Wave Principle
- Emerging Markets
- Ending-Diagonal Elliott Wave Pattern
- Equity
- EUR vs CHF
- EUR/CHF
- EUR/USD
- Euro / US$
- Eurostoxx 50
- EuroStoxx50
- EuroStoxxBanks
- EURUSD
- Expanding Flat Pattern
- FAAMG
- FANG+
- fib-price-ratio
- Fibonacci Trading
- Fibonacci-Price-Ratio
- Financial Forecasting
- Fixed Income
- forex
- Fortescu Metals
- Freeport McMoran
- FTSE 100
- Fund Management
- FX
- FXStreet
- GBP/AUD
- GBP/USD
- GDX
- GDXJ
- Gerdau Steel
- Germany 10 year Euro Bund future
- Gilead Sciences
- Glencore
- Global Economy
- Gold
- Gold Mining
- Golden Ratio
- goldman sachs
- Google Inc.
- Google/Alphabeth
- Greek debt crisis
- Hang Seng
- Harbinger
- Hungarian Forint
- IBEX 35 Index Spain
- Independent Research
- India-CNX Nifty 50
- Interest Rates
- Interview
- IRP Independent Research
- kbw bank index
- Lonmin
- MAG-7
- McDonald's
- MID-YEAR VIDEO UPDATE!
- Mifid II
- Mines
- Mining
- MSCI China
- MSCI Emerging Markets
- Nasdaq 100
- Nasdaq Biotechnology Index
- Nasdaq Composite
- Nasdaq100
- Netflix
- Newmont Mining
- Nikkei 225
- NVIDIA
- NYSE Composite Index
- Palladium
- Platinum
- Precious Metals
- Ralph Nelson Elliott
- Reversal-Signature
- Russell 2000
- Russia RTS
- S&P 500
- Sector
- Secular-Bull
- Sentiment Survey
- Shanghai Composite Index
- Silver
- Slanting Flat Elliott Wave Pattern
- SP100
- SP400 Mid-Cap
- SP500
- SPX 500
- STLG/AUD
- Stlg/US$
- STLG/USD
- STLG/YEN
- STLG/ZAR
- Stock Index
- Stock Index Tracking
- Stock Index Video
- Stock Indices
- Stock Indices Video Outlook 2023
- Stock Indices Video Outlook 2025
- Sugar
- Summary
- Tesla
- Tesla Inc
- Toyota
- Track Record
- trading
- Trusts
- Tutorial
- Uncategorized
- UniCredit
- US
- US Dollar Index (DXY) (USDX)
- US$ Index
- US-Dollar Index
- US10yrYields
- USD
- USD/ARS
- USD/CNY
- USD/IDR
- USD/INR
- USD/MXN
- USD/NOK
- USD/SEK
- USD/SGD
- USD/THB
- USD/YEN
- USD/ZAR
- Vale
- Value Line Index
- video
- VIDEO OUTLOOK 2018
- VIDEO OUTLOOK 2020
- VIX
- W.D. Gann
- WaveTrack International
- XAU Gold/Silver Index
- Xetra Dax
- XOP
- Yields
- Zig Zag
- Zinc
- ‘INFLATION-POP’
- ‘SHOCK-POP-DROP’