BITCOIN – BUBBLE OR NO BUBBLE?
by WaveTrack International| September 13, 2017 | No Comments
Bitcoin – To Be or Not To Be?!
Much hype has surrounded Bitcoin over the last few years but especially this year since prices of the crypto-currency have gained by a phenomenal +555% per cent! So far, I’ve resisted various requests to look into the Elliott Wave pattern development of Bitcoin, mainly because its data-history is relatively short, beginning from July 2010 which shortens the odds of making reliable long-term price forecasts. But also because its reason for existence relies on the idea that we shouldn’t trust the banking system allowing users to transact outside the system.
Executive Order 6102
That’s all sound logic except when you realise that governments can control transactions just as they did back in year-1933. This was when Executive Order 6102 was implemented by President Franklin D. Roosevelt which prevented the ownership of gold coin, bullion, certificates by any individual, partnership, association or corporation. Several notable arrests were made as confiscations continued within U.S. borders. If history has a precedent like this, yes, it can repeat sometime in the future given the right conditions of financial stress.
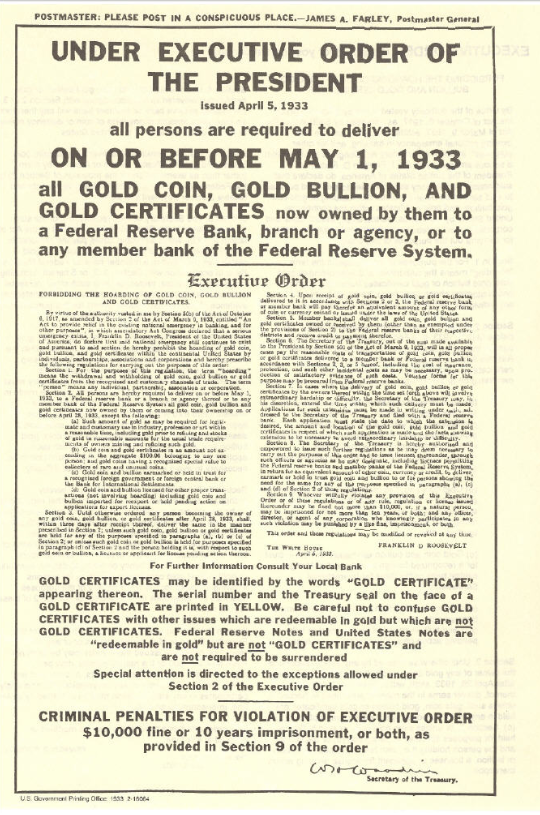
Gold Coin, Gold Bullion Confiscation by the order of the President – 1933 – image source by courtesy of Wikipedia
A modern day example surfaced in Monday’s press – the Chinese government announced it is planning to shut down platforms that transact in the buying and selling of Bitcoin. The Bank of China has led a draft of instructions that would ban Chinese exchanges from providing virtual-currency trading services. Furthermore, Chinese authorities have now declared the mechanisms that raise funding for crypto-currencies or Initial Coin Offerings (ICO’s) as illegal. How much further are these restrictions going to go?
Does this mean that we shouldn’t invest in Bitcoin? After all, many analysts are voicing concerns of a bubble that is about to burst!
Well, there’s always a chance that other governments will also close down crypto-currency platforms – that is the risk we face. But from an Elliott Wave perspective, the exponential uptrend seems likely to continue over the next year or two.
Bitcoin – Cryptocurrency – No Bubble!
A 5th wave advance began from the Jan.’15 low of 170.00. It began building into a typical step-like 1-2-1-2-1-2 sequence until earlier this year, in January ’17 when it finally underwent ‘price-expansion’ which characterises its 3rd-of-3rd-of-3rd wave acceleration. This is where this year’s gain of +555% per cent comes from. So far, this third wave impulse pattern remains incomplete, aiming for price levels towards 6932.00+/- (yes, that’s a gain of +62% per cent from current levels of 4261.00). And even after a corrective decline, the is more upside potential going forward to complete the larger five wave pattern from the Jan.’15 low.
Shorter-Term – Fib-Price-Ratios
Within this year’s 3rd-of-3rd-of-3rd wave advance, it’s finalising fifth wave advance began pulling prices higher from the July ’17 low of 1905.96 (intraday recorded 1809.26). Furthermore, this subdivides into a five wave pattern labelled in micro-degree, [1]-[2]-[3]-[4]-[5]. Wave [4] is currently engaged in a corrective decline from the current all-time-high of 4920.24 – see fig #1.
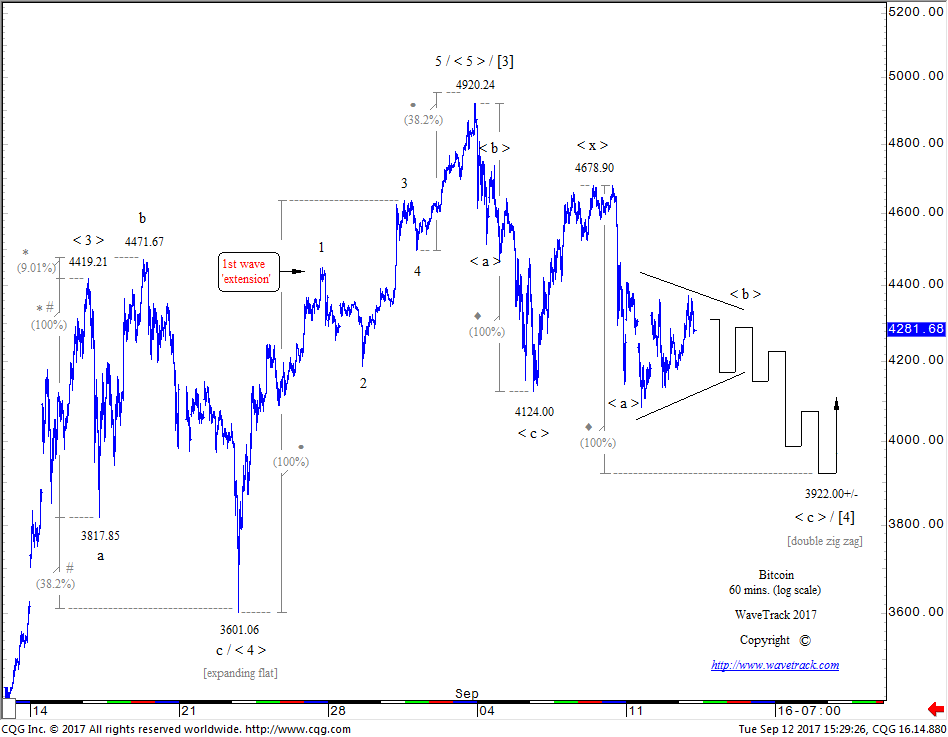
Bitcoin – 60 mins. chart – Forecast by WaveTrack International
It seems that Bitcoin unfolds into the overall rhythms and patterns defined by the Elliott Wave Principle. In this chart, we can see the finalising sequences of wave [3] advance. Its fourth wave subdivision, labelled wave < 4 > can be seen taking the form of a symmetrical expanding flat pattern from 4419.21 to 3601.06. Note the adherence of fib-price-ratios, where wave ‘a’ from 4419.21 to 3817.85 is extended by a fib. 9.01% ratio to project the high for wave ‘b’ to 4471.67 and by a fib. 38.2% ratio for wave ‘c’ to 3601.06.
The following advance as wave < 5 > unfolds into a five wave impulse pattern which includes an uncommon 1st wave ‘extension’. Its finalising fifth wave unfolds by a fib. 38.2% ratio of the net gain in the first-third sequence projecting close to the high at 4920.24.
A Counter-Trend Decline
The high at 4920.24 ended micro-wave [3] which originated from the July 26th low of 2409.21. Wave [4] has since begun a counter-trend decline, taking the form of a double zig zag pattern, labelled < a >–< b >–< c >–< x >–< a >–< b >–< c >. This appears incomplete with the pattern projecting more declines over the coming week or two.
The first zig zag ended at 4124.00 earlier this month (September) with wave < x > subsequently ending a rally to 4678.90. Should fib-price-ratio equality exist, then the secondary zig zag will ultimately test levels towards 3922.00+/-. Extending the first zig zag by a fib. 38.2% ratio projects slightly lower to 3855.00+/-. Once tested, we expect to see Bitcoin resume its larger uptrend.
Conclusion
From an Elliott Wave perspective, there seems little doubt that Bitcoin has much more upside potential, not only in the months to come but the next couple of years. Talk of a bubble burst seems far too early, even though this year’s exponential gains are impressive. The objective is to ride the wave, but get out before the inevitable collapse that will surely follow.
Ensure you’re tracking our forecasts – subscribe online for the EW-COMPASS REPORT.
Visit us @ www.wavetrack.com and subsribe to our latest EW-COMPASS report!
Solar Eclipse, Donald Trump, 7-Year Cycle and The Harbinger
by WaveTrack International| August 24, 2017 | No Comments

The Harbinger, Solar Eclipse, Donald Trump and 7-Year Cycle
The Harbinger by Johnathan Cahn or SHEMITAH REVISITED
Monday’s U.S. Solar Eclipse was quite an event, even though I was only viewing this from a live streaming event hosted by NASA. We’ve had two solar eclipses in Munich, Germany since I arrived eighteen years ago and on both occasions, took photographs of the moon’s gradual transit across the sun until just the corona was visible – amazing! But what has that to do with The Harbinger or our ‘Shemitah Forecast‘ two years ago?
The eclipse triggered another memory – it was reading Jonathan Cahn’s The Harbinger book whilst on my annual sabbatical (summer recess/vacation) a few years ago. I thought this to be a very intelligently written and well-researched book on how the Harbinger reveals a potential path of redemption for the U.S. and the World. It refers to the Bible’s various passages related to solar eclipses and its portent:
Matthew 24:29
‘The sun will be darkened, and the moon will not give its light; the stars will fall from the sky, and the powers of the heavens will be shaken’
The Harbinger, Solar-Ecplise and Donald Trump
President Trump, as head of state, seems bent on an unintentional path of self-destruction. In the light of this I wondered what his administration represents at a time of heightened geopolitical tension – especially in connection to the prophecies in ‘The Harbinger’. When I dipped briefly into Jonathan Cahn’s blog, I read that he has it on good authority that some of President Trump’s closest allies are aware of the Harbinger and some of its prophecies. Donald Trump was born on an eclipse day, adding to the intrigue and drama. Does yesterday’s solar eclipse have significance for Trump given its transit across the United States?
One of the interesting aspects of The Harbinger was its description of the 7-Year Shemitah cycle. I took some interest in this, and thoroughly checked it out. My conclusions were aired in the Elliott Wave Navigator report dt. August 10th 2015. 1508_The Elliott Wave Navigator – Complimentary PDF-Download. It mainly dramatised stock market ‘shocks’ around a 7-year period and the 50-year Jubilee year in September ’15. These cycles did signal the sharp accelerative decline of -10.7% in August and the resulting recovery which our analysis averaged historically to +23.7% per cent – the following advance was more like +18.9% per cent – pretty good! Compare BEFORE & AFTER – fig’s #1 & #2.
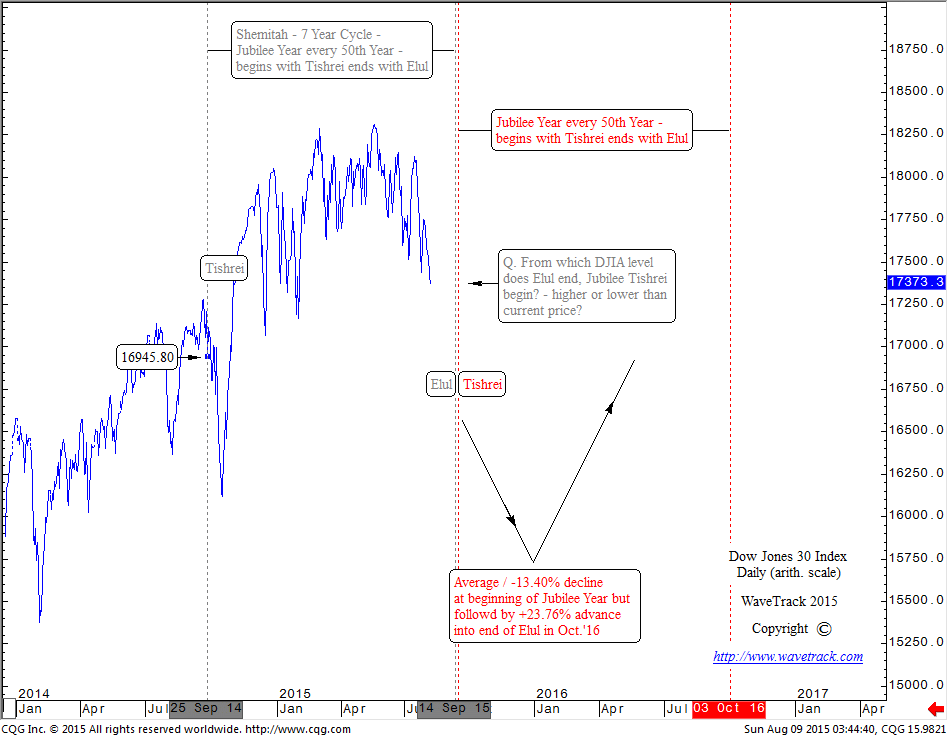
Fig #1 – Dow Jones 30 Index – Daily – Forecast 9th August 2015
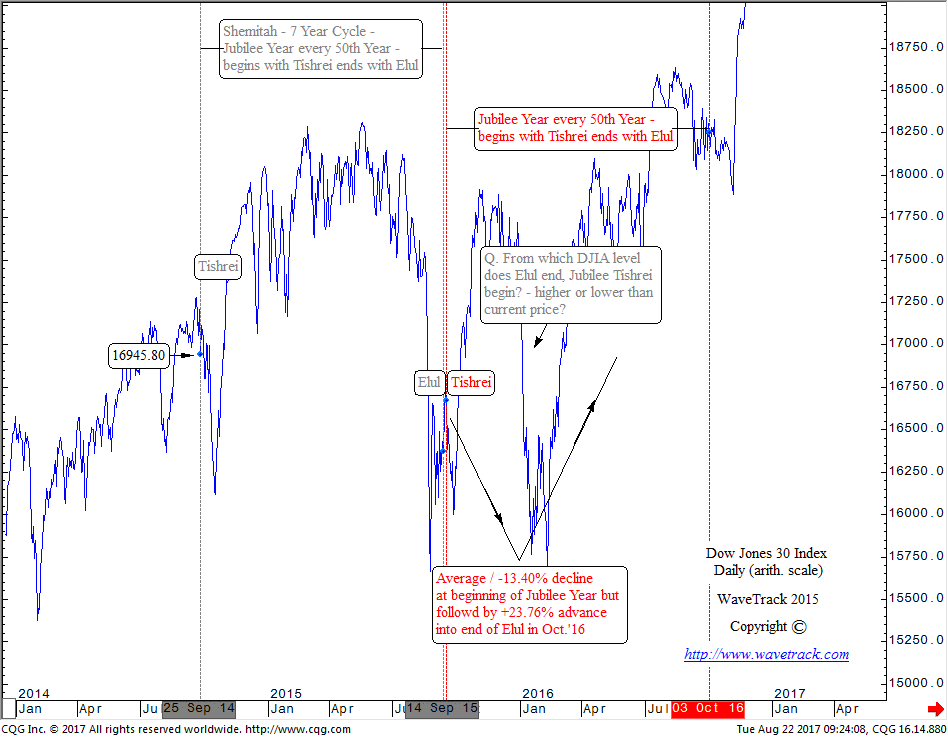
Fig #2 – Dow Jones 30 Index – Daily – Result 22nd August 2017
The Paradigm
I haven’t returned to the Harbinger or the 7-year cycle since, mainly because the next 7-year event is still some way off. But I did discover that Jonathan Cahn is preparing to publish his next book next month, entitled ‘The Paradigm’ on September 19th. Sadly, it will come too late for this year’s sabbatical, but this might be worth taking a look. Maybe it reveals another aspect of the 7-Year Shemitah cycle relevant to the current SECULAR-BULL UPTREND?!!
Most sincerely,
Peter Goodburn
XETRA DAX SETS THE TREND!
by WaveTrack International| August 21, 2017 | No Comments
Sentiment is Bearish
U.S. stock markets were reeling last week as the Trump administration was engaged in reputational ‘damage-limitation’ over the President’s Charlottesville comments that drew a moral equivalence between neo-Nazis and anti-fascists. The fallout that followed resulted in the resignation of Trump’s ‘America First’ architect Steve Bannon as White House chief strategist. Losing an ally is one thing but when major industry chiefs began to resign from Trump’s advisory councils, the markets listen, then react as they did last week with sharp declines in the benchmark S&P 500 index.
This latest sell-off comes at a time of heightened anxiety over recent warnings from industry luminaries over the high readings from the CAPE (Cyclically-Adjusted Price/Earnings) and S&P/Sales ratios. Yes, they are historically high but are not at all-time highs and even if they were, as the time-old adage states, never be afraid of buying high if the market is still trending higher!
Whilst sentiment is clearly bearish right now, there are signs that this will change later this week. The S&P, Dow Jones and Nasdaq 100 are engaged in corrective declines which are somewhat complex in their Elliott Wave pattern criteria, which opens the way for slightly variant permutational possibilities. But Europe’s Xetra Dax has no such ambiguities.
Xetra Dax Sets the Trend
The Dax began declining from its June ’17 high of 12948.50 (futures) as a 4th wave correction within the dominant, larger uptrend that started from the Feb.’16 low. It has since completed a picture-perfect three wave zig zag pattern into last week’s low at 11926.00 – see fig #1.

Fig #1 – XETRA DAX SETS THE TREND! 240 mins. – by WaveTrack International
Labelled in minute degree, a-b-c, this pattern subdivides into a required 5-3-5 sequence whilst adhering to dimensionally perfect Fib-Price-Ratio (FPR) measurements. For example:
Wave a x 61.8% ratio minus 12303.00 = Wave c low at 11926.00
In other words, extending wave a by a fib. 61.8% ratio at its low of 12303.00 projects a terminal low for wave c at the exact low of 11926.00. This use of the ‘golden-ratio’ and phi is paramount in verifying corrective patterns like this.
The following advance from the low of 11926.00 has unfolded into a five wave expanding-impulse pattern to 12295.00 (see inset). This ‘proofs’ the preceding zig zag ended at 11926.00 whilst confirming a new uptrend. It’s only a matter of a day or so before the index turns back higher.
The Xetra Dax, therefore, sets the trend for other major indices to begin a synchronised recovery during the coming week. So fear not – shake off the bearish sentiment – start to look forward to some impressive gains!
Learn how to take advantage of WaveTrack’s Fibonacci-Price-Ratios!
Watch WaveTrack’s Fib-Price-Ratio videos on youtube to see how these measurements are applied. WaveTrack’s first Elliott Wave Academy video
Ensure you’re tracking our forecasts – subscribe online for the EW-COMPASS REPORT.
Visit us @ www.wavetrack.com and subsribe to our latest EW-COMPASS report!
Check out WaveTrack’s latest CURRENCY VIDEO @ CURRENCIES and INTEREST RATES VIDEO PART III and subsribe to our latest EW-COMPASS report!
Global Opportunities, US Risks and the Grand ‘Re-Synchronisation’
by WaveTrack International| August 17, 2017 | No Comments

Global Opportunities, US Risk – Global Outlook Report by Gail Fosler in collaboration with Peter Goodburn
Global Financial Opportunities, US Risks
Elliott Wave Indicators
It was in early-January 2010 that we caught the first glimpse of how the US asset price recovery was developing. Even if contrived by central bank intervention following the end of the financial-crisis just 9-months earlier. It became apparent as major US stock prices continued higher along with commodity prices that Elliott Wave ‘impulse’ patterns were emerging. This was confirming the continued upside progress which has lasted another 7-years to this day.
The definition of an uptrend, in layman terms, is a price chart which depicts the progress of higher-highs and higher-lows. In Elliott Wave Theory (EWT), this is somewhat more explicit. Elliott Wave defines an uptrend as a five wave pattern development, an ‘impulse’ pattern, 1-2-3-4-5 but with very specific parameters. Why does this provide such a huge advantage over other methods? Because it also adds price ‘dimension’ and often some degree of ‘timing’ in the assessment for completion. In this way, EWT is classified in scientific terms as a ‘deterministic’ or predictive system. As by the means of this ‘string’ of patterned price data it can be ‘nonlinearly’ extrapolated to project the future course of price activity.
The ‘Inflation-Pop’
Evidence of a five wave impulse pattern development from the financial-crisis lows of end-2008, early-2009 led to an amazing financial discovery. It projected a continuation of the asset price recovery to new record highs! Even though this event was many years into the future. The continuation of gains in Commodity prices and Emerging Markets was projected to new all-time-highs. Actually, several years into the end of the current decade and perhaps early into the next! This event is termed as the ‘INFLATION-POP’ because its specific Elliott Wave pattern development was identified as a three wave zig zag sequence – see fig #1. This meant it would ultimately test new record highs in a relatively short period of time prior to the asset bubble getting ‘popped’.
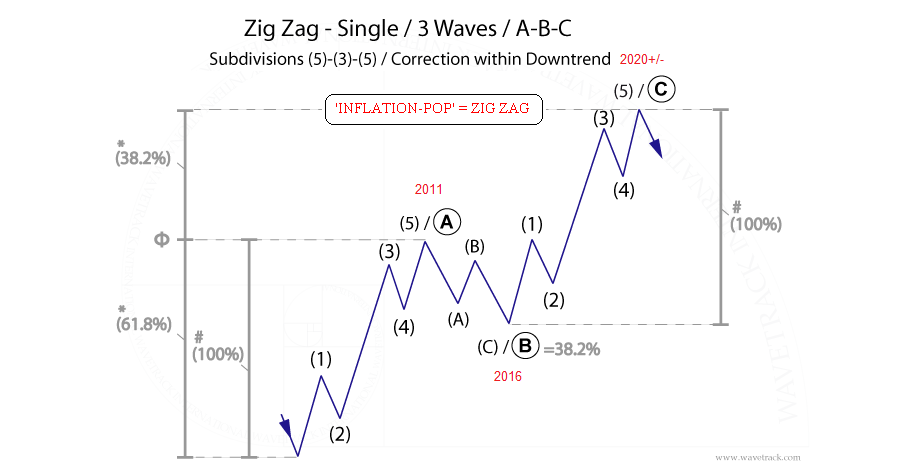
Zig Zag Single – Elliott Wave Pattern ©WaveSearch
Grand ‘Re-Synchronisation’
The fixed positive-correlation between US stock indices and commodities continued until late-2012 when peaks were broken above in the benchmark S&P 500 whilst commodities continued to trade lower. This dislocation ended in Jan/Feb.’16 when both asset classes formed major lows. Representing a corrective decline in the S&P 500 from the May ’15 high but a far larger corrective decline in commodities that began from the peaks of 2011. When these formed major lows together, we termed this event as the Grand ‘RE-SYNCHRONISATION’ process. It triggered a simultaneous ‘BUY’ signal for both asset classes but it also brought PATTERN RE-ALIGNMENT together. See fig #2.
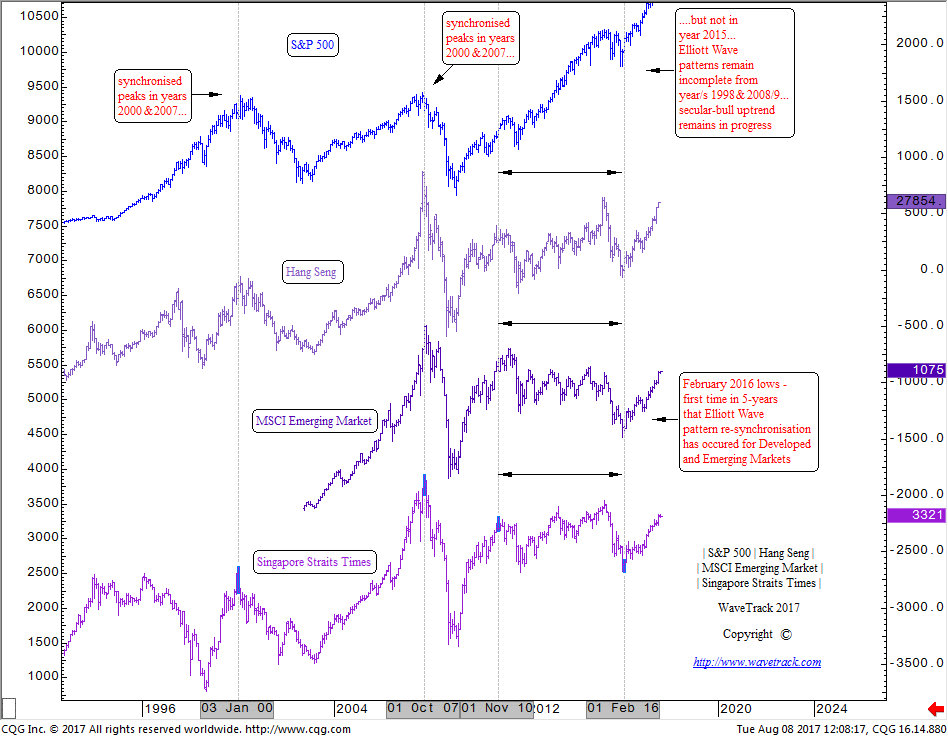
SP500 | Hang Seng | MSCI Emerging Markets | Singapore Straits Times – Correlation Study by WaveTrack International
Since then, prices have surged higher as the next phase of the ‘inflation-pop’ gets underway. Price trends like this do not head directly higher in a straight-line. Instead, they are dynamic in their progress unfolding with alternating corrective declining sequences along the way. The Elliott Wave methodology is equipped to identify those occasions when pockets of corrective price declines are about to begin. But overall, the major uptrends are set to continue in the years ahead.
Gail Fosler Group LLC – Oil Prices, the US Dollar, and Emerging Markets
Much of our analysis has overlapped with the findings of one of our closest allies, the Gail Fosler Group LLC. Gail is a formidable economist, twice awarded the nomination of America’s most accurate economic forecaster by the Wall Street Journal. She is the former president and trustee of The Conference Board, and is a member of The Conference Board’s Global Advisory Council.
Gail’s team of economists have recently updated their outlook in their latest ‘Global Opportunities, US Risks’ report. An excerpt ‘Oil Prices, the US Dollar, and Emerging Markets‘ is posted on their website. You can read an extract in these links. The full report is available too – just contact Gail’s team.
You’ll be amazed at how one of America’s most acclaimed economists looks at the world’s financial developments and how it dovetails into our own ‘inflation-pop’ hypothesis.
Gail’s report is ‘Vitally Important for Traders in Securities, Commodities, Investors, Bankers, Business Managers (CEO’s) and Trusts’. And with recent geopolitical risks being heightened, I think we all agree how important it is to understand how the current financial landscape is unfolding.
Yours faithfully,
Peter Goodburn, CFTe, MSTA
Managing Director & Chief Elliott Wave Strategist
WaveTrack International
USD Dollar Index | EUR/USD – Fib-Price-Ratio Tutorial
by WaveTrack International| August 14, 2017 | No Comments

US$ Dollar Index compared to EUR/USD – Fibonacci-Price-Ratio Tutorial
USD Dollar Index | EUR/USD
It is almost two weeks ago that we published an Elliott Wave example of how to measure the termination of a 5th wave extension. In this case a 5th wave within an ‘expanding-impulse’ pattern – read USD Index article here. Our chosen subject was the USD dollar index (DXY) and its five wave decline that began from 96.51 ending into the early August low at 92.55. The application of Fib-Price-Ratios and phi creating a ‘golden-section’ by using 61.8 and its reciprocal 161.8 is a common phenomenon. This Fib-Price-Ratio can be used on a daily basis to determine the terminal high or low of an ‘expanding-impulse’ pattern. In this earlier example, extending waves (i)-(iv) by a fib. 61.8% ratio projected the terminal low for wave (v).
In this latest example for the US$ dollar index and the EUR/USD, we use the reciprocal 161.8% ratio.
Fibonacci-Price-Ratios
With the DXY low at 92.55 confirming the end of its five wave decline, the index begins a larger counter-trend upswing, beginning with a five wave advance as minute wave a – see fig #1, left. This five wave pattern is classified as an ‘expanding-impulse’ because one of its impulse sequences, [i]-[iii]-[v] has undergone ‘price-expansion’, one sequence being obviously larger than the other two, in this case, a common 3rd as minuette wave [iii].
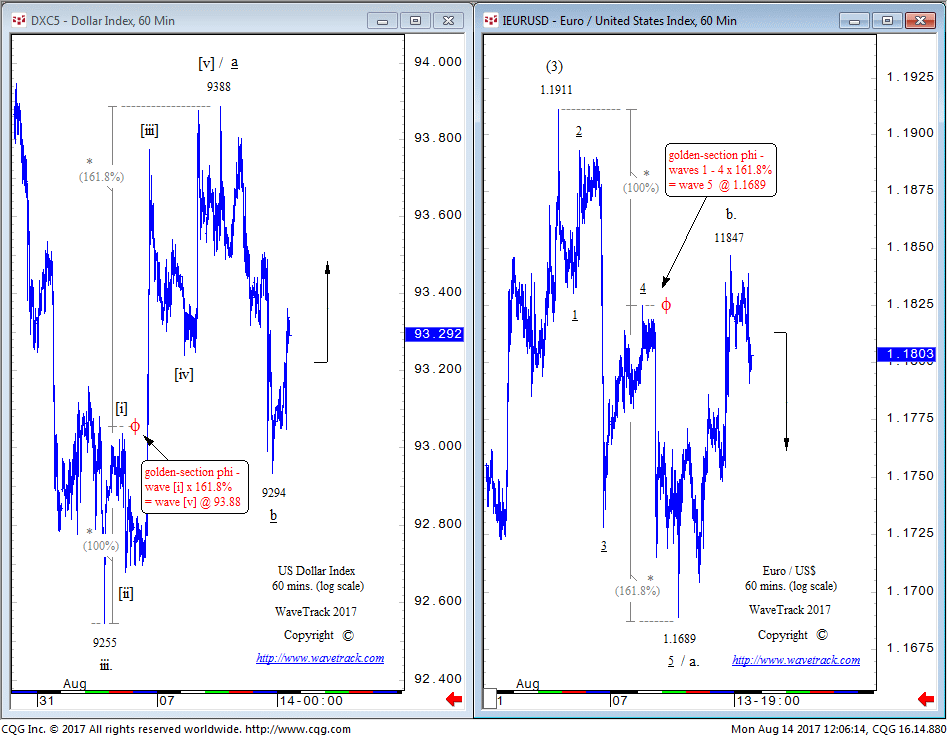
US Dollar Index compared to EUR/USD – 60 mins. by WaveTrack International
Extending minuette wave [i] by a fib. 161.8% ratio projects within a few pips of the terminal high of wave [v] at 93.88, a common fib-price-ratio relationship.
By comparison, the EUR/USD declined synchronously from 1.1911 as the same five wave ‘expanding-impulse’ pattern ending at 1.1689 – see fig #1, right. In contrast, though, a slightly different application of the 161.8% ratio is used. Relative to wave 1, wave 4 is a very deep correction, even approaching the overlap of wave 1. When 4th waves unfold deeply like this, we tend to find a frequency recurrence where waves 1-4 is extended by a fib. 161.8% ratio – same ratio, different location for the measurement. This projected the EUR/USD to the exact low of 1.1689.
So there it is. Using a fib. 161.8% ratio to project the terminal high/low of an ‘expanding-impulse’ pattern but two slightly different concepts of expression! These are common ratios to watch for and they recur throughout the week. Now see if you can identify some!
Learn how to take advantage of WaveTrack’s Fibonacci-Price-Ratios!
Watch WaveTrack’s Fib-Price-Ratio videos on youtube to see how these measurements are applied. WaveTrack’s first Elliott Wave Academy video
Ensure you’re tracking our forecasts – subscribe online for the EW-COMPASS REPORT.
Visit us @ www.wavetrack.com and subsribe to our latest EW-COMPASS report!
Check out WaveTrack’s latest CURRENCY VIDEO @ CURRENCIES and INTEREST RATES VIDEO PART III and subsribe to our latest EW-COMPASS report!
REELIN’ IN THE YEARS! – A Look-Back to the Secular-Bull Uptrend of the 1990’s & New Updates!
by WaveTrack International| August 7, 2017 | No Comments
S&P 100 Index & Dow Jones 30 Index – Secular-Bull Uptrend Intact! – by Peter Goodburn
Mainstream Elliott Wave believe a financial collapse is imminent. However, WaveTrack’s analysis comes to a different conclusion. Let’s consider the arguments why a Secular-Bull Uptrend is still intact?!
‘Your everlasting summer
You can see it fading fast
So you grab a piece of something
That you think is gonna last’
I came across this chart of the S&P 100 whilst looking through our WaveSearch archives this w/end and thought how appropriate it would be to revisit a forecast of the past, somewhat forgotten, that I thought was gonna last!
Appropriate for two reasons – first, because it’s almost 18-years old and yet still remains valid to this day along with Fib-Price-Ratios et al. Second, it comes at a time when mainstream Elliott Wave analysis is forewarning of a similar approach to ending primary wave 5’s advance from the 2009 low. I’d like to comment on the qualities of the first and respond to the second.
Forecasting the end of the 1990’s Secular-Bull Uptrend
To gain confidence in forecasting the present, the future, we must rely on the timeless qualities of Natural Law applied in the past. If we can discover a consistent method within these Laws, then we increase the probability of understanding the path that lies ahead, in the future.
The final phase of the S&P 100’s secular-bull uptrend of the 1990’s is of particular interest because it embodies the concept of Fibonacci Ratio and Proportion as a complementary methodology to the Elliott Wave Principle (EWP). Applied correctly, it goes far beyond the subjective nature of the human mind that creates concepts according to its own belief system. Indeed, it adds empirical objective evidence, a combination of the quantitative qualities of geometric ratio and proportion along with the qualitative aspects of the EWP.
Fibonacci-Price-Ratios
This chart, published on November 18th, 1999 labelled the entire 1990’s advance as unfolding into a five wave ‘expanding-impulse’ pattern. But more importantly, approaching a major, terminal high towards 862.00-67.00+/-. See fig #1.
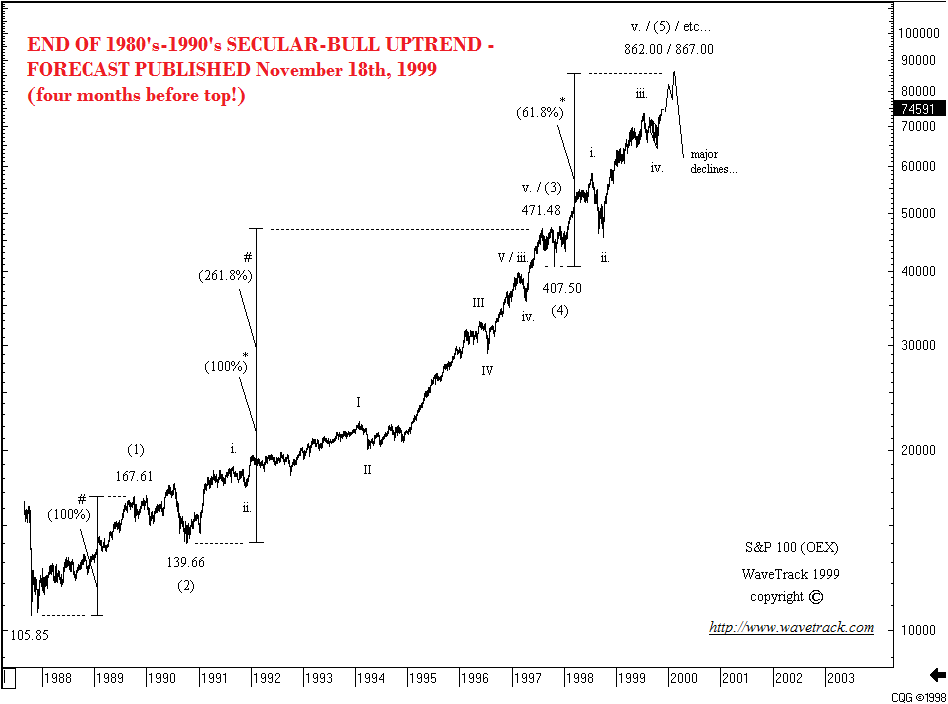
S&P 100 – Forecast 18th November 1999 – Financial Forecasting by WaveTrack International
Labelled in intermediate degree, (1)-(2)-(3)-(4)-(5), wave (5) upside targets were derived where it unfolds by a fib. 61.8% ratio of wave (3). You may also notice that wave (3) unfolded by a fib. 261.8% ratio of wave (1) – whilst this fib-price-ratio can sometimes occur, we have since discovered this to be a rare recurrence. More likely, the initial 1-2-1-2-1 sequence between 105.85-223.60 is best extended by a fib. 161.8% ratio in order to project the final peak – alternatively, the final fifth wave unfolds by a fib. 100% equality ratio of the 1-2-1-2-1 sequence – see fig #2. The result is the same, however, with FIB-PRICE-RATIOS corroborating the approach of a TERMINAL PEAK.
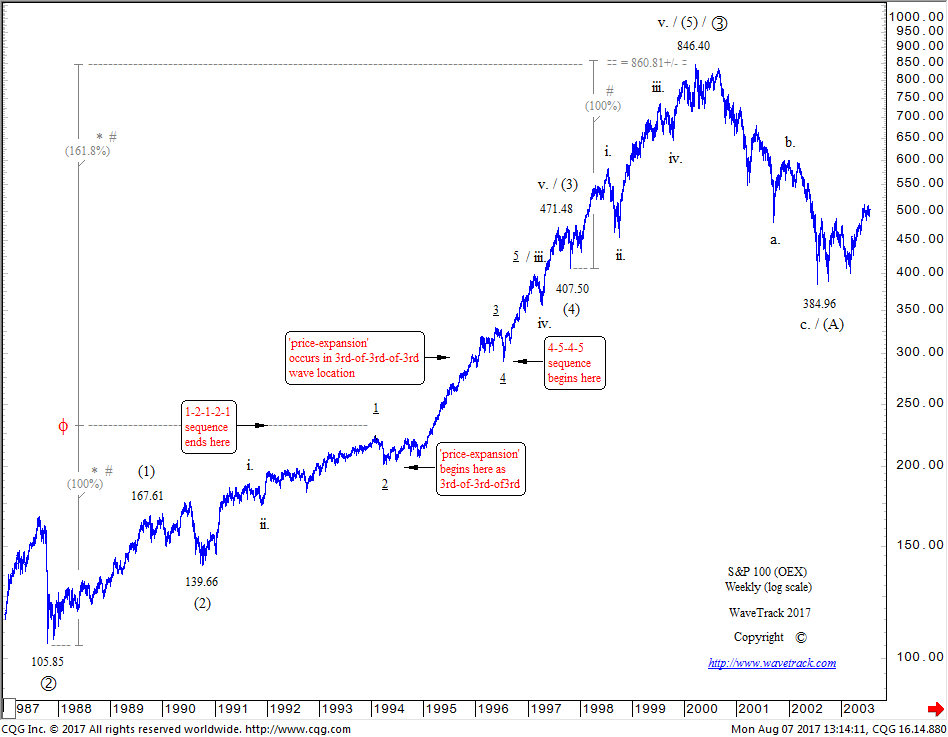
S&P 100 – Result 2017! Financial Forecasting by WaveTrack International
History has since told the ongoing story. The end of the 1990’s BOOM eventually went BUST four months later from a peak of 846.40, just 16 points from the projection! The following collapse was later known as the dot.com BUST! And initiating the beginning of a primary degree, 4th wave correction that ultimately ended in March ’09.
An Imminent Top for Primary wave 5? – No!
Correlation studies feature as a main part of our Elliott Wave assessment. This has been instrumental in forecasting the correct pattern sequence unfolding for major global indices over the last several years (including the S&P 500 and the Dow Jones).
For example, global indices will end their respective Elliott Wave patterns and each form major peaks and troughs at approximately the same time. Actually, within several months of each other. This was the case when stock markets reached peaks in October 2007 ahead of the financial-crisis. And also at the end of its decline in Oct.’08 and March ’09. This was true when comparing U.S. indices against very different Elliott Wave patterns that were at terminal locations for European and Asian indices. It was also replicated across different asset classes, like Emerging Markets and Commodities.
Mainstream Elliott Wave
Mainstream Elliott Wave analysts are forecasting that there is a more imminent peak being approached by the major U.S. indices in the months ahead, in 2017. Would it not be more reasonable to expect similar terminal patterns being approached in European indices, Asian indices, Emerging Markets and Commodities? Because, if a terminal peak is being approached as primary wave 5, it would open the way for a systemic collapse. Why? Because it also ends a 5th wave in cycle degree that dates back to the Great Depression low of 1932. But are those other stock indices, Emerging Markets and Commodities in pattern alignment?
No, they are not.
Dow Jones 30 and why the Secular-Bull is still intact
In our annual report of 2015, published Dec.’14, we cited why the secular-bull uptrend of primary wave 5 would last into the end of the current decade. There were compelling reasons attributed to W.D. Gann’s 90-year cycle, a geometric Fib-Price-Ratio convergence-matrix in the Dow Jones index far above current levels. And just as important, the fact that other major indices, asset classes like Emerging Markets and Commodities were not in EW pattern alignment.
Since that report, we have updated the progress of these asset classes each month in the institutional EW-Navigator report and at 6-month intervals in our special Video Series, the last published in June (2017).
In these reports, we cited that the Dow Jones (DJIA) was still engaged in primary wave 5’s advance. This advance would ultimately prolong the secular-bull uptrend into the end of Gann’s 90-year cycle and with upside price targets to forty-thousand 40,000.00+/-. See fig #3. Three fib-price-ratio measurements were used over differing degrees of trend and each projected a convergence-matrix towards the 40,000.00+/- level. When a convergence like this occurs, it attracts the price activity towards it. Call it Fibonacci-Price-Ratio magic. Or in more scientific terms a ‘high-frequency recurrence‘.

Dow Jones 30 Index – Quarterly Forecast – Secular-Bull Uptrend Intact!
Prolonging Primary wave 5’s Secular-Bull Uptrend
Let’s assume our analysis is correct. Then primary wave 5 IS NOT heading towards a terminal peak in the next few months. We are labelling primary wave 5’s advance from the March ’09 low of 6470.00 in intermediate degree, (1)-(2)-(3)-(4)-(5). This confirms the approach to a terminal high for intermediate wave (3) sometime into year-end (2017) or latest into Q1-2018.
The reason for not labelling this as a terminal peak for wave (5) is because other asset classes, Emerging Markets and Commodities only began the final phase of the ‘INFLATION-POP’ advance last year. Starting from the ‘RE-SYNCHRONISATION’ lows of Jan/Feb.’16. They are still in the relatively early stages of a 3-4 year uptrend. This doesn’t fit at all with mainstream perma-bear forecasts for an imminent collapse that begins a secular-bear decline. It’s far too early.
This year’s upside forecast projecting a terminal high as intermediate wave (3) is right on track. Once completed, it opens the way for a -20% or -25% per cent correction in major U.S. indices as wave (4). However, this is not nor can it be, the beginning of a secular-bear downtrend. It’s only a 4th wave correction, significant as it will be!
Learn how to take advantage of WaveTrack’s Fibonacci-Price-Ratios!
Watch WaveTrack’s Fib-Price-Ratio videos on youtube to see how these measurements can be applied. WaveTrack’s first Elliott Wave Academy video
Ensure you’re tracking our forecasts – subscribe online for the EW-COMPASS REPORT.
Visit us @ www.wavetrack.com and subsribe to our latest EW-COMPASS report!
Check out WaveTrack’s latest CURRENCY VIDEO @ CURRENCIES and INTEREST RATES VIDEO PART III and subsribe to our latest EW-COMPASS report!
US-Dollar Index and the Power of Fibonacci Ratio’s
by WaveTrack International| August 3, 2017 | 2 Comments
US-Dollar Index
The latest decline in the US-Dollar Index (DXY) has pulled levels down to next target levels at 92.55+/-. Hence, this target level ends its larger minor degree 3rd wave sequence within this year’s impulse downtrend. Momentum shows an oversold condition as last week’s IMM data highlights money managers piling out of dollar holdings. The net short positioning is at -$9.7bn, which constitutes the biggest bear bet since 2012 when the index was trading at 79.27. Surely, a counter-trend 4th wave rally seems inevitable but from what exact level – beginning from where? This is important to assess because as we all know, getting into a trade, even slightly before it turns, can often test one’s resilience.
Without the use of geometric analysis, Elliott Wave can often be somewhat ‘subjective’ in its assessment of locating a pattern development. But adding this to your repertoire, you quickly discover a way that overturns subjectivity, turning the methodology into a more quantitative, objective process.
What is geometric analysis? It’s a branch of mathematics concerned with questions of shape, size, relative position of figures (patterns) and the properties of space. I’d also like to also add the word ‘dimension’ because in Elliott Wave analysis, dimension is one of the key attributes in identifying any one of R.N. Elliott’s 13 patterns.
The tools to work with are two-fold. First, the Fibonacci ratio sequence and second, using our natural ‘eye’ to identify the dimension of each EW pattern. For the latter, we have to train our ‘eye’ to these patterns. So think pattern, not waves! Waves are the components of the pattern – they are very important, but its more important to train ourselves in pattern identification.
Fibonacci-Price-Ratios
Each of R.N. Elliott’s 13 patterns unfold to common fib-price-ratio measurements which define their dimensions, or shape. There are slight variations but these are confined into maximum limits. In this study of the US-Dollar Index, we examine a segment/component within its recent decline and attempt to determine its terminal low.
The DXY began declining into a five wave expanding-impulse pattern from January’s high of 103.82. We already know from using fib-price-ratio analysis that a larger 3rd wave impulse pattern is approaching downside completion from 102.26. Measuring the minute degree subdivision of this 3rd wave, 1-2-3-4-5, a 5th wave low projects to 92.50+/- where minute wave 5 unfolds by a fib. 61.8% correlative ratio of waves 1-3. Can the 92.50+/- level be verified within the substructure of minute wave 5’s final phase of the decline?
Minute wave 5 can be seen subdividing into minuette degree, [i]-[ii]-[iii]-[iv]-[v] – see fig #1. It begins subdividing into a fractal series of 1-2’s, three in total before ‘price-expansion’ unfolds defined as the 3rd-of-3rd-of-3rd wave sequence, between 95.92 and 94.48 as micro-wave [3]. What follows is a compensatory amount of 4-5’s, three in all to the current low at 92.55. But can Fib-Price-Ratios help identify this low?

US-Dollar Index – 60 mins. – FIB-PRICE-RATIO Tutorial – 5th Wave Projection – How to Measure Termination!
Best Fibonacci-Price-Ratio Techniques
One of the most common fib-price-ratio techniques that can be used in identifying the terminal low of a five wave impulse pattern like this is to extend waves [i]-[iv] by a fib. 61.8% ratio. In this example, it projects wave [v] to a low at 92.64+/-. That’s in close proximity to the 92.50+/- measurement derived from minor degree measurements. When two or three fib-price-ratios meet or converge like this, it heightens the probability of a reversal-signature.
Yesterday’s action (August 2nd) saw the DXY trade momentarily below these target levels. However, it quickly staged ‘rejection’, isolating the low as a single 60 minute bar. This is a great ‘reversal-signature’ because the DXY responded so well to the number. Even better if it undergoes an overshoot but speedily responds higher without looking back.
The confidence fib-price-ratios bring to the table are profound when it comes to our decision-making process. To witness and learn this process has huge benefits for each and everyone’s foray into the journey of trading.
Learn how to take advantage of WaveTrack’s Fibonacci-Price-Ratios!
Watch WaveTrack’s Fib-Price-Ratio videos on youtube to see how these measurements can be applied. WaveTrack’s first Elliott Wave Academy video
Keep tuned for more updates!
Ensure you’re tracking our forecasts – subscribe online for the EW-COMPASS REPORT.
Visit us @ www.wavetrack.com and subsribe to our latest EW-COMPASS report!
Check out WaveTrack’s latest CURRENCY VIDEO @ CURRENCIES and INTEREST RATES VIDEO PART III and subsribe to our latest EW-COMPASS report!
FIBONACCI-PRICE-RATIO Tutorial
by WaveTrack International| August 1, 2017 | 2 Comments
Fibonacci-Price Ratios – 5th Wave Extensions – How to Measure Termination!
Eurostoxx 50 Index
Whilst the Dow Jones Industrial Average (DJIA) trades to new highs, Europe’s equivalent bull run from last November’s low has temporarily been interrupted. The reason for this relative period of underperformance lies in the Elliott Wave pattern development. Our case study is the benchmark Eurostoxx 50 index and it offers an interesting insight to a very uncommon event – a 5th wave extension.
The Elliott Wave Principle states that a five wave impulse pattern denotes the direction of the dominant trend. There are two types of impulse patterns, the expanding-impulse and the diagonal-impulse. Both of these patterns contain a five wave sub-structure/subdivision. The expanding-impulse is the more common pattern of the two which is the subject of this tutorial.
Every expanding-impulse pattern contains one impulse sequence, either waves 1, 3, or 5. These waves visibly ‘extend’ – this means they measure larger than the other two waves – 2 or 4. About 80-85% per cent of the time, the extension or as we often term as ‘price-expansion’ occurs in the 3rd wave location. Therefore, those occasions where the 1st or 5th wave undergoes price-expansion are relatively infrequent. Because a high percentage figure is attributed to 3rd wave extensions, we often forget what a 1st or a 5th wave extension looks like. And when they do appear, how to determine the terminal high of the impulse pattern it is part of?
Fibonacci-Price-Ratios
Over the last 25-years, we’ve discovered that each of R.N. Elliott’s 13 patterns unfold to certain dimensions defined and measured using Fibonacci-Price-Ratios. The Eurostoxx 50’s five wave expanding-impulse advance from the Nov.’16 low of 2874.00 (futures) offers a good example of what a 5th wave extension looks like. And in our case more importantly – how we can measure its termination – see fig #1.
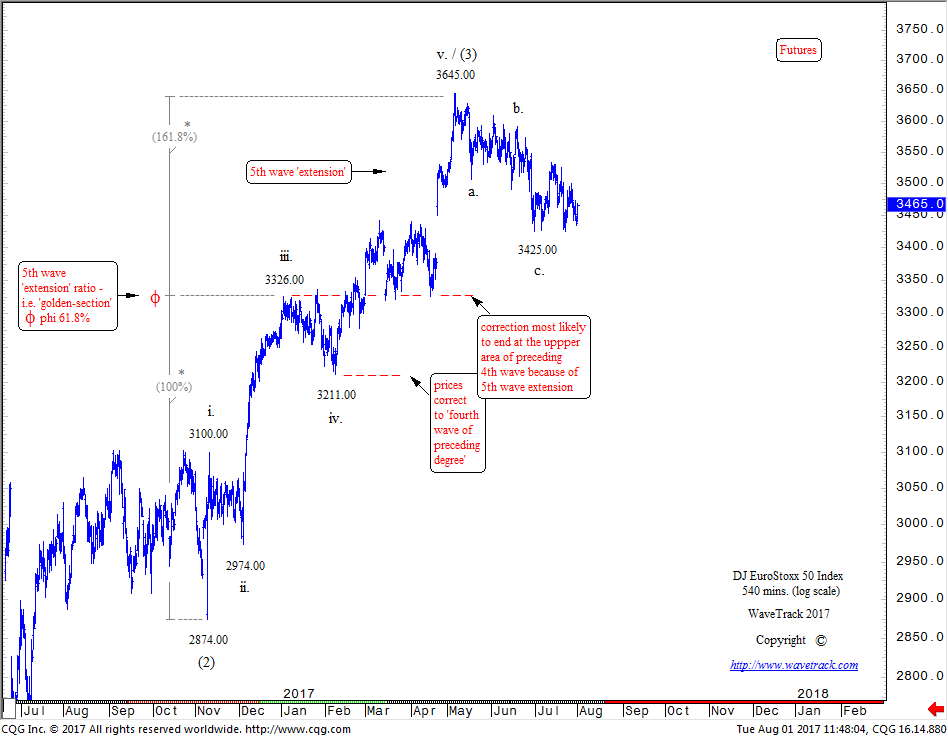
Fig #1 – EuroStoxx 50 – 540 mins. – Fibonacci-Price-Ratio Tutorial
This advance is labelled into its required five wave structure and assigned to minor degree, i-ii-iii-iv-v. Waves i-ii-iii are normal enough as is minor wave iv. four. However, when wave v. five begins its advance from 3211.00, it visibly unfolds larger than its predecessors, waves i. one and iii. three. Now, the correct way to measure the terminal high of this 5th wave is different in circumstances when an expanding-impulse pattern unfolds with a 1st or 3rd wave extension. In the case of a 5th wave extension, minor waves i-iii one-three are extended by a fib. 61.8% ratio, as follows:
• minor wave i. one (2874.00) to minor wave iii. three (3326.00) x 61.8% = minor wave v. five to 3640.00+/-
The actual high ended minor wave v. five just 5 points deviation at 3645.00.
When fibonacci-price-ratios are applied to the correct points in the Elliott Wave process, incredibly accurate forecasting is realised. When prices respond to predetermined upside targets like this, it transforms a subjective study of analysis into an objective one. It offers a quantitative attribute to a qualitative study, something quite unique in the field of financial forecasting.
Learn how to take advantage of WaveTrack’s Fibonacci-Price-Ratios!
Watch WaveTrack’s Fib-Price-Ratio videos on youtube to see how these measurements can be applied. These videos are gems of know-how for those who have eyes to see! WaveTrack’s first Elliott Wave Academy video
Keep tuned for more updates!
Ensure you’re tracking our forecasts – subscribe online for the EW-COMPASS REPORT.
Visit us @ www.wavetrack.com and subsribe to our latest EW-COMPASS report!
Check out WaveTrack’s latest CURRENCY VIDEO @ CURRENCIES and INTEREST RATES VIDEO PART III and subsribe to our latest EW-COMPASS report!
GBP/AUD – BE THOROUGH, KNOW THE BIG PICTURE!
by WaveTrack International| July 24, 2017 | 2 Comments
GBP/AUD – Post-Brexit
The International Monetary Fund has just announced a downgrade in its growth forecasts for the U.K. economy. It is revising the 2017 expansion by 0.3% – from 2.0% per cent to 1.7% per cent. This is the first time it has adjusted the figures post-Brexit.
Sterling/British Pound has recently traded higher against the US$ dollar prior to the GDP release but this is more to do with US$ dollar weakness than sterling strength. The Pound is still struggling to gain upside momentum across several other currency crosses, including the Aussie Dollar – we thought to take a more in-depth look at the GBP/AUD.
Establishing Direction
The results of this Elliott Wave analysis reveals the current direction of the GBP/AUD but also something more interesting than this too. Yes, the direction is downwards at the moment. Shorter-term patterns show the October ’16 – May ’17 upswing ended a counter-trend zig zag pattern between 1.5791 and 1.7652. This explains why it has rapidly declined afterwards. The zig zag ended a 4th wave corrective upswing, the following decline has begun a 5th wave decline. But the real catch is inserting the larger five wave impulse decline that began from the earlier Sep.’15 peak of 2.2177 into the big picture. Knowing how this fits into the larger, longer-term pattern development will help you to avoid falling into certain traps later.
Know the Big Picture
The Elliott Wave Principle tells us that the direction of trend is determined by a five wave sequence. If you identify a five wave impulse pattern trading higher, that defines the direction of trend, vice-versa if the impulse pattern is declining. But there are exceptions – if the five wave impulse is in a terminal location, i.e. is itself a final 5th within the larger/aggregate pattern, or perhaps as wave C within a zig zag. In these cases, the direction of the impulse is about to go into reverse. There is another exception too, one which R.N. Elliott discovered that is actually, mostly underestimated because of its recurrence frequency – it’s the expanding flat pattern. This subdivides 3-3-5, so its third and final sequence unfolds into a five wave pattern, then following completion, trend changes into the opposite direction. The GBP/AUD weekly data-series provides us with an example of an expanding flat, but with an unusual twist.
Expanding Flat
Before taking a look at the expanding flat, let’s see how it fits into the long-term picture. The wave count of the GBP/AUD confirms its decline from the year-1865 period ended a five wave impulse pattern into the October 1976 low of 1.2840. A multi-decennial zig zag upswing has since begun where cycle wave A ended the initial advance into the Sep.’01 high at 3.0392. The quality of this advance which unfolded into a five wave diagonal remains the cornerstone or the foundation for the continuation of this long-term upswing. Wave B of the zig zag then ended its decline in March ’13 at 1.4381. This was a really deep correction, more than a typical fib. 76.4% retracement so there is a relative probability that wave B ended there with cycle wave C advances now underway.
Cycle wave C has begun lifting higher as primary wave 1 ending into the Jan.’14 high of 1.9187 – see fig #1. But after that, an unusual expanding flat has unfolded as primary wave 2 which is still working lower to this day. Unless you know the longer-term picture, it would be easy to misinterpret this advance from 1.4381 to the Aug.’15 high of 2.2177 as ending a counter-trend zig zag with trend now downwards – but it can’t be if the preceding uptrend was already established in cycle wave A’s five wave diagonal advance mentioned earlier – neither can cycle wave B extended lower because it was already very deep when it completed at 1.4381. And so, through a logical process of deduction, we arrive at this latest count where primary wave 1 of cycle wave C ended an initial advance to 1.9187 with wave 2 following but unfolding into an expanding flat.
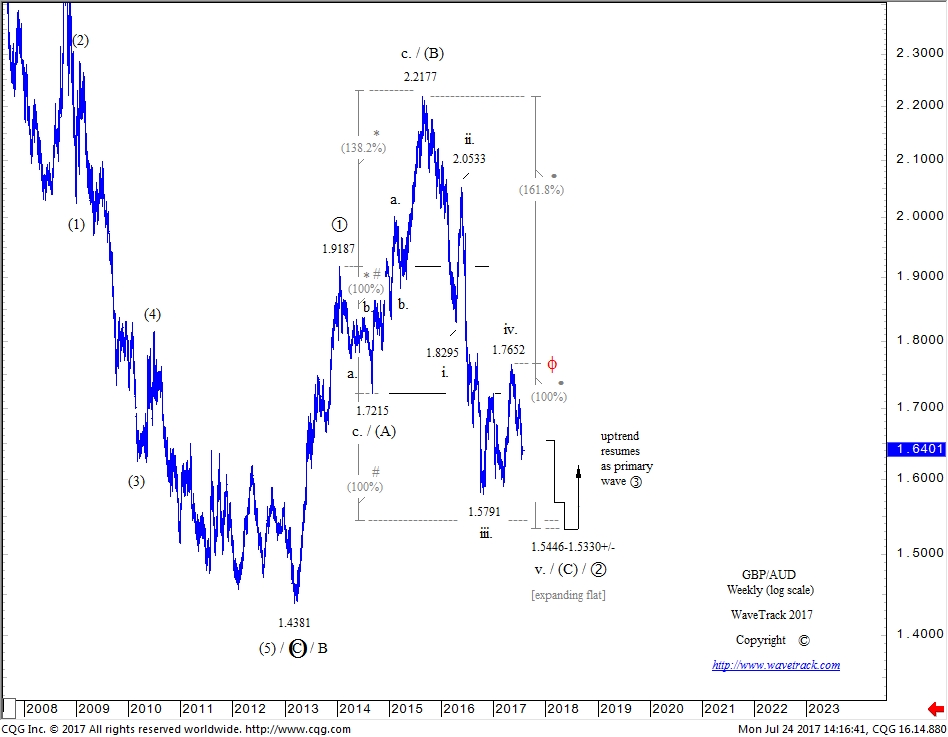
GBP/AUD – Weekly Chart
Fibonacci-Price-Ratios
There are common Fib-Price-Ratios that govern expanding flat patterns and these help identify their completion. For example, once the initial swing has unfolded as wave (A) of the pattern, extending this by a fib. 14.58%, 23.6% or 38.2% (subliminal) ratio, above and below, sets targets for completing waves (B) and (C). These tend to form the measured reversal levels about 80% per cent of the time. About 15% per cent end outside of this range at the fib. 61.8% ratio level and the remaining 5% per cent extend to what we describe as expansive ratios, i.e. 100%, 1.236%, 138.2%. In other words, the inverse of subliminal ratios. These are rare, but occasionally, we manage to identify one – and yes, this applies to primary wave 2 of the GBP/AUD count.
GBP/AUD and the Expanding Flat pattern
The origin of primary wave 2’s expanding flat begins from 1.9187 with intermediate wave (A) declining into a short retracement to 1.7215 – see fig #1 again. Wave (B) then staged a huge advance to 2.2177, extending wave (A) by a fib. 138.2% ratio whilst subdividing into a required three wave zig zag pattern. Then finally, wave (C) declines unfold into a five wave impulse pattern labelled in minor degree, i-ii-iii-iv-v. Note that minor wave iv. ended recently at 1.7652 as a zig zag with minor wave v. five in decline now. We haven’t entirely written-off the idea that minor wave iv. four is set to bounce higher now but range trade into a more complex pattern, i.e. triangle. However, what this wave count does prove is that the impulse decline as intermediate wave (C) remains incomplete. Downside targets are to min. 1.5446. This is derived from extending wave (A) by a fib. 100% ratio and the lowest of the two targets at 1.5330+/- is derived by extending minor waves i-iv one-four by a fib. 61.8% ratio.
GBP/AUD – Summary
Summing up, it seems that interpreting an expanding flat as primary wave 2 seems far-fetched because of the normal parameters that define the dimensions of the pattern. But when placed into the context of the longer-term pattern, we begin to see the true path of its ongoing development.
Ensure you’re tracking our forecasts – subscribe online for the EW-COMPASS REPORT.
Check out WaveTrack’s latest CURRENCY VIDEO @ CURRENCIES and INTEREST RATES VIDEO PART III and subsribe to our latest EW-COMPASS report!
EUR/USD – 61.8% RATIO ENDS 3rd WAVE IMPULSE
by WaveTrack International| July 20, 2017 | No Comments

EUR/USD – Change in Fortunes
It’s no secret. The EUR/USD has gone from the most shorted currency against the USD dollar at the beginning of this year when trading began at 1.0341 to the most net long as of last week’s close. Basis IMM data, the net short has swung completely around from minus -$9.0bn to plus +$12.0bn. Now, over the course of the last 6 ½ months whilst the Euro/USD has traded up to 1.1584.
But that’s not the entire story! The EUR/USD has been one of the most shorted currencies over the last few years. Sentiment has remained firmly bearish for the Euro during the Sovereign Debt Crisis of 2008-2012 when Icelandic banks collapsed. Later, focus transferred to illiquidity and funding in the ‘PIGS’, Portugal, Ireland, Greece and Spain. There were also occasions when Italy was thought to be on the brink of sovereign debt default so sentiment was overall low with many pundits, analysts and forecasters suggesting a collapse of the EUR/USD below parity and a break-up of the European Union.
Fast-forward to today and the picture is quite the opposite – where are these doom-and-gloom protagonists now?
The Elliott Wave Solution
From an Elliott Wave perspective, the Euro/USD was never in any danger of collapsing into oblivion – why? To answer that, first, you have to take a look at the very long-term pattern development from historical lows of the early 1920’s. This was a time of the Reichsmark, later becoming the Deutsche Mark and from 1999, the Euro as we know it today. But back then, this historical low triggered a centennial triple zig zag pattern that remains in progress to this very day. Over the last 8-years, the Euro/US$ has simply undergone a cycle wave B corrective decline within the third zig zag sequence that ended last January at 1.0341 – a new era of advances has since begun cycle wave C.
It’s still early days in cycle wave C’s advance though. With ultimate upside targets far above the 1.6040 levels traded at the previous peak of cycle wave A, this year’s advance is really just the beginning of the 1st wave within cycle wave C. And within this 1st wave, a self-similar five wave pattern is unfolding higher from 1.0341 revealing the markets fractal qualities. We’ve assigned this advance in intermediate degree, (1)-(2)-(3)-(4)-(5).
It just so happens that intermediate wave (3) is approaching a near-term top – see fig #1.
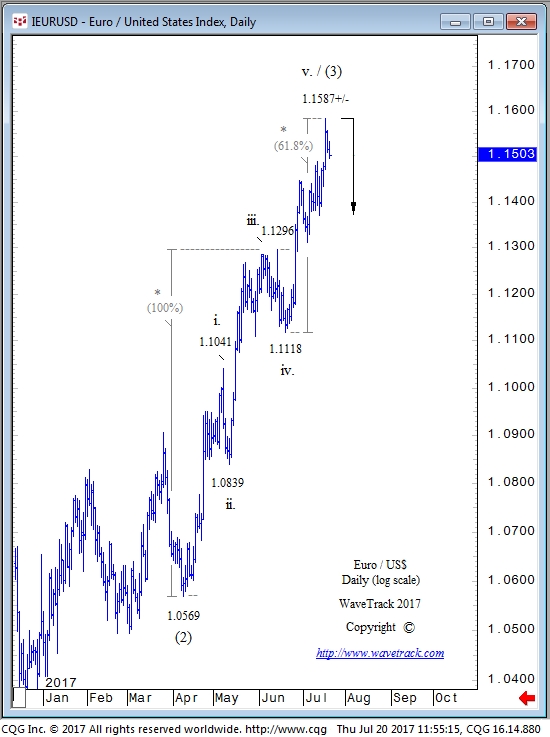
EUR vs. USD – Daily Forecast
EUR/USD and Fibonacci-Price-Ratios – Taking out the Guess Work
This is not just a guess – we can ‘proof’ this impulse advance is at a terminal phase using fib-price-ratios. Wave (3) subdivides into a five wave expanding-impulse pattern labelled in minor degree, i-ii-iii-iv-v –
• The net advance between minor waves i-iii x 61.8% = wave v. @ 1.1585 (log scale)
• Minor waves iii and v = 100% equality ratio @ 1.1587 (log scale)
So far, the high traded to 1.1584.
It also interesting that sentiment is very high right now, at a time when the IMM data is hitting a new multi-month high. This indicates the EUR/USD is about to trade lower in its first meaningful correction since last February, as intermediate wave (4) – watch this space!
This article is an extract from WaveTrack International’s latest Elliott Wave Compass report – for subscription enquiries, please see link below:
Ensure you’re tracking our forecasts – subscribe online for the EW-COMPASS REPORT.
Check out WaveTrack’s latest CURRENCY VIDEO @ CURRENCIES and INTEREST RATES VIDEO PART III and subsribe to our latest EW-COMPASS report!
« go back — keep looking »
Recent Posts
Recent Comments
Archives
- August 2026
- July 2026
- June 2026
- February 2026
- December 2025
- August 2025
- July 2025
- June 2025
- March 2025
- February 2025
- January 2025
- December 2024
- August 2024
- July 2024
- June 2024
- May 2024
- April 2024
- February 2024
- January 2024
- December 2023
- August 2023
- July 2023
- June 2023
- March 2023
- February 2023
- January 2023
- December 2022
- November 2022
- October 2022
- August 2022
- July 2022
- June 2022
- May 2022
- March 2022
- February 2022
- January 2022
- December 2021
- August 2021
- July 2021
- June 2021
- March 2021
- February 2021
- January 2021
- December 2020
- November 2020
- August 2020
- July 2020
- June 2020
- May 2020
- April 2020
- March 2020
- February 2020
- January 2020
- December 2019
- October 2019
- September 2019
- July 2019
- June 2019
- May 2019
- April 2019
- March 2019
- February 2019
- January 2019
- December 2018
- November 2018
- September 2018
- August 2018
- July 2018
- June 2018
- May 2018
- April 2018
- March 2018
- February 2018
- January 2018
- December 2017
- November 2017
- October 2017
- September 2017
- August 2017
- July 2017
- June 2017
- May 2017
- March 2017
- February 2017
- January 2017
- December 2016
- November 2016
- October 2016
- September 2016
- August 2016
- July 2016
- June 2016
- May 2016
- April 2016
- March 2016
- February 2016
- January 2016
- December 2015
- November 2015
- October 2015
- September 2015
- August 2015
- July 2015
- June 2015
- May 2015
- April 2015
- March 2015
- February 2015
- January 2015
- December 2014
- November 2014
- October 2014
- September 2014
- August 2014
- July 2014
- June 2014
- May 2014
- April 2014
- March 2014
- February 2014
- January 2014
- December 2013
- November 2013
- October 2013
- September 2013
- August 2013
- July 2013
- June 2013
- May 2013
- April 2013
- March 2013
- February 2013
- January 2013
- December 2012
- November 2012
- October 2012
- September 2012
- August 2012
Categories
- ADXY Index
- Agnico Eagle Mines
- AI Artificial Intelligence
- Alcoa
- Amazon
- AngloGold Ashanti
- Antofagasta
- APPL
- Apple
- ASX 200
- AUD vs USD
- AUD/YEN
- AUDNZD
- AUDUSD
- Australia ASX 200
- Baltic Dry Index
- Banking
- Base Metals
- Biotechnology
- Bitcoin
- Bovespa
- Broadcom
- Campanhia Siderugica
- Catalexit
- central banks
- CHF/Yen
- Christmas
- Commodities
- Commodities Video Outlook
- Commodities Video Outlook 2020
- Conference
- Copper
- Coronavirus Sell-Off
- CRB
- Crude oil
- crude oil price chart
- CryptoCurrency
- Currencies
- Currencies + Interest Rates Video Outlook
- Cycles
- Dax 30
- deutsche bank
- Dewey Cycle
- DJ Transportation Average
- DJ Utilities
- Dow Jones 30
- Dow Theory
- ECB
- economy
- Elliott Wave
- Elliott Wave Charts
- Elliott Wave Patterns
- Elliott Wave Principle
- Emerging Markets
- Ending-Diagonal Elliott Wave Pattern
- Equity
- EUR vs CHF
- EUR/CHF
- EUR/USD
- Euro / US$
- Eurostoxx 50
- EuroStoxx50
- EuroStoxxBanks
- EURUSD
- Expanding Flat Pattern
- FAAMG
- FANG+
- fib-price-ratio
- Fibonacci Trading
- Fibonacci-Price-Ratio
- Financial Forecasting
- Fixed Income
- forex
- Fortescu Metals
- Freeport McMoran
- FTSE 100
- Fund Management
- FX
- FXStreet
- GBP/AUD
- GBP/USD
- GDX
- GDXJ
- Gerdau Steel
- Germany 10 year Euro Bund future
- Gilead Sciences
- Glencore
- Global Economy
- Gold
- Gold Mining
- Golden Ratio
- goldman sachs
- Google Inc.
- Google/Alphabeth
- Greek debt crisis
- Hang Seng
- Harbinger
- Hungarian Forint
- IBEX 35 Index Spain
- Independent Research
- India-CNX Nifty 50
- Interest Rates
- Interview
- IRP Independent Research
- kbw bank index
- Lonmin
- MAG-7
- McDonald's
- MID-YEAR VIDEO UPDATE!
- Mifid II
- Mines
- Mining
- MSCI China
- MSCI Emerging Markets
- Nasdaq 100
- Nasdaq Biotechnology Index
- Nasdaq Composite
- Nasdaq100
- Netflix
- Newmont Mining
- Nikkei 225
- NVIDIA
- NYSE Composite Index
- Palladium
- Platinum
- Precious Metals
- Ralph Nelson Elliott
- Reversal-Signature
- Russell 2000
- Russia RTS
- S&P 500
- Sector
- Secular-Bull
- Sentiment Survey
- Shanghai Composite Index
- Silver
- Slanting Flat Elliott Wave Pattern
- SP100
- SP400 Mid-Cap
- SP500
- SPX 500
- STLG/AUD
- Stlg/US$
- STLG/USD
- STLG/YEN
- STLG/ZAR
- Stock Index
- Stock Index Tracking
- Stock Index Video
- Stock Indices
- Stock Indices Video Outlook 2023
- Stock Indices Video Outlook 2025
- Sugar
- Summary
- Tesla
- Tesla Inc
- Toyota
- Track Record
- trading
- Trusts
- Tutorial
- Uncategorized
- UniCredit
- US
- US Dollar Index (DXY) (USDX)
- US$ Index
- US-Dollar Index
- US10yrYields
- USD
- USD/ARS
- USD/CNY
- USD/IDR
- USD/INR
- USD/MXN
- USD/NOK
- USD/SEK
- USD/SGD
- USD/THB
- USD/YEN
- USD/ZAR
- Vale
- Value Line Index
- video
- VIDEO OUTLOOK 2018
- VIDEO OUTLOOK 2020
- VIX
- W.D. Gann
- WaveTrack International
- XAU Gold/Silver Index
- Xetra Dax
- XOP
- Yields
- Zig Zag
- Zinc
- ‘INFLATION-POP’
- ‘SHOCK-POP-DROP’