APPLE INC. – Hold or Sell? Learn more why Fib-Price-Ratios might be the key!
by WaveTrack International| May 22, 2017 | No Comments

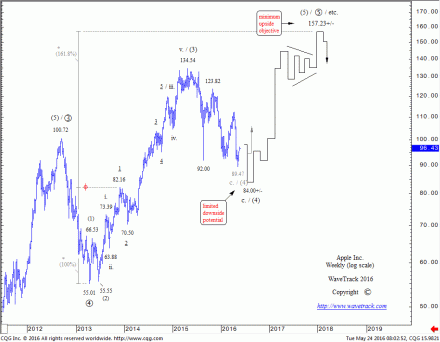
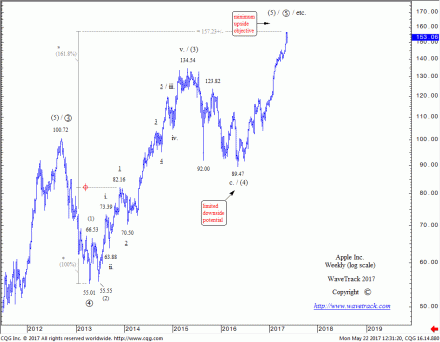
Apple Inc. (APPL) has outperformed over the last year. And only last week, the stock price for Apple reached a record high at 156.65. Apple’s share price is now moving ever so close to our last May’s upside target of 157.23+/-. In May 2016 the price was still trading at 96.43 representing a gain of +62.44% per cent.
But does the fact that prices have traded into fib-price-ratio upside targets mean the five wave expanding-impulse pattern that originated from the April ’13 low of 55.01 has already completed primary wave 5?
The answer is no.
If you take a closer look at intermediate wave (5)’s advance from the May ’16 low of 89.47, you’ll notice only a three wave subdivision within the advance to last week’s high. Yes, a smaller fourth wave retracement would necessitate a shorter-term decline continuing in the weeks ahead. This would indicate that the next price development will probably go down towards the fib. 23.6% retracement area at 142.24 or 38.2% to 132.75 but afterwards, a fifth wave advance to higher-highs! Aren’t Fibonacci price ratios amazing?
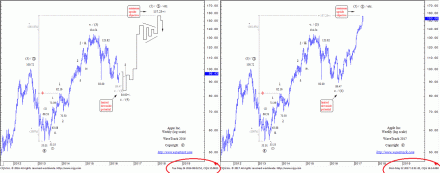
Apple Inc. – Forecast May 2016 and phenomenal Result in May 2017!
Compare the charts again – it is easy to recognise that the Elliott Wave forecast for Apple Inc. is yet another example reason why you should find out more about Fib-Price-Ratios! Ready?
Learn how to take advantage of WaveTrack’s Fibonacci-Price-Ratios!
Watch WaveTrack’s Fib-Price-Ratio videos on youtube to see how these measurements can be applied. These videos are gems of know-how for those who have eyes to see! WaveTrack’s first Elliott Wave Academy video
Keep tuned for more updates!
Ensure you’re tracking our forecasts – subscribe online for the EW-COMPASS REPORT.
Visit us @ www.wavetrack.com and subsribe to our latest EW-COMPASS report!
Tags: AAPL > Equity > Shares > stocks
Comments
Leave a Reply


