GDXJ-Junior Gold Miners – ZIG ZAG PERFECTION
by WaveTrack International| May 26, 2017 | No Comments
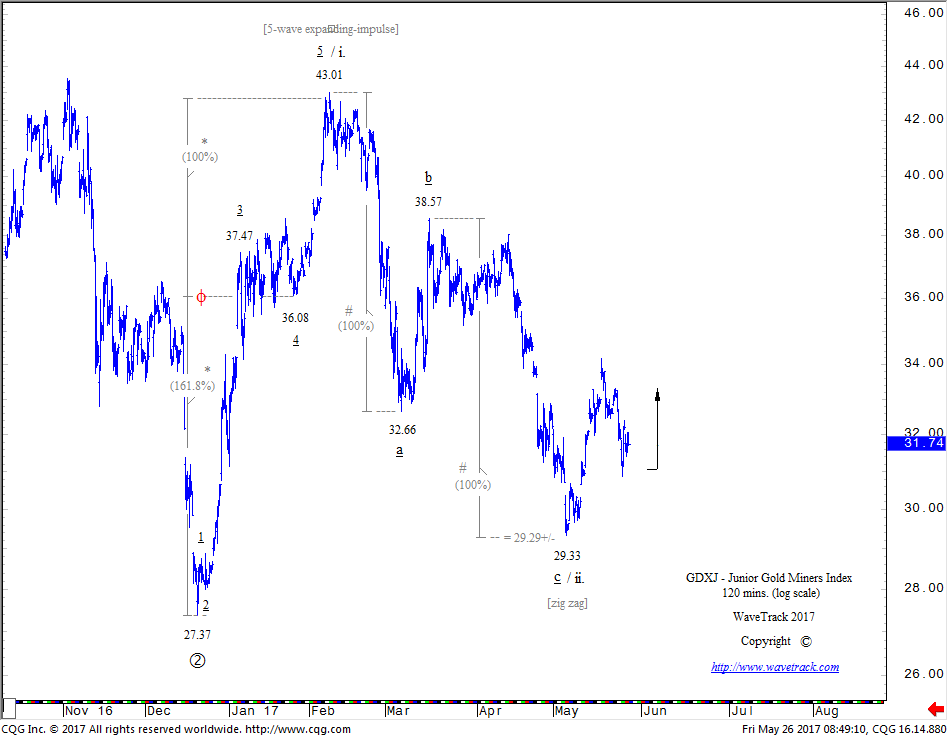
GDXJ Junior Gold Miners – 120 mins.
GDXJ-Junior Gold Miners ZIG ZAG PERFECTION! – GDXJ ENDS CORRECTION INTO $29.33 LOW
Towards the end of last February, the 27th to be exact, we posted an update of the GDXJ-Junior Gold Miners ETF showing how it had just ended a strong 5-wave impulse upswing at $43.01 from December’s low. This was providing confirmation of upside continuity in the future. In fact, this initial five wave impulse was simply the beginning of a much larger, multi-year uptrend – a 1st wave.
But before that can continue, in compliance with Universal Law, action must be followed by reaction. In the GDXJ’s case, a counter-trend decline must begin to unfold. R.N. Elliott’s guideline is that a correction commonly returns to the area of ‘fourth wave preceding degree’ which is around the $36.08 area – see chart. Whilst corrections can end into this minimum area, they can also extend beyond, or lower. This all depends on the depth of the preceding fourth wave in relation to the fifth and the labelling of the preceding impulse.
In this specific case, the GDXJ was beginning a correction as a 2nd wave. Yet, 2nd waves are notorious for unfolding far deeper than simply levels at fourth wave preceding degree. Anticipating such declines are really dependent on how the initial stage of the correction unfolds. If declining into a five wave pattern as it did to $32.66, then we already know that another deeper part of this correction is taking place, eventually taking the form of a 5-3-5 zig zag.
Why Fib-Price-Ratios are the key to forecast termination levels for Zig Zag Patterns
This is where fib-price-ratios are crucial in measuring the termination level of the zig zag. There are various ways to accomplish this but one of the most common ratios is well-known – where waves ‘a’ and ‘c’ measure to quality, or by a fib. 100% correlative ratio. As you can see from the chart, this was zig zag perfection because this ratio projected a terminal low to $29.29+/- with the actual low coming-in at $29.33!
The $29.33 low as this 2nd wave was also testing the fib. 85.4% retracement of its 1st wave predecessor [100-14.58 = 85.4]. When pattern meets fib-price-ratios and prices respond by trading higher afterwards, it confirms a ‘reversal-signature’ or a trend reversal. And so in terms of probability, this set-up is about as good as it gets – risk-reward is excellent basis negation below 29.33 – the prevailing, dominant uptrend is expected to resume higher now.
Learn how to take advantage of WaveTrack’s Fibonacci-Price-Ratios!
Watch WaveTrack’s Fib-Price-Ratio videos on youtube to see how these measurements can be applied. These videos are gems of know-how for those who have eyes to see! WaveTrack’s first Elliott Wave Academy video
Keep tuned for more updates!
Ensure you’re tracking our forecasts – subscribe online for the EW-COMPASS REPORT.
Visit us @ www.wavetrack.com and subsribe to our latest EW-COMPASS report!
Comments

Recent Posts
Recent Comments
Archives
- April 2024
- February 2024
- January 2024
- December 2023
- August 2023
- July 2023
- June 2023
- March 2023
- February 2023
- January 2023
- December 2022
- November 2022
- October 2022
- August 2022
- July 2022
- June 2022
- May 2022
- March 2022
- February 2022
- January 2022
- December 2021
- August 2021
- July 2021
- June 2021
- March 2021
- February 2021
- January 2021
- December 2020
- November 2020
- August 2020
- July 2020
- June 2020
- May 2020
- April 2020
- March 2020
- February 2020
- January 2020
- December 2019
- October 2019
- September 2019
- July 2019
- June 2019
- May 2019
- April 2019
- March 2019
- February 2019
- January 2019
- December 2018
- November 2018
- September 2018
- August 2018
- July 2018
- June 2018
- May 2018
- April 2018
- March 2018
- February 2018
- January 2018
- December 2017
- November 2017
- October 2017
- September 2017
- August 2017
- July 2017
- June 2017
- May 2017
- March 2017
- February 2017
- January 2017
- December 2016
- November 2016
- October 2016
- September 2016
- August 2016
- July 2016
- June 2016
- May 2016
- April 2016
- March 2016
- February 2016
- January 2016
- December 2015
- November 2015
- October 2015
- September 2015
- August 2015
- July 2015
- June 2015
- May 2015
- April 2015
- March 2015
- February 2015
- January 2015
- December 2014
- November 2014
- October 2014
- September 2014
- August 2014
- July 2014
- June 2014
- May 2014
- April 2014
- March 2014
- February 2014
- January 2014
- December 2013
- November 2013
- October 2013
- September 2013
- August 2013
- July 2013
- June 2013
- May 2013
- April 2013
- March 2013
- February 2013
- January 2013
- December 2012
- November 2012
- October 2012
- September 2012
- August 2012
Categories
- ADXY Index
- Agnico Eagle Mines
- Alcoa
- Amazon
- AngloGold Ashanti
- APPL
- Apple
- ASX 200
- AUD vs USD
- AUDNZD
- AUDUSD
- Australia ASX 200
- Baltic Dry Index
- Banking
- Base Metals
- Biotechnology
- Bitcoin
- Bovespa
- Catalexit
- central banks
- Christmas
- Commodities
- Commodities Video Outlook 2020
- Conference
- Copper
- Coronavirus Sell-Off
- CRB
- Crude oil
- crude oil price chart
- CryptoCurrency
- Currencies
- Cycles
- Dax 30
- deutsche bank
- Dewey Cycle
- DJ Transportation Average
- DJ Utilities
- Dow Jones 30
- Dow Theory
- ECB
- economy
- Elliott Wave
- Elliott Wave Charts
- Elliott Wave Patterns
- Elliott Wave Principle
- Emerging Markets
- Ending-Diagonal Elliott Wave Pattern
- Equity
- EUR vs CHF
- EUR/USD
- Euro / US$
- Eurostoxx 50
- EuroStoxx50
- EuroStoxxBanks
- EURUSD
- Expanding Flat Pattern
- FAAMG
- FANG+
- fib-price-ratio
- Fibonacci Trading
- Fibonacci-Price-Ratio
- Financial Forecasting
- Fixed Income
- forex
- FTSE 100
- Fund Management
- FX
- FXStreet
- GBP/AUD
- GBP/USD
- GDX
- GDXJ
- Germany 10 year Euro Bund future
- Gilead Sciences
- Global Economy
- Gold
- Gold Mining
- Golden Ratio
- goldman sachs
- Google Inc.
- Greek debt crisis
- Hang Seng
- Harbinger
- Hungarian Forint
- IBEX 35 Index Spain
- Independent Research
- India-CNX Nifty 50
- Interest Rates
- Interview
- IRP Independent Research
- kbw bank index
- Lonmin
- McDonald's
- MID-YEAR VIDEO UPDATE!
- Mifid II
- Mines
- Mining
- MSCI China
- MSCI Emerging Markets
- Nasdaq 100
- Nasdaq Biotechnology Index
- Nasdaq Composite
- Nasdaq100
- Nikkei 225
- NYSE Composite Index
- Palladium
- Platinum
- Precious Metals
- Ralph Nelson Elliott
- Reversal-Signature
- Russell 2000
- Russia RTS
- S&P 500
- Sector
- Secular-Bull
- Sentiment Survey
- Shanghai Composite Index
- Silver
- Slanting Flat Elliott Wave Pattern
- SP100
- SP400 Mid-Cap
- SP500
- SPX 500
- STLG/AUD
- Stlg/US$
- STLG/USD
- STLG/YEN
- STLG/ZAR
- Stock Index
- Stock Index Tracking
- Stock Index Video
- Stock Indices
- Stock Indices Video Outlook 2023
- Sugar
- Summary
- Tesla Inc
- Toyota
- Track Record
- trading
- Trusts
- Tutorial
- Uncategorized
- UniCredit
- US
- US Dollar Index (DXY) (USDX)
- US$ Index
- US-Dollar Index
- US10yrYields
- USD
- USD/ARS
- USD/CNY
- USD/IDR
- USD/INR
- USD/MXN
- USD/SGD
- USD/THB
- USD/YEN
- USD/ZAR
- Value Line Index
- video
- VIDEO OUTLOOK 2018
- VIDEO OUTLOOK 2020
- VIX
- W.D. Gann
- WaveTrack International
- XAU Gold/Silver Index
- Xetra Dax
- XOP
- Yields
- Zig Zag
- Zinc
- ‘INFLATION-POP’
- ‘SHOCK-POP-DROP’
