Currencies (FX) & Interest Rates Video Series | PART III/III | USD 7.8 year Cycle
by WaveTrack International| June 27, 2017 | No Comments

Currencies and Interest Rates Video – Mid-Year 2017 Update!
US$ Dollar in early stages of new 7.8-year cycle |
EURO to rebuff doomsday forecasters |
Commodity Currencies to strenghten
USD Safe-Haven Status
Amongst the world currencies the US$ dollar is quite rightly perceived as a ‘safe-haven’ currency. During times of uncertainty or financial stress, the US$ dollar index strengthens against its G10 trading partners. This was certainly the case during the last two major financial crises. Firstly, when the S&P declined -50% per cent during years 2000-2002 and the secondly, by -57% per cent during 2007-2009. In the first case, the US$ dollar only managed a gain of +8% per cent but +27% per cent during the Lehman-crisis. So there seems no relative ‘amplitude’ guidance for these two events. There are obviously other dynamics that affect its performance.
When the S&P began its new uptrend from the March ’09 low, the US$ dollar began to weaken again as the safe-haven protection was unwound. The dollar nose-dived -18.8% per cent forming a secondary low in May ’11. A huge move – that seems logical enough! But the risk-on/risk-off strategy disengaged afterwards with the dollar gaining a massive +42.8% into this year’s January ’17 peak whilst during the same period, the S&P gained 82.4% per cent. Positive correlation?
The accepted explanation is that widening interest rate differentials and a more robust U.S. economic recovery has led to this strengthening period of the US$ dollar – it has nothing to do with its ‘safe-haven’ status.
From these two exogenous events, we gain a glimpse on how the dollar performs, but is there a way to predict its next major direction? What is its current dominant driver? Is it going to strengthen basis another stock market crash? – strengthen because the U.S. economy is expanding? – or strengthen on further Federal Reserve interest rate hikes? Either way, there’s not much of a case to think entirely in the opposite direction, for a weakening US$ dollar – or is there?
Forecasting Major Inflexion Points
Trading success often means training oneself to think outside the box – knowing when to detach from the herd and run against it – to become the independent free thinker, trader. If you’re familiar with the Elliott Wave Principle (EWP) and Cycle Theory (CT), you already know what I’m talking about. It’s a plain fact that when major inflexion or turning points occur in the markets, the ‘herd’ is stampeding into a canyon with not exit other than that where it came from – it must reverse course. But it’s not obvious to identify these moments – it takes practice and a strong ‘emotive’ but objective conviction that an opportunity is waiting.
How else did Warren Buffet manage to buy cheap Goldman Sachs stock at the bottom of the financial-crisis? He didn’t speculate – he KNEW that an opportunity beckoned because all the characteristic traits were evident in the way investors were reacting – he knew there was emotional panic – he knew values were fifty per cent cheaper than a year earlier – he knew there was a demand for cash. But not all major inflexion or turning points are so obvious – some begin quietly, almost unnoticed which means we have to use tools to identify these, more subtle changes of direction and we can’t think of anything better to use than the EWP + Cycle Analysis.
Elliott Wave – US$ Dollar Index & its 7.8-Year Cycle
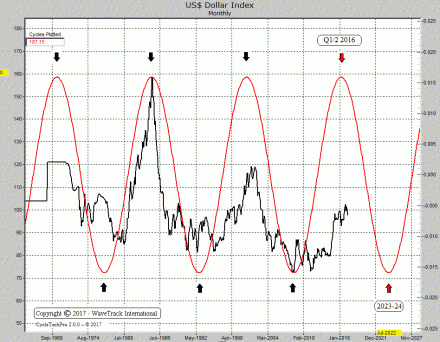
It’s hard to dispute the US$ dollar index is unfolding to the rhythm of a 15.6-year cycle which connects peak-to-peak, trough-to-trough – see fig #1. If you showed this repeating cycle to several hundred asset managers, what percentage do you think would liquidate their exposure to the US$ dollar? – especially when you consider the current bullish drivers in place!

USD Index – Monthly – Currencies Composite Cycle – (C) WaveTrack International
The recent in-depth survey conducted by Bank of America/Merrill Lynch which included 213 respondents with $645bn assets under management highlighted some interesting facts. When asking asset managers what is the ‘most crowded trade’, the answer was the Nasdaq for the first time in five months – it overtook the US$ dollar which has headed the list on an average basis for the last several years. It reached a mid-30’s per cent peak earlier in the year on a scale where +50 to -70 has contained the US$ dollar index price for the last 13-year period. That’s historically overbought by any measure and yet the market savvy asset managers sensed this. But what they don’t know is that a far greater directional change is at hand.
Multidisciplinarity – Elliott Wave and Cycle Theory
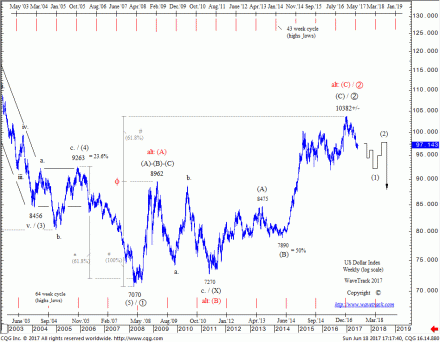
The alternating 15.6-year cycle is composed of a near-centrally translated 7.8-year interval from peak-to-trough-to-peak etc. That means the last cycle-trough traded in March ’08 was due to peak next in Q1/Q2 2016. It was a little late which is due to the fact that the centrally translated rhythm is not exact but its close enough if backed up by Elliott Wave analysis. The March ’08 advance is labelled as a corrective upswing, a zig zag or double zig zag pattern. Using WaveTrack’s proprietary fib-price-ratio model for this pattern, extending the first zig zag into the March ’09 peak at 89.62 by a fib. 61.8% ratio projects a terminal high for the secondary zig zag to 103.77+/-. January ‘17’s high at 103.82+/- traded within 5 pips of this number, then responded lower afterwards. It has been declining since. See fig #2.

USD Index – Weekly
These two disciplines, Elliott Wave and Cycle Theory are confirming the US$ dollar ended its 7.8-year advance which encompassed the financial-crisis and U.S. economic expansion. But this is changing now. We (unfortunately) don’t have a crystal ball to determine why the US$ dollar should begin a new 7.8-year cycle decline – we can, of course, hypothesise, just as you can too, but from my experience, the outcome can often be totally different. So many times in the past have we saw a different fundamental/economic reason unfold than we thought and yet still validating the Elliott Wave analysis. One thing for sure though, there’s plenty of room for fund managers to catch up on the larger downtrend later, even if their current outlook is somewhat restricted.
The Next 6-Months – New CURRENCIES & INTEREST RATE Mid-Year Video
In the meantime, the US$ dollar’s medium-term trend along with many other major crosses and pairs are updated in our latest MID-YEAR CURRENCIES and INTEREST RATE video. This is the 3rd and final video in this TRILOGY series which includes Stock Indices/Equities and Commodities. This PART III video commentary examines the major US$ dollar crosses including cycles for the EURO/US$, Elliott Wave analysis for STLG/BRITISH POUND against the DOLLAR, the EURO and the YEN, how the commodity currencies are set to continue like the AUSSIE DOLLAR and its performance against the KIWI – the CANADIAN DOLLAR and several ASIAN FX pairs that make up the ASIAN DOLLAR INDEX. The video also updates the MEXICAN PESO, BRAZILIAN REAL, SOUTH AFRICAN RAND, RUSSIAN ROUBLE, POLISH ZLOTY and CHINA’S RENMINBI/YUAN.
This is probably the most comprehensive, most accurate ELLIOTT WAVE FX analysis ever conceived – there are 56 charts and tables + a downloadable .pdf. Even if you’re trading short-term CURRENCY set-ups, this video is an ‘absolute-must’ in giving perspective to your existing strategies. Don’t delay, order you video and accompanying .pdf charts NOW! Just follow the links below and we’ll see you soon!
Most sincerely,
Peter Goodburn
Founder and Head Elliott Wave Analyst
WaveTrack International
CURRENCIES and INTEREST RATES Table of Contents: 56 charts
• US$ Index and Cycles
• Euro/US$ and Cycles
• Stlg/US$
• US$/Yen
• US$/CHF
• AUD/US$
• NZD/US$
• US$/CAD
• Euro/Stlg
• STLG/Yen
• Euro/Yen
• Asian ADXY
• US$/IDR
• US$/ZAR
• US$/BRL
• US$/RUB
• US$/CNY
• USD/MXN
• ZAR/US$
• GBP/ZAR
• US$/BRL
• US$/RUB
• US$/PLZ
• US 30yr Yield
• US 10yr Yield
• US 10yr TIPS Break Even Inflation Rate
• DE 10yr Yield
• JPY 10yr Yield
How can you order the new CURRENCIES and INTEREST RATES video forecast?
PART III CURRENCIES and INTEREST RATES VIDEO is available now, at only $48.00! (1 hour 50 mins long)
We’ll send you a personal link so that you can watch the video, anytime at your convenience.
And if you’d like to subscribe to the CURRENCIES and INTEREST RATES VIDEO offer, you can receive ALL THREE for $96.00! – that’s a saving of 33% per cent!
• Single Video – $48.00
• Triple Package offer – $96.00 (saving 33%)!
CONTACT US NOW VIA EMAIL – SELECT YOUR PACKAGE
Single Video – $48.00 – PART III CURRENCIES and FIXED INCOME (June ’17)
Triple Package offer – $96.00 (saving 33%)! – PART I – PART II – PART III (June ’17)
PART I – the latest STOCK INDICES video runs for 1 h 50 minutes featuring 46 charts – click here
PART II – the latest COMMODITIES video runs for 1 h 30 minutes featuring 52 charts – click here
To receive your VIDEO UPDATE please click here to contact us.
– Please state if you wish to purchase the SINGLE VIDEO for CURRENCIES and INTEREST RATES for USD 48.00?
– Or opt for the TRIPLE PACKAGE for USD 96.00 in total?
– Next we will send you a PayPal payment request and provide you with the video link & PDF report once confirmed.
Havn’t got a a PayPal account? We accept all major credit cards – just tell us your preferred payment method in your email and we’ll send you instructions.
Visit us @ www.wavetrack.com
Comments
Leave a Reply
