US-Dollar Index and the Power of Fibonacci Ratio’s
by WaveTrack International| August 3, 2017 | 2 Comments
US-Dollar Index
The latest decline in the US-Dollar Index (DXY) has pulled levels down to next target levels at 92.55+/-. Hence, this target level ends its larger minor degree 3rd wave sequence within this year’s impulse downtrend. Momentum shows an oversold condition as last week’s IMM data highlights money managers piling out of dollar holdings. The net short positioning is at -$9.7bn, which constitutes the biggest bear bet since 2012 when the index was trading at 79.27. Surely, a counter-trend 4th wave rally seems inevitable but from what exact level – beginning from where? This is important to assess because as we all know, getting into a trade, even slightly before it turns, can often test one’s resilience.
Without the use of geometric analysis, Elliott Wave can often be somewhat ‘subjective’ in its assessment of locating a pattern development. But adding this to your repertoire, you quickly discover a way that overturns subjectivity, turning the methodology into a more quantitative, objective process.
What is geometric analysis? It’s a branch of mathematics concerned with questions of shape, size, relative position of figures (patterns) and the properties of space. I’d also like to also add the word ‘dimension’ because in Elliott Wave analysis, dimension is one of the key attributes in identifying any one of R.N. Elliott’s 13 patterns.
The tools to work with are two-fold. First, the Fibonacci ratio sequence and second, using our natural ‘eye’ to identify the dimension of each EW pattern. For the latter, we have to train our ‘eye’ to these patterns. So think pattern, not waves! Waves are the components of the pattern – they are very important, but its more important to train ourselves in pattern identification.
Fibonacci-Price-Ratios
Each of R.N. Elliott’s 13 patterns unfold to common fib-price-ratio measurements which define their dimensions, or shape. There are slight variations but these are confined into maximum limits. In this study of the US-Dollar Index, we examine a segment/component within its recent decline and attempt to determine its terminal low.
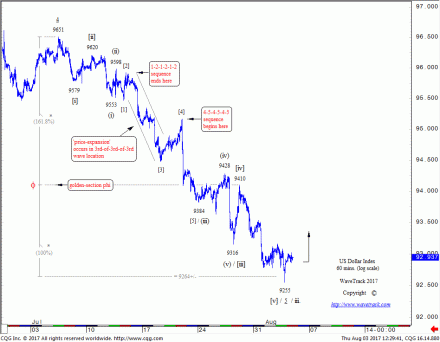
The DXY began declining into a five wave expanding-impulse pattern from January’s high of 103.82. We already know from using fib-price-ratio analysis that a larger 3rd wave impulse pattern is approaching downside completion from 102.26. Measuring the minute degree subdivision of this 3rd wave, 1-2-3-4-5, a 5th wave low projects to 92.50+/- where minute wave 5 unfolds by a fib. 61.8% correlative ratio of waves 1-3. Can the 92.50+/- level be verified within the substructure of minute wave 5’s final phase of the decline?
Minute wave 5 can be seen subdividing into minuette degree, [i]-[ii]-[iii]-[iv]-[v] – see fig #1. It begins subdividing into a fractal series of 1-2’s, three in total before ‘price-expansion’ unfolds defined as the 3rd-of-3rd-of-3rd wave sequence, between 95.92 and 94.48 as micro-wave [3]. What follows is a compensatory amount of 4-5’s, three in all to the current low at 92.55. But can Fib-Price-Ratios help identify this low?

US-Dollar Index – 60 mins. – FIB-PRICE-RATIO Tutorial – 5th Wave Projection – How to Measure Termination!
Best Fibonacci-Price-Ratio Techniques
One of the most common fib-price-ratio techniques that can be used in identifying the terminal low of a five wave impulse pattern like this is to extend waves [i]-[iv] by a fib. 61.8% ratio. In this example, it projects wave [v] to a low at 92.64+/-. That’s in close proximity to the 92.50+/- measurement derived from minor degree measurements. When two or three fib-price-ratios meet or converge like this, it heightens the probability of a reversal-signature.
Yesterday’s action (August 2nd) saw the DXY trade momentarily below these target levels. However, it quickly staged ‘rejection’, isolating the low as a single 60 minute bar. This is a great ‘reversal-signature’ because the DXY responded so well to the number. Even better if it undergoes an overshoot but speedily responds higher without looking back.
The confidence fib-price-ratios bring to the table are profound when it comes to our decision-making process. To witness and learn this process has huge benefits for each and everyone’s foray into the journey of trading.
Learn how to take advantage of WaveTrack’s Fibonacci-Price-Ratios!
Watch WaveTrack’s Fib-Price-Ratio videos on youtube to see how these measurements can be applied. WaveTrack’s first Elliott Wave Academy video
Keep tuned for more updates!
Ensure you’re tracking our forecasts – subscribe online for the EW-COMPASS REPORT.
Visit us @ www.wavetrack.com and subsribe to our latest EW-COMPASS report!
Check out WaveTrack’s latest CURRENCY VIDEO @ CURRENCIES and INTEREST RATES VIDEO PART III and subsribe to our latest EW-COMPASS report!
Comments
2 Responses to “US-Dollar Index and the Power of Fibonacci Ratio’s”
Leave a Reply

August 3rd, 2017 @ 1:49 pm
Good stuff. Thanks as always.
August 3rd, 2017 @ 4:37 pm
Thank you for your comment. We are pleased to hear that you find the information useful. Best wishes, WaveTrack