XETRA DAX SETS THE TREND!
by WaveTrack International| August 21, 2017 | No Comments
Sentiment is Bearish
U.S. stock markets were reeling last week as the Trump administration was engaged in reputational ‘damage-limitation’ over the President’s Charlottesville comments that drew a moral equivalence between neo-Nazis and anti-fascists. The fallout that followed resulted in the resignation of Trump’s ‘America First’ architect Steve Bannon as White House chief strategist. Losing an ally is one thing but when major industry chiefs began to resign from Trump’s advisory councils, the markets listen, then react as they did last week with sharp declines in the benchmark S&P 500 index.
This latest sell-off comes at a time of heightened anxiety over recent warnings from industry luminaries over the high readings from the CAPE (Cyclically-Adjusted Price/Earnings) and S&P/Sales ratios. Yes, they are historically high but are not at all-time highs and even if they were, as the time-old adage states, never be afraid of buying high if the market is still trending higher!
Whilst sentiment is clearly bearish right now, there are signs that this will change later this week. The S&P, Dow Jones and Nasdaq 100 are engaged in corrective declines which are somewhat complex in their Elliott Wave pattern criteria, which opens the way for slightly variant permutational possibilities. But Europe’s Xetra Dax has no such ambiguities.
Xetra Dax Sets the Trend
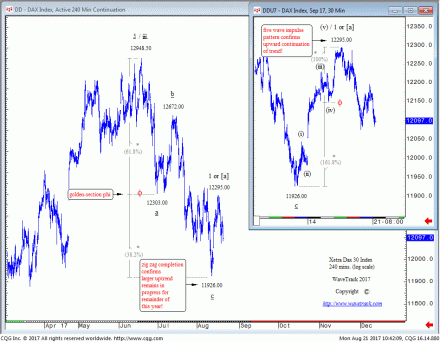
The Dax began declining from its June ’17 high of 12948.50 (futures) as a 4th wave correction within the dominant, larger uptrend that started from the Feb.’16 low. It has since completed a picture-perfect three wave zig zag pattern into last week’s low at 11926.00 – see fig #1.
Labelled in minute degree, a-b-c, this pattern subdivides into a required 5-3-5 sequence whilst adhering to dimensionally perfect Fib-Price-Ratio (FPR) measurements. For example:
Wave a x 61.8% ratio minus 12303.00 = Wave c low at 11926.00
In other words, extending wave a by a fib. 61.8% ratio at its low of 12303.00 projects a terminal low for wave c at the exact low of 11926.00. This use of the ‘golden-ratio’ and phi is paramount in verifying corrective patterns like this.
The following advance from the low of 11926.00 has unfolded into a five wave expanding-impulse pattern to 12295.00 (see inset). This ‘proofs’ the preceding zig zag ended at 11926.00 whilst confirming a new uptrend. It’s only a matter of a day or so before the index turns back higher.
The Xetra Dax, therefore, sets the trend for other major indices to begin a synchronised recovery during the coming week. So fear not – shake off the bearish sentiment – start to look forward to some impressive gains!
Learn how to take advantage of WaveTrack’s Fibonacci-Price-Ratios!
Watch WaveTrack’s Fib-Price-Ratio videos on youtube to see how these measurements are applied. WaveTrack’s first Elliott Wave Academy video
Ensure you’re tracking our forecasts – subscribe online for the EW-COMPASS REPORT.
Visit us @ www.wavetrack.com and subsribe to our latest EW-COMPASS report!
Check out WaveTrack’s latest CURRENCY VIDEO @ CURRENCIES and INTEREST RATES VIDEO PART III and subsribe to our latest EW-COMPASS report!
Comments
Leave a Reply

