How to determine the next move for the SP500?
by WaveTrack International| November 21, 2017 | No Comments
SP500 and Elliott Wave!
The SP500 has been making hard work of maintaining its uptrend since the last significant correction occurred into last August’s low of 2415.75 (futures). Since then, a five wave impulse pattern has pushed markets up by +7.3% per cent, impressive, but the momentum is now waning.
The impulse pattern began by unfolding into a series of 1-2’s, a step-like sequence of advances and declines of similar amplitude which are simply the fractal subdivisions of the up-coming 3rd wave. After three 1-2 sequences, ‘price-expansion’ occurred from the late-September low of 2485.00 which acts as the 3rd-of-3rd-of-3rd wave sequence within the pattern.
The reason why the S&P is now making hard work of maintaining the same velocity is because, since early-October, it is engaged in a corresponding series of 4-5’s which are approaching upside completion that ends the entire impulse from August’s low.
The Double Diagonal!
If we zoom-in to the final stage of the 4-5-4-5 sequences, we can see something a little unusual – see fig #1. The last two impulse advances as 5th waves can be seen taking the form of an ending/contracting diagonal pattern. The first of the diagonals acts as the fifth wave within the larger 3rd within August’s impulse advance. Note that extending wave 1 to 2580.75 projects the peak of wave 5 in close proximity to the final high of 2594.50.
This was followed by a three wave correction to 2555.50, ending the larger 4th wave within August’s impulse advance.
SP500 Forecast – 60 mins. chart by WaveTrack International
The following advance has also the initial hallmarks of unfolding into a diagonal too. The push higher from 2555.50 to 2589.50 has definitively unfolded into a three wave sequence, not a five. Had it been a five, this would have resulted in the advance proceeding as an ‘expanding-impulse’, but as a three wave sequence, this fits the profile of an ending/diagonal, because the impulse sequences, i.e. 1-3-5 are expected to subdivide into zig zags (or multiples, doubles/triples).
The 2589.50 high is labelled as ending the first wave, wave < 1 > within the ending/diagonal, wave < 2 > has since pulled lower to 2567.75. But wave < 3 > is now engaged to the upside – this must also subdivide into a zig zag (as illustrated) or perhaps a double/triple sequence.
The Fibonacci Advantage
Wave < 3 > is commonly slightly larger than wave < 1 >, so we’ve used a subliminal fib. 109.01% ratio that measures its high towards 2605.00+/-. Wave < 4 > then pulls back towards the fib. 50% retracement area at 2586.50+/- which is enough to cause the necessary ‘overlap’ of wave < 1 >. And finally, wave < 5 > to upside targets towards 2609.25+/- where this unfolds by a fib. 61.8% ratio of wave < 3 >.
Observing back-to-back diagonals is something interesting to watch – this doesn’t happen often, and predicting a second is somewhat speculative but definitely worth exploring.
Are you trading the SP500? Don’t miss WaveTrack regular updates in our bi-weekly EW-Compass Report! Ensure you’re tracking our forecasts – subscribe online for the EW-COMPASS REPORT.
Visit us @ www.wavetrack.com and subsribe to our latest EW-COMPASS report!
XETRA DAX STAGES 5 WAVE DECLINE
by WaveTrack International| November 14, 2017 | No Comments
Xetra Dax – Sentiment Turns Bearish
Xetra Dax‘s late-August five wave impulse advance from 11863.00 came to an end exactly this time last week at 13533.00. Concluding the larger 1st wave within minor wave v. five.
A 2nd wave correction has since begun, confirmed by an initial five wave impulse decline unfolding from last week’s high, ending yesterday at 12957.50. Note how the five wave structure is corroborated by Fib-Price-Ratios – i.e.
waves (i)-(iii) x 61.8% = (v) at 12957.50
The low at 12957.50 completes wave [a] of a developing zig zag pattern, perhaps even a larger double zig zag as this 2nd wave correction. For the moment, wave [b] rallies are still engaged to the upside – forecasts measure completion towards either 13204.00+/- or 13247.00+/- where the run higher to 13136.00 labelled wave (a) is extended by either a fib. 328.2% or fib. 61.8% ratio.
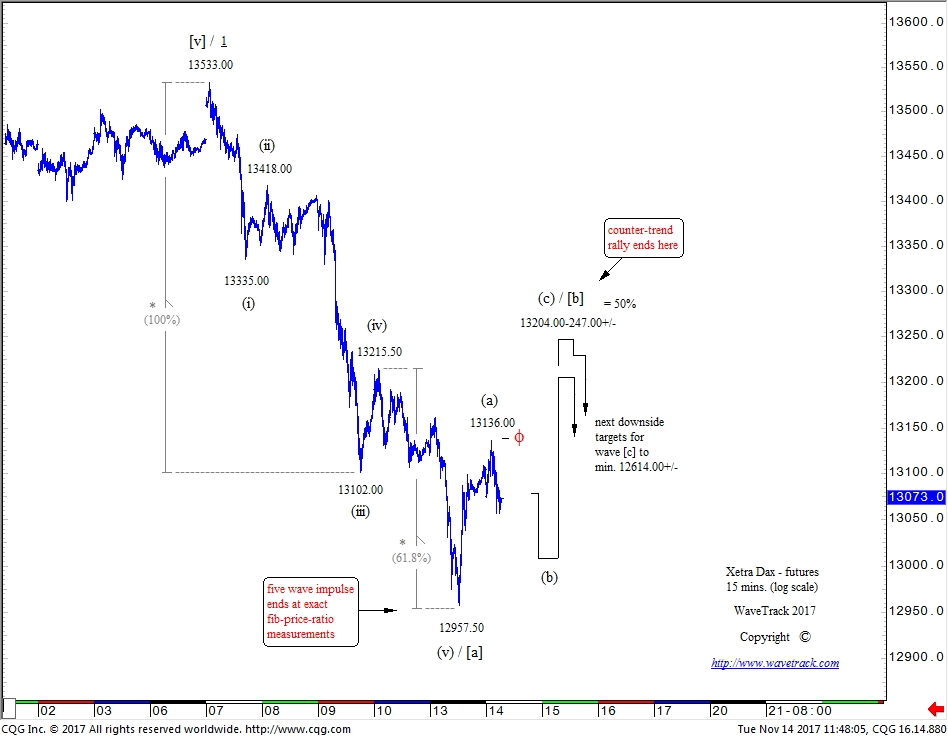
Xetra Dax 15 mins. – WaveTrack International
Once completed, wave [c] declines can begin targeting 12614.00+/-.
This overall downturn has obviously changed the short-term sentiment from bullish to bearish! And with the Xetra Dax as our near-term guide, can expect a similar downturn to begin for U.S. indices too.
Learn how to take advantage of WaveTrack’s Fibonacci-Price-Ratios!
Watch WaveTrack’s Fib-Price-Ratio videos on youtube to see how these measurements are applied. WaveTrack’s first Elliott Wave Academy video
Interested in the Xetra Dax – Get regular updates in our bi-weekly EW-Compass Report! Ensure you’re tracking our forecasts – subscribe online for the EW-COMPASS REPORT.
Visit us @ www.wavetrack.com and subsribe to our latest EW-COMPASS report!
SP500 AT 2600.00 – PSYCHOLOGICAL? NO – MATHEMATICAL!!
by WaveTrack International| November 9, 2017 | No Comments
For the last several weeks, sentiment readings for the stock market have been so high that it’s prompted analysts and a good few treasure hunters to signal a major decline is about to begin. But the SP500 has been steadily breaking to new record highs over the last month as sentiment readings go from one extreme to another.
A couple of examples – AAII Investor Sentiment Survey shows bulls at 45.1% where the historical average is 38.5%! Now, bears are at 23.1% but this has declined sharply over the last week by a massive -5.5%. This is indicating the bears have become more neutral/bullish as the stock market continues higher. The latest from Investors Intelligence shows bulls on the NYSE at 64.9% which is slightly off from 65.28%. Yet, historically markets tend to form important peaks when this measure reaches over 60.0% per cent.
The SP500 has been approaching an important psychological level towards 2600.00. The markets love ‘round-numbers’, but is this the real reason for its approach. No, not psychological, more mathematical.
How to apply Mathematics & Fibonacci-Price-Ratios to uncover the next move for the SP500?
An Elliott Wave impulse pattern is approaching it upside termination between 2579.00+/- and 2606.58+/-. This five wave pattern began from the June ’16 Brexit low. The two upside targets are derived from the mathematical application of Fibonacci-Price-Ratios. For example, the 2579.00+/- level is derived from a combination of fib-price-ratios where the golden-section 61.8% cut of the entire impulse from the Feb.’16 low is at 2338.00+/-, then working back a fib. 38.2% adjustment. The 2606.58+/- area is derived where its fifth wave, minuette wave [v] unfolds by a fib. 61.8% ratio of waves [i]-[iii].
When subdividing wave [v] into five smaller waves from the March ’17 low, we see its 5th wave advance begin from August’s low of 2415.75 and within this advance, its concluding 5th wave can be seen unfolding into an ending/contracting-diagonal pattern – see fig #1. The diagonal can be seen unfolding into a typical wedge-shaped pattern, but still composed of five internal waves, <1> – <2> – <3> – <4> – <5>. Note that each impulse wave subdivides into a three wave sequence. For example a zig zag which is a prerequisite for the ‘ending’ type diagonal as opposed to the ‘leading’ type variation. Extending wave <1> by a fib. 38.2% ratio projects the terminal high for wave <5> to 2596.00+/-. The overnight high at 2594.50 approached this important number, then staged ‘price-rejection’. The following decline is enough to validate the diagonal’s completion.
SP500 (Futures) – 60 mins. Elliott Wave Chart by WaveTrack International
The diagonal’s completion also ends a total of six degrees of trend, ending the entire impulse pattern that began from the June ’16 Brexit low. This is a larger 3rd wave in the dynamics of the impulse in upside progress from the Feb.’16 low, but it does open the way to a larger 4th wave correction now, which is about -7% or -9% per cent below current levels.
Learn how to take advantage of WaveTrack’s Fibonacci-Price-Ratios!
Watch WaveTrack’s Fib-Price-Ratio videos on youtube to see how these measurements are applied. WaveTrack’s first Elliott Wave Academy video
Ensure you’re tracking our forecasts – subscribe online for the EW-COMPASS REPORT.
Visit us @ www.wavetrack.com and subsribe to our latest EW-COMPASS report!
SP500 – Little Elliott Wave Compass Track Record
by WaveTrack International| October 24, 2017 | No Comments
How is it possible to forecast the SP500 so precisely?
SP500 Forecast – 19th October 2017 – 540 mins. by WaveTrack International
This SP500 forecast (540 min) has been posted on Twitter (see post 19th October 2017). The chart shows impressively how Fibonacci-price ratios when applied correctly can pinpoint nearly the exact price levels. A method which WaveTrack’s founder Peter Goodburn has proven beyond doubt. R.N. Elliott started to recognise the importance of the Golden Ratio expressed as Fibonacci-price ratios but he died prematurely before he could investigate and develop his knowledge. R.N. Elliott himself therefore never provided clear guidelines how to apply the Golden Ratio.
Fibonacci-Price-Ratio Studies
As a result, Peter Goodburn studied the application of Fibonacci-price-ratios for years and compiled a historical database of examples to check the mathematical probability of these ratios.
SP500 Track Record – Forecast April 2017 and Result Now!
SP500 Forecast – 26th April 2017 – Daily – Track Record by WaveTrack International
If you have been an EW-Compass client you were able to not just observe the SP500 hitting these exact price targets but taking a good profit too.
Are Fibonacci-Price-Ratio’s working always that precisely? No, there is a clear skill to apply and an absolute vigilance of each Elliott Wave trader to watch if price-ratios are being reached. There is no trade on earth which does not need skill and concentration. However, it is still the most exact forecasting method WaveTrack found in over 30 years of trading experience.
If you are now interested in Fibonacci-Price-Ratios then don’t miss WaveTrack’s free Fib-Price-Ratio tutorials on youtube (see below) – there is more to come.
Learn how to take advantage of WaveTrack’s Fibonacci-Price-Ratios!
Watch WaveTrack’s Fib-Price-Ratio videos on youtube to see how these measurements are applied. WaveTrack’s first Elliott Wave Academy video
Ensure you’re tracking our forecasts – subscribe online for the EW-COMPASS REPORT.
Visit us @ www.wavetrack.com and subsribe to our latest EW-COMPASS report!
Mifid II – About WaveTrack International – DID YOU KNOW?
by WaveTrack International| October 23, 2017 | No Comments

Mifid II – Presenting WaveTrack’s advisory licence for Institutional Client Services
Mifid II – About WaveTrack International
Did you know that WAVETRACK INTERNATIONAL is the only independent ELLIOTT WAVE research company in the world that holds an advisory license and is a regulated financial company?
This is all-so-important as new European Mifid II regulations kick-in from January 2018.
Research and Analyst Access
Our advisory license allows us to engage with institutional clients directly. Either, one-to-one or one-to-groups providing analyst access. The advantage is being able to discuss price forecasts that are specific to your portfolio, explaining the logic behind each result, answer your questions and discuss trading strategies.
This type of engagement with research analysts and portfolio fund managers goes on each day among investment banks and their clients. WaveTrack offers this service via our Live Update Forum too! Mainstream Elliott Wave analysis is somewhat limited because it must only be distributed through public media channels. This type of service does not require a regulatory license.
On-Demand Services
However, we are able to build analysis on-demand, in markets that are non-mainstream but important to your institutional portfolio and explain the process behind them!
If you are a portfolio fund manager and haven’t had the same institutional level services translated into Elliott Wave research before, then contact us for a trial. Our existing clients include Investment Banks, Pension Funds, Total/Long Only/Absolute-Return/Hedge Funds, Sovereign Wealth Funds, Corporate and Market-Making/Trading institutions. You’re in good company so join us now!
EW-Forecast Institutional Client Service
Live Update Forum – Direct Analyst Access
On-Demand Services
Furthermore, you can review our reports anytime or apply for a Trial if you are a member of RSRCHX Exchange or ResearchPool.
DOW THEORY & ELLIOTT WAVE
by WaveTrack International| October 17, 2017 | No Comments
Dow Jones Industrials vs DJ Transportation Average
In recent media commentaries, analysts have been warning of an Armageddon collapse in stock markets because CAPE and P/E ratios are so historically high. What they seem to forget is that highs can go even higher! There doesn’t seem to be the same public euphoria that accompanied primary wave 3’s peak into the dot.com highs of March 2000. Neither is Dow Theory offering any bearish divergences at this stage of the secular-bull uptrend.
In this next chart, we examine Dow Theory’s concept of bullish/bearish divergences between the Dow Jones Industrial Average and the DJ-Transportation Average at key turning points – see fig #1. Dow Theorists will differ in their ‘trigger’ points in activating a buy or sell signal, but this is predicated on a preceding divergence or out/underperformance between these two indices. In order for a trend to be established, Charles Dow postulated that indices or market averages must confirm each other. If they differ at higher-highs, or lower-lows, then the trend may be in a process of ending. As you can see, both indices are trading into higher-highs, simultaneously. There are no divergences with either one lagging behind the other which would indicate underperformance, or weakness. Instead, both are confirming the overall markets uptrend.
Fig #1 – DOW THEORY – DJ Industrial v. DJ Transports – Daily
Notable lagging or bearish divergences occurred prior to the 2007 financial-crisis and even in the minor corrections in 2011 and 2015-15 but not now. That’s good news for the foreseeable future, but what this doesn’t tell us is if there is a dual corrective decline around the corner!
Elliott Wave Analysis
The DJ-Industrial Average forecasts are in exact sync with the S&P 500. From what we can see, it is the same rhythm in the DJ-Transportation Average – see fig #2. Bottom-left is the low at the grand ‘Re-Synchronisation’ lows of Feb.’16 at 6403.30. A five wave pattern uptrend has since unfolded as minor wave v. five. Exactly the same degree of trend (nomenclature) as the S&P 500 and DJIA! The Transports is also approaching a terminal 3rd wave high within this uptrend. Here Fibonacci-price-ratio targets are measured towards 10434.40-10504.10+/-. These levels are derived from Fibonacci-price-ratio measurements within minute wave 3’s advance that began from the June ’16 Brexit low of 7029.40.
Fig #2 – DJ Transportation Average – Daily
Once completed, minute wave 4 will begin a multi-month corrective decline lasting into year-end. Downside targets are towards the fib. 38.2% retracement area at 8975.50+/- (log scale). Extending this from the origin of wave 1 projects an ultimate high for wave 5 towards 11064.40+/- due sometime into the end of Q1’18.
Summing Up
The roles of Dow Theory (DT) and Elliott Wave Theory (EWT) differ. Dow Theory relies on the divergence effect at major peaks and troughs. Whereas EWT is a methodology tracking the seamless, sequential progress of price development. Both have their uses but are used quite differently.
With no obvious underperformance between the Dow Jones Industrials and the DJ-Transportation Average, we see no reason for supporting a major collapse as CAPE and P/E indicate. The Dow Jones Transportation Average is unfolding in sync with its major contemporaries.
Ensure you’re tracking our forecasts subscribe online for the EW-COMPASS REPORT.
Visit us @ www.wavetrack.com and subsribe to our latest EW-COMPASS report!
Check out WaveTrack’s latest CURRENCY VIDEO @ CURRENCIES and INTEREST RATES VIDEO PART III and subsribe to our latest EW-COMPASS report!
SPAIN IBEX-35 INDEX – CATALEXIT or BUST?
by WaveTrack International| October 12, 2017 | No Comments
CATALONIA INDEPENDENCE OR BUST?

Catalexit – Boom or Bust? Photocredit: Courtesy of Wikimedia Commons
History Repeats?
Geopolitical events remain in focus this year following on from 2014’s Scottish referendum, last year’s June Brexit vote in the United Kingdom and Donald Trump’s surge into the White House last November. Now, it’s Catalonia’s turn to hold the headlines with the Catalexit. Interestingly enough, at each stage prior to the voting, the stock market has proved to be a reliable barometer in forecasting the outcome of each event.
Scotish Referendum
For example, just before the Scottish referendum of September ’14, the U.K.’s FTSE-100 index hit an important peak at 6904.86 which from an ELLIOTT WAVE perspective, ended intermediate wave (B), the second sequence of an expanding flat corrective pattern, opening the way for wave (C) declines which after the vote, sank prices down to 6072.68, down -10.8% per cent in just about a month. This was a perfect forecast even though to consensus views, the Scots vote to remain in the Union was thought to be bullish, not bearish.
Brexit
Then there was Brexit in June ’16. The FTSE-100 was already trending higher from the Feb.’16 lows prior to the vote on June 23rd – ELLIOTT WAVE forecasts had already signalled a temporary correction ending and a resumption of the dominant uptrend shortly before the vote. When the shock news came through in the early hours of the next morning, the index had a momentary wobble, trading down to 5788.74 but later surging higher to resume that uptrend. Once again, the index performed exactly to forecasts, even though from a fundamental, economics viewpoint, the market behaved completely contrary to conventional logic.
US Presidential Elections
The outcome of November’s Clinton vs. Trump Presidential election was again at odds with consensus thinking. If you remember, the media led us to believe that a Trump victory, albeit a remote possibility, would be a disaster for the U.S. economy. The fact that opinion turned quickly around after Trump’s inaugural speech was beside the point because the markets surged higher afterwards. But from an ELLIOTT WAVE perspective, the November 8th victory for Trump was ‘telegraphed’ a long time beforehand, labelled as ending a typical 2nd wave correction for the S&P 500 futures at 2028.50.
Catalexit – Independence or Bust?
So what next for Catalonian Independence? Does the Spanish IBEX 35 index indicate that independence will become reality? Or will the province go bust in their bid to break free from Spanish Sovereignty? As we’ve already seen from previous events, the problem is that the actual outcome of the event has little influence over the ultimate direction of the market – a consistency in economic fundamental logic simply doesn’t work.
IBEX-35 Index FORECAST – Indicator for the Catalexit Outcome?
From an ELLIOTT WAVE perspective, the IBEX 35 index has just completed a counter-trend decline that originated from the May high of 11240.00 into last week’s low at 9840.00 – see fig #1 (futures). This sequence has unfolded into a perfect double zig zag pattern where the first zig zag decline ending into the late-July low of 10350.00 is extended by a fib. 61.8% ratio, projecting the terminal low for the secondary sequence to the exact low traded on October 5th at 9840.00. Don’t forget, this low formed just a few days following the October 1st independence referendum. The swift push higher that followed provided what we term as a ‘reversal-signature’ confirming its completion and triggering the beginning of a new sustainable uptrend.
IBEX 35 Mini Futures – 180 mins. – Elliott Wave Chart
If we zoom-out and insert this component sequence into its larger aggregate pattern, we can see that this corrective decline is simply ending a primary degree 4th wave within a developing five wave up-trending pattern – see fig #2 (cash index). A 5th wave advance is really bullish because it not only pulls the index back above the May ’17 high of 11180.30 (11240.00 futures) but using proprietary fib-price-ratios, projects a terminal 5th wave high towards 12618.70+/-, about +23% per cent above current levels.
IBEX 35 Index – Daily – Elliott Wave Chart by WaveTrack International
Conclusion
We’ve demonstrated the ability to forecast the direction of the world’s major indices around major geopolitical events over the last few years, which is sound knowledge for any investor, fund manager or trader. But as we’ve also seen, the fundamental, or economic logic more often fails to explain the outcome of the event on each occasion. So it’s dangerous to think that just because the IBEX-35 index is forecast significantly higher over the next 6-month period, that Catalonia’s Catalexit-bid for independence will fail.
So far, talks between Catalonia’s regional leader Carles Puigdemont and Spanish Prime Minister Mariano Rajoy continue. Assuming the market’s logic that an uptrend in the IBEX-35 index indicates a political victory for Spanish unity then that outcome is indicated by the Elliott Wave analysis. But as time has proven before, economic logic often flies out of the window!
Elliott Wave @ its best!
Ensure you’re tracking our forecasts – subscribe online for the EW-COMPASS REPORT.
Visit us @ www.wavetrack.com and subsribe to our latest EW-COMPASS report!
Tags: IBEX 35 Index Spain
MAGICAL 7 – Cycle Declines in 7th Year of Decade
by WaveTrack International| October 3, 2017 | 5 Comments
The 7th Year Cycle
Richard Mogey is a former Executive Director of the Foundation for the Study of Cycles and is one of the world’s foremost cycle analysts with over 50-years’ experience. His latest weekly cycle analysis has taken an in-depth look at the evidence surrounding the 7th Year Cycle in the stock market and asks the question – does the 7th year really show a strong dip in price levels on a consistent basis?
In a nutshell, yes, there is evidence that a strong sell-off does occur in the 7th year of the decade – Richard adds though that out of the 21 ‘seventh-year’ examples that begins from the year 1793, 9 do not conform to the recurrence of a strong sell-off, equivalent to 42% per cent.
7th Year Cycle Research basis Dow Jones (DJIA)
In order to gain a true representation of like-for-like comparison, Richard has converted the Dow Jones (DJIA) data into logs then into a rate-of-change. This certainly helps in evaluating which of the 7th years in each successive decade fulfilled the criteria of staging a strong sell-off and those that didn’t.
A few aspects that became obvious to me in the analysis was that in those years where a 7th year did stage a mini-crash, this generally occurs into the last quarter of the year. Some did form a cycle-trough slightly earlier, but those that did fit the model ‘perfectly’ generally began those declines a few months previously.
Here are a few examples of the ‘prefect’ modelling from Richard’s analysis (fig’s # 1-3):
Fig #1 – Dow Jones Cycle – 1937 – analysis by Richard Mogey
Fig #2 – Dow Jones Cycle – 1967 – analysis by Richard Mogey
Fig #3 – Dow Jones Cycle – 1987 – analysis by Richard Mogey
Note that the peaks form in July/August, bottoming October/November.
Now take a look at the previous 7th year cycle of 2007 – see fig #4.
It didn’t quite unfold into the ‘idealised’ pattern frequency as the preceding peak occurred much earlier in the year in May forming two lows later, in August and eventually in November. But overall, it fulfilled the basic criteria of the form.
Fig #4 – 2007 – analysis by Richard Mogey
Richard concluded that this year’s stock market has had a straight-line upward trajectory since last year’s Presidential election so the available time remaining to fulfil a strong sell-off is now quite short as we enter the final quarter of this 7th year. If 2017 is going to be the thirteenth year that fulfils the strong sell-off criteria, then it would have to begin almost straight away.
Certainly, there is downside risk in this cycle’s analysis, but can Elliott Wave analysis clarify the probabilities?
Elliott Wave – Approaching 3rd Wave Peak
In WaveTrack International’s recent updates of the Elliott Wave Navigator and Elliott Wave Compass reports, the S&P’s upside progress from the grand ‘RE-SYNCHRONISATION’ lows of Feb.’16 illustrates an incomplete five wave ‘expanding-impulse’ pattern in upward progress. But it is approaching a terminal high for its 3rd wave sequence. See fig #5.
S&P 500 – Daily – analysis by Peter Goodburn – WaveTrack
At the moment, the S&P is still pushing to higher-highs, to new record highs, but the upside targets to complete its 3rd wave which began from the June ’16 Brexit low of 1991.68 are fast being approached. Is this Richard’s 7th year cycle peak coming to fruition? If so, it’s several months late.
We believe this will trigger a strong sell-off as a 4th wave correction unfolds – the exact same Elliott Wave pattern is also visible in the Dow Jones (DJIA) – watch for resistance towards 22750.00 to 22800.00+/-.
For the S&P 500, a 4th wave correction would pull prices down towards the fib. 38.2% retracement level at 2338.00+/-. Depending on exactly where the 3rd wave peaks, towards 2553.00-2580.00+/-, this is about an -8% or -9% per cent correction. That would certainly conform to Richard’s criteria for adding 2017 as one of those 7th years that resulted in a strong sell-off.
After the 7th Year Cycle Lows
Now the good news (especially for portfolio fund managers and long-only funds!) – Richard adds that once the strong sell-off is over, the markets recover again but not into a correction but into higher-highs. He estimates the next advance is good for a +10% to +12% per cent gain.
From an Elliott Wave perspective, that would fit perfectly into the development of a final 5th wave advance, which projects the S&P 50 towards 2739.55+/- sometime into the end of Q1 2018.
So there we have it. There is definitely some downside risk for U.S. and global stock markets as we enter into this final quarter of the 7th year of this decade. I would add that Richard says that if a more imminent decline is avoided, the Dow Jones (DJIA) could easily stretch this year’s gains by another +8% to +10% per cent. Either way, a little piece of history is expected to be made before the year end – and you can probably guess which way I’m expecting the markets to trade!
If you wish to know more about Richard Mogey’s amazing work and CycleTech software you can contact him here:
Richard Mogeys Cycle work and CycleTech Software
email: rmogey@comcast.net
Learn more about Richard Mogey’s background
Richard Mogey, one of the world’s foremost authorities on cycles, has been studying cyclic activity in disciplines from natural phenomena to financial markets. He is a direct heir to the philosophy of Edward R. Dewey who founded the Foundation for the Study of Cycles.
From 1988 to 1997 Mr. Mogey was the Research Director, Executive Director, Chief Financial Officer, and Chief Economist for the original “Foundation for the Study of Cycles, Inc.”, an international nonprofit research organization. He was the chief statistician and economist at the Foundation from 1989 to 1997. He created and co-authored two magazines for investors, Business and Investment Cycles and Cycles Projections, and was responsible for the editorial content of the popular journal, Cycles Magazine. He has developed the Foundation’s award winning cycle analysis software, Techsignal.
He wrote for 10 years’ articles for Cycles Magazine which is available in all major libraries. His articles can easily be found online. From 1997 to 2003, he was Managing Director and Director of Research at Iris Financial Group, a hedge fund in Portland, Or.
In 2005, he returned to the Foundation for the Study of Cycles as Chief Voluntary Officer. Richard also served as, Director of Research and Chief Economist from 2005 -2010. From 2010 to 2012, he directed several trading projects at Weiss Research, in Jupiter Florida.
From 2004 to 2015 he was Head of research at CMF Investment Advisors, LLC.
He currently is Head of Research at Vorsus Capital, LLC. From 1995 to present he has developed proprietary stock and futures trading tools and software.
He has lectured at the University of Virginia and Temple University’s Business Schools on economics and the business cycle. He has spoken widely and has presented papers at economic conferences world wide including the Russian Academy of Sciences. He is an experienced computer programmer with an extensive background in statistics.
Richard has a BA in Philosophy and Classics, Magna cum Laude, from the University of California at Irvine.
BITCOIN – BUBBLE OR NO BUBBLE?
by WaveTrack International| September 13, 2017 | No Comments
Bitcoin – To Be or Not To Be?!
Much hype has surrounded Bitcoin over the last few years but especially this year since prices of the crypto-currency have gained by a phenomenal +555% per cent! So far, I’ve resisted various requests to look into the Elliott Wave pattern development of Bitcoin, mainly because its data-history is relatively short, beginning from July 2010 which shortens the odds of making reliable long-term price forecasts. But also because its reason for existence relies on the idea that we shouldn’t trust the banking system allowing users to transact outside the system.
Executive Order 6102
That’s all sound logic except when you realise that governments can control transactions just as they did back in year-1933. This was when Executive Order 6102 was implemented by President Franklin D. Roosevelt which prevented the ownership of gold coin, bullion, certificates by any individual, partnership, association or corporation. Several notable arrests were made as confiscations continued within U.S. borders. If history has a precedent like this, yes, it can repeat sometime in the future given the right conditions of financial stress.
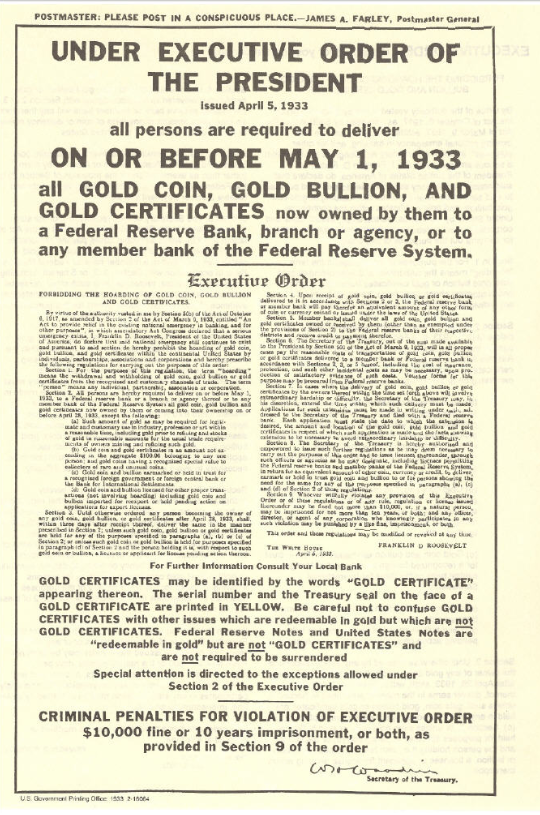
Gold Coin, Gold Bullion Confiscation by the order of the President – 1933 – image source by courtesy of Wikipedia
A modern day example surfaced in Monday’s press – the Chinese government announced it is planning to shut down platforms that transact in the buying and selling of Bitcoin. The Bank of China has led a draft of instructions that would ban Chinese exchanges from providing virtual-currency trading services. Furthermore, Chinese authorities have now declared the mechanisms that raise funding for crypto-currencies or Initial Coin Offerings (ICO’s) as illegal. How much further are these restrictions going to go?
Does this mean that we shouldn’t invest in Bitcoin? After all, many analysts are voicing concerns of a bubble that is about to burst!
Well, there’s always a chance that other governments will also close down crypto-currency platforms – that is the risk we face. But from an Elliott Wave perspective, the exponential uptrend seems likely to continue over the next year or two.
Bitcoin – Cryptocurrency – No Bubble!
A 5th wave advance began from the Jan.’15 low of 170.00. It began building into a typical step-like 1-2-1-2-1-2 sequence until earlier this year, in January ’17 when it finally underwent ‘price-expansion’ which characterises its 3rd-of-3rd-of-3rd wave acceleration. This is where this year’s gain of +555% per cent comes from. So far, this third wave impulse pattern remains incomplete, aiming for price levels towards 6932.00+/- (yes, that’s a gain of +62% per cent from current levels of 4261.00). And even after a corrective decline, the is more upside potential going forward to complete the larger five wave pattern from the Jan.’15 low.
Shorter-Term – Fib-Price-Ratios
Within this year’s 3rd-of-3rd-of-3rd wave advance, it’s finalising fifth wave advance began pulling prices higher from the July ’17 low of 1905.96 (intraday recorded 1809.26). Furthermore, this subdivides into a five wave pattern labelled in micro-degree, [1]-[2]-[3]-[4]-[5]. Wave [4] is currently engaged in a corrective decline from the current all-time-high of 4920.24 – see fig #1.
Bitcoin – 60 mins. chart – Forecast by WaveTrack International
It seems that Bitcoin unfolds into the overall rhythms and patterns defined by the Elliott Wave Principle. In this chart, we can see the finalising sequences of wave [3] advance. Its fourth wave subdivision, labelled wave < 4 > can be seen taking the form of a symmetrical expanding flat pattern from 4419.21 to 3601.06. Note the adherence of fib-price-ratios, where wave ‘a’ from 4419.21 to 3817.85 is extended by a fib. 9.01% ratio to project the high for wave ‘b’ to 4471.67 and by a fib. 38.2% ratio for wave ‘c’ to 3601.06.
The following advance as wave < 5 > unfolds into a five wave impulse pattern which includes an uncommon 1st wave ‘extension’. Its finalising fifth wave unfolds by a fib. 38.2% ratio of the net gain in the first-third sequence projecting close to the high at 4920.24.
A Counter-Trend Decline
The high at 4920.24 ended micro-wave [3] which originated from the July 26th low of 2409.21. Wave [4] has since begun a counter-trend decline, taking the form of a double zig zag pattern, labelled < a >–< b >–< c >–< x >–< a >–< b >–< c >. This appears incomplete with the pattern projecting more declines over the coming week or two.
The first zig zag ended at 4124.00 earlier this month (September) with wave < x > subsequently ending a rally to 4678.90. Should fib-price-ratio equality exist, then the secondary zig zag will ultimately test levels towards 3922.00+/-. Extending the first zig zag by a fib. 38.2% ratio projects slightly lower to 3855.00+/-. Once tested, we expect to see Bitcoin resume its larger uptrend.
Conclusion
From an Elliott Wave perspective, there seems little doubt that Bitcoin has much more upside potential, not only in the months to come but the next couple of years. Talk of a bubble burst seems far too early, even though this year’s exponential gains are impressive. The objective is to ride the wave, but get out before the inevitable collapse that will surely follow.
Ensure you’re tracking our forecasts – subscribe online for the EW-COMPASS REPORT.
Visit us @ www.wavetrack.com and subsribe to our latest EW-COMPASS report!
Solar Eclipse, Donald Trump, 7-Year Cycle and The Harbinger
by WaveTrack International| August 24, 2017 | No Comments

The Harbinger, Solar Eclipse, Donald Trump and 7-Year Cycle
The Harbinger by Johnathan Cahn or SHEMITAH REVISITED
Monday’s U.S. Solar Eclipse was quite an event, even though I was only viewing this from a live streaming event hosted by NASA. We’ve had two solar eclipses in Munich, Germany since I arrived eighteen years ago and on both occasions, took photographs of the moon’s gradual transit across the sun until just the corona was visible – amazing! But what has that to do with The Harbinger or our ‘Shemitah Forecast‘ two years ago?
The eclipse triggered another memory – it was reading Jonathan Cahn’s The Harbinger book whilst on my annual sabbatical (summer recess/vacation) a few years ago. I thought this to be a very intelligently written and well-researched book on how the Harbinger reveals a potential path of redemption for the U.S. and the World. It refers to the Bible’s various passages related to solar eclipses and its portent:
Matthew 24:29
‘The sun will be darkened, and the moon will not give its light; the stars will fall from the sky, and the powers of the heavens will be shaken’
The Harbinger, Solar-Ecplise and Donald Trump
President Trump, as head of state, seems bent on an unintentional path of self-destruction. In the light of this I wondered what his administration represents at a time of heightened geopolitical tension – especially in connection to the prophecies in ‘The Harbinger’. When I dipped briefly into Jonathan Cahn’s blog, I read that he has it on good authority that some of President Trump’s closest allies are aware of the Harbinger and some of its prophecies. Donald Trump was born on an eclipse day, adding to the intrigue and drama. Does yesterday’s solar eclipse have significance for Trump given its transit across the United States?
One of the interesting aspects of The Harbinger was its description of the 7-Year Shemitah cycle. I took some interest in this, and thoroughly checked it out. My conclusions were aired in the Elliott Wave Navigator report dt. August 10th 2015. 1508_The Elliott Wave Navigator – Complimentary PDF-Download. It mainly dramatised stock market ‘shocks’ around a 7-year period and the 50-year Jubilee year in September ’15. These cycles did signal the sharp accelerative decline of -10.7% in August and the resulting recovery which our analysis averaged historically to +23.7% per cent – the following advance was more like +18.9% per cent – pretty good! Compare BEFORE & AFTER – fig’s #1 & #2.
Fig #1 – Dow Jones 30 Index – Daily – Forecast 9th August 2015
Fig #2 – Dow Jones 30 Index – Daily – Result 22nd August 2017
The Paradigm
I haven’t returned to the Harbinger or the 7-year cycle since, mainly because the next 7-year event is still some way off. But I did discover that Jonathan Cahn is preparing to publish his next book next month, entitled ‘The Paradigm’ on September 19th. Sadly, it will come too late for this year’s sabbatical, but this might be worth taking a look. Maybe it reveals another aspect of the 7-Year Shemitah cycle relevant to the current SECULAR-BULL UPTREND?!!
Most sincerely,
Peter Goodburn

Recent Posts
Recent Comments
Archives
- June 2026
- February 2026
- December 2025
- August 2025
- July 2025
- June 2025
- March 2025
- February 2025
- January 2025
- December 2024
- August 2024
- July 2024
- June 2024
- May 2024
- April 2024
- February 2024
- January 2024
- December 2023
- August 2023
- July 2023
- June 2023
- March 2023
- February 2023
- January 2023
- December 2022
- November 2022
- October 2022
- August 2022
- July 2022
- June 2022
- May 2022
- March 2022
- February 2022
- January 2022
- December 2021
- August 2021
- July 2021
- June 2021
- March 2021
- February 2021
- January 2021
- December 2020
- November 2020
- August 2020
- July 2020
- June 2020
- May 2020
- April 2020
- March 2020
- February 2020
- January 2020
- December 2019
- October 2019
- September 2019
- July 2019
- June 2019
- May 2019
- April 2019
- March 2019
- February 2019
- January 2019
- December 2018
- November 2018
- September 2018
- August 2018
- July 2018
- June 2018
- May 2018
- April 2018
- March 2018
- February 2018
- January 2018
- December 2017
- November 2017
- October 2017
- September 2017
- August 2017
- July 2017
- June 2017
- May 2017
- March 2017
- February 2017
- January 2017
- December 2016
- November 2016
- October 2016
- September 2016
- August 2016
- July 2016
- June 2016
- May 2016
- April 2016
- March 2016
- February 2016
- January 2016
- December 2015
- November 2015
- October 2015
- September 2015
- August 2015
- July 2015
- June 2015
- May 2015
- April 2015
- March 2015
- February 2015
- January 2015
- December 2014
- November 2014
- October 2014
- September 2014
- August 2014
- July 2014
- June 2014
- May 2014
- April 2014
- March 2014
- February 2014
- January 2014
- December 2013
- November 2013
- October 2013
- September 2013
- August 2013
- July 2013
- June 2013
- May 2013
- April 2013
- March 2013
- February 2013
- January 2013
- December 2012
- November 2012
- October 2012
- September 2012
- August 2012
Categories
- ADXY Index
- Agnico Eagle Mines
- AI Artificial Intelligence
- Alcoa
- Amazon
- AngloGold Ashanti
- Antofagasta
- APPL
- Apple
- ASX 200
- AUD vs USD
- AUDNZD
- AUDUSD
- Australia ASX 200
- Baltic Dry Index
- Banking
- Base Metals
- Biotechnology
- Bitcoin
- Bovespa
- Broadcom
- Catalexit
- central banks
- Christmas
- Commodities
- Commodities Video Outlook 2020
- Conference
- Copper
- Coronavirus Sell-Off
- CRB
- Crude oil
- crude oil price chart
- CryptoCurrency
- Currencies
- Currencies + Interest Rates Video Outlook
- Cycles
- Dax 30
- deutsche bank
- Dewey Cycle
- DJ Transportation Average
- DJ Utilities
- Dow Jones 30
- Dow Theory
- ECB
- economy
- Elliott Wave
- Elliott Wave Charts
- Elliott Wave Patterns
- Elliott Wave Principle
- Emerging Markets
- Ending-Diagonal Elliott Wave Pattern
- Equity
- EUR vs CHF
- EUR/USD
- Euro / US$
- Eurostoxx 50
- EuroStoxx50
- EuroStoxxBanks
- EURUSD
- Expanding Flat Pattern
- FAAMG
- FANG+
- fib-price-ratio
- Fibonacci Trading
- Fibonacci-Price-Ratio
- Financial Forecasting
- Fixed Income
- forex
- Freeport McMoran
- FTSE 100
- Fund Management
- FX
- FXStreet
- GBP/AUD
- GBP/USD
- GDX
- GDXJ
- Germany 10 year Euro Bund future
- Gilead Sciences
- Glencore
- Global Economy
- Gold
- Gold Mining
- Golden Ratio
- goldman sachs
- Google Inc.
- Google/Alphabeth
- Greek debt crisis
- Hang Seng
- Harbinger
- Hungarian Forint
- IBEX 35 Index Spain
- Independent Research
- India-CNX Nifty 50
- Interest Rates
- Interview
- IRP Independent Research
- kbw bank index
- Lonmin
- MAG-7
- McDonald's
- MID-YEAR VIDEO UPDATE!
- Mifid II
- Mines
- Mining
- MSCI China
- MSCI Emerging Markets
- Nasdaq 100
- Nasdaq Biotechnology Index
- Nasdaq Composite
- Nasdaq100
- Netflix
- Newmont Mining
- Nikkei 225
- NVIDIA
- NYSE Composite Index
- Palladium
- Platinum
- Precious Metals
- Ralph Nelson Elliott
- Reversal-Signature
- Russell 2000
- Russia RTS
- S&P 500
- Sector
- Secular-Bull
- Sentiment Survey
- Shanghai Composite Index
- Silver
- Slanting Flat Elliott Wave Pattern
- SP100
- SP400 Mid-Cap
- SP500
- SPX 500
- STLG/AUD
- Stlg/US$
- STLG/USD
- STLG/YEN
- STLG/ZAR
- Stock Index
- Stock Index Tracking
- Stock Index Video
- Stock Indices
- Stock Indices Video Outlook 2023
- Stock Indices Video Outlook 2025
- Sugar
- Summary
- Tesla
- Tesla Inc
- Toyota
- Track Record
- trading
- Trusts
- Tutorial
- Uncategorized
- UniCredit
- US
- US Dollar Index (DXY) (USDX)
- US$ Index
- US-Dollar Index
- US10yrYields
- USD
- USD/ARS
- USD/CNY
- USD/IDR
- USD/INR
- USD/MXN
- USD/SGD
- USD/THB
- USD/YEN
- USD/ZAR
- Vale
- Value Line Index
- video
- VIDEO OUTLOOK 2018
- VIDEO OUTLOOK 2020
- VIX
- W.D. Gann
- WaveTrack International
- XAU Gold/Silver Index
- Xetra Dax
- XOP
- Yields
- Zig Zag
- Zinc
- ‘INFLATION-POP’
- ‘SHOCK-POP-DROP’