Lonmin PLC confirms a reversal signature
by m.tamosauskas| October 18, 2015 | No Comments
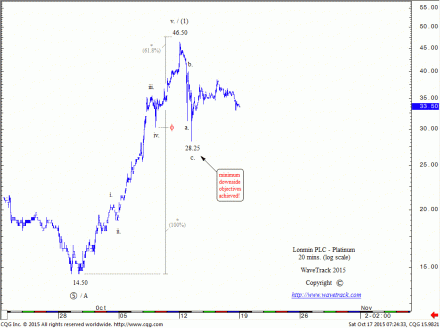
Over a month ago, Lonmin PLC has started to surprise most of market participants with a sharp advance from the 14.50 low (see the previous forecast here). This upswing has extended up to 46.50 level, producing a stunning +220% price increase in a very short period of time. Moreover, this advance unfolded into a five wave expanding-impulse pattern, labelled i.-ii.-iii.-iv.-v. in minor degree with almost a perfect fib-price-ratio measurement – extending the net advance of waves i. to iv. by a fib. 61.8% ratio to project upside objectives for wave v. This confirms our reversal signature to the upside, suggesting much more will come in the months/years ahead!
Peter Goodburn on Elliott Wave, Diagonal Patterns & a Killer Stock Pick (52Traders)
by m.tamosauskas| October 8, 2015 | No Comments
 Peter Goodburn, the founding partner of WaveTrack International, and his trading experience spans back to the late 1970’s working then in the commodities business for exchange members and their clients. In those earlier years of his career, he created the first OTC (over-the-counter) copper option product based upon the comex (New York) contract around the mid-eighties, and in the same period, devised Opval, an option-evaluation software program that is currently used in many of the major market-making institutions of today. Recently, Peter was invited to join a ‘52Traders’ podcast to share his experience with wider audience. Read or listen the entire interview here: http://52traders.com/peter-goodburn/ . Find out why Elliott Wave analysis is used by many institutional managers nowadays. What are the most important aspects beginning using the EW for trading and investing? Killer stock pick and much more!
Lonmin PLC like a phoenix arising from the ashes
by m.tamosauskas| October 5, 2015 | No Comments
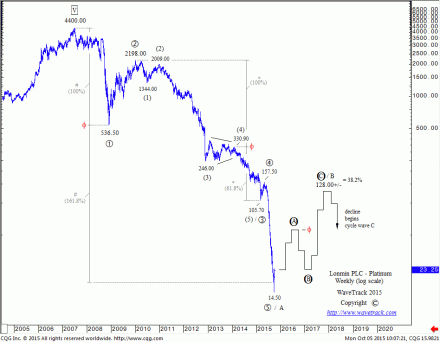
The devastating decline that began from the July ’07 high of 4400 has reached as low as 14.50 in Sep.’15. In our latest update of this equity we were looking for a minimum downside target below the March ’15 low of 105.70 but it has extended much lower. Despite this however, the recent price development shows a sign of life – Lonmin PLC has advanced from the 14.50 low to above 23.00. Basis revised Elliott Wave analysis, the decline from the 4400 high into the 14.50 low is best described as a five wave expanding-impulse pattern, suggesting the following advance will unfold into a corrective sequence. It has a potential to advance much higher, but we stay conservative here with a call of a fib. 38.2% retracement level of the preceding decline targeting 128.00+/- in the years ahead. The mining sector becomes more and more interesting by each day, join us to find out more http://goo.gl/hQNwOu
Shemitah & the Federal Reserve
by m.tamosauskas| September 15, 2015 | No Comments
The 29th day of Elul that marks the conclusion of the Shemitah occurred last Sunday, on the 13th September – the first day of trading, Monday 14th got underway without incident – phew! Although our latest ‘The Week Ahead’ video expected it to be a non-event on the day, it may yet have repercussions as our attention now draws ever closer to Thursday’s interest rate decision by the Federal Reserve in its latest FOMC meeting. The rate decision will be announced at 14:00 ET, that’s 11:00 on the West coast, 15:00 S. America, 19:00 London, 20:00 Europe, 22:00 Middle East, 02:00 am (Friday) in Shanghai and 03:00 am Tokyo.
Eurodollar 3mth Futures
We thought to take a look at the US Eurodollar 3mth futures contract to gauge whether the Federal Reserve would surprise and leave rates on hold, or hike by +0.25% as consensus seems to be heading.
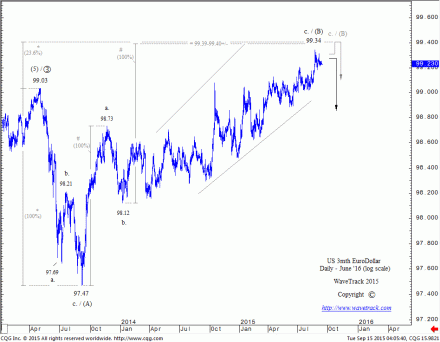
This first chart depicts the June ’16 futures contract engaged in a three price-swing (wave) zig zag upswing from the Sep.’13 low of 97.47 – see fig #1. Each of the two advancing sequences measure equally to 99.39 – this is a common geometric recurrence for the zig zag pattern that increases the probability of correct identification. Note that the two upswings look different – this is because the first to 98.73 has unfolded into a five wave ‘expanding-impulse’ pattern whereas the second from 98.12 has taken the form of a five wave ‘diagonal-impulse’ pattern. This is known as ‘pattern alternation’ and is a typical function of the zig zag.
Another interesting fib-price-ratio exists – extending the preceding decline (May-September ’13) from 99.03-97.47 by a fib. 23.6% ratio projects the zig zag upswing ending to 99.40+/-.
The current August high at 99.34 has come so close to these to calculations that it’s enough to draw some conclusions – that the upside is limited – but also this – THERE IS AN INCREASING RISK THAT PRICES JERK SIGNIFICANTLY LOWER.
The larger picture is even more inspiring, but we have to leave something special for our subscribers. The bigger picture and its implications are now available to all our EW-Compass subscribers.
SPECIALEW-COMPASS REPORT OFFER by
www.wavetrack.com
Where can I download the Shemitah Report? Login/Subscribe to the EW-Compass report. A new window with the report will open – here click on any of the charts or ‘View online report’ and on the right side click on the tab ‘Specials’! Here are various long-term reports ready for download.
Tags: US 3mth EuroDollar
Investment and Timing – Shemitah – The 7-Year Cycle
by WaveTrack International| September 8, 2015 | No Comments
Something important awaits you at the bottom of this message – but first, read on…
As many of you are aware, WaveTrack International’s application of the Elliott Wave Principle (EWP) is typically ‘purist’ in the way we use R.N. Elliott’s original guidelines as outlined in his two monographs, ‘The Wave Principle’ (1938) and ‘Nature’s Law’ (1946). Within the basic precepts of action/re-action processes are two branches of thinking and belief that form the basis of its workings – that price action is derived from swings in mass-psychology and the other, taking the form of Nature’s Law, governed by universal principles of number, ratio and proportion with the recognition that stock market price development is part of a much broader sequential growth/decay pattern that touches further into mankind’s awareness of his very existence.
Now, that last bit is quite a revelation because not all of us are at the point where we can accept the possibility that price development, whether this is in the stock market, bonds, currencies or commodity markets, is pre-determined – that certain ‘Laws’ are in operation which dictate the progress of anything, let alone the markets! Personally, I have absolutely no doubts because I’ve seen and witnessed real-life examples of the ‘Principles’ at work and have successfully tested them to my own satisfaction over the last 25 years. The US$ dollar index provides a good example.
Our historical data begins from the year 1660, but the period from the end of the America Civil War (1865) when the ‘Greenback’ was first accepted as the country’s dominant dollar began a perfectly formed five wave impulse pattern that ended into a final high in the year 1985, together with perfect Fibonacci measurements (120 year cycle – 2 x 60 years, W.D. Gann). I often use this example when I meet sceptics because the period encompasses fundamental and historical events that would seemingly ‘interrupt’ or ‘destroy’ the evolving pattern – such events as the second phase of the Industrial Revolution, the destruction of the European Monarchies, WWI, the Great Depression, WWII and so on.
Another example is the multi-year forecast published of the Dow Jones Index in year 2004. The chart drew an evolving ‘expanding flat’ pattern, forecasting a peak in Oct.’07 to within 29 points of the actual high and the following crash to within 59 points – this is not possible unless there are some defining ‘natural laws’ at work – a ‘deterministic’ process!
If we’re prepared to come a little closer to the underlying principles of the EWP, then it’s not such a quantum leap to also explore the timing of major directional changes. I’ve investigated many aspects of cycle theory over the last 20-years, following in the footsteps of many others studying the works of Benner, Kondratiev, Kitchen, Juglar, Kuznets and the more well-known discoveries of W.D. Gann and Dewey’s double-triangular table – even astronomy/astrology and the mystic forecasts of such men, long forgotten, like Sepharial. Now I’d like to share with you something connected to cycles that I recently came across concerning a 7-year periodicity – the Shemitah.
The Shemitah 7-year cycle has gained awareness in recent months through different media outlets but prominently from Jonathan Cahn’s book ‘The Harbinger’ and subsequently exploited by Jeff Berwick. It states that the end of the current Shemitah cycle is on the 13th September 2015, in several days’ time. On two previous occasions, this cycle has triggered a significant stock market sell-off – in September 2008, during the ‘financial-crisis’ when the Dow Jones collapsed by -29% and when the World Trade Center was destroyed in September 2001 with the Dow falling by -16% per cent. But this time, the current Shemitah cycle also begins a 50th year ‘Jubilee’, something that W.D. Gann was aware of from his cycle work.
So I began taking a good hard look at this, starting my own research into the Shemitah and scrutinising the exact dates of its beginning, its end. Not only that, I plotted how its effect on the Dow Jones Index occurred over the last 100 years. Well, that research was published in last month’s institutional Elliott Wave Navigator report, and I believe it to be so important, that I’d like to share it with you too!
The Shemitah 7-year cycle is just part of the EW-Navigator, but for the moment, just concentrate on this. The report includes tables of how the Dow Jones Index performed during the seventh year of the Shemitah and also what effect it had on the markets in the 3-months that followed its completion. So there you have it!…don’t miss out on this exciting time to follow how the end of the current Shemitah cycle will pan out – the exact date is the 13th September!
You can download the EW-Navigator report and the Shemitah 7-year cycle section from the ‘Specials’ section of the EW-Compass software – ABSOLUTELY FREE. Don’t delay, ensure your subscription is up-to-date.
Sincerely,
Peter Goodburn
SPECIALEW-COMPASS REPORT OFFER by
www.wavetrack.com
Where can I download the Shemitah Report? Login/Subscribe to the EW-Compass report. A new window with the report will open – here click on any of the charts or ‘View online report’ and on the right side click on the tab ‘Specials’! Here are various long-term reports ready for download.
Tags: W.D. Gann
Critical moment for the S&P 500 index
by m.tamosauskas| August 24, 2015 | 4 Comments
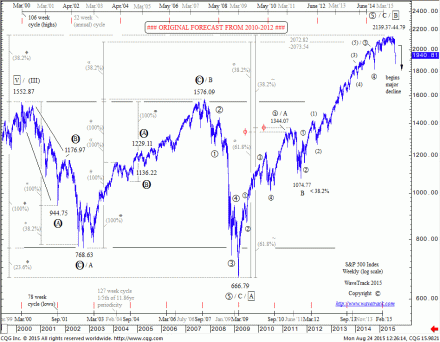
Our long-term subscribers may recall our original S&P 500 forecast from 2010-2012. We plotted a developing cycle degree, three price-swing zig zag advance unfolding from the financial-crisis lows of 666.79. Ultimate upside targets were measuring two key levels – 2139.37 and 2144.79. THE MAY ’15 HIGH WAS 2134.72! This measurement is dependent on the advance being a zig zag – such accuracy means we cannot entirely eliminate the possibility that the next stage of the multi-decennial expanding flat pattern is about to begin its next downswing as super-cycle wave C. The next several months will be critical in determining the longer-term picture. Join us and let’s explore the Elliott Wave Universe together!
Gold Stocks – Generational Opportunity!
by m.tamosauskas| August 18, 2015 | No Comments
Generational Opportunity!
During the last several years, from the pre-financial-crisis highs of 2006-2007, many of the major, global precious metal mining stocks have been engaged in multi-year declines that have unfolded into perfectly formed Elliott Wave counter-trend patterns. If these declines were small percentage affairs, then we probably wouldn’t be making much noise about it – but these are huge!
For example, Agnico-Eagle Mines has decline so far by -74.80 per cent! Barrick Gold, the largest gold miner in the world has declined during the same period by -87.88% per cent. There are many more too! To see major companies like these decline by such large percentages, you’d have to go back to the dot.com bust of 2000-2002 or even back to the Great Depression era of 1929-32 for equivalent comparisons. Sure, there are always individual cases where we see companies decline these percentages, but not an entire sector – that itself tells of an important message that something important is going on.
Well, something important is going on. The precious metal mining companies have been the out-of-favour sector for quite some time now, since dual highs formed in 2011. But some perfectly formed Elliott Wave patterns are now indicating of an imminent change that would have far-reaching implications for the next several years.
Our market reports for many of the precious metal mining companies have been the focus of our up-coming ‘inflation-pop’ theme for some time now, and we’ve updated these mining companies in various reports earlier this year.
But we’d like to announce the very latest Elliott Wave updates are now available for every subscriber to the Elliott Wave Compass report.
In the report, the latest wave counts are available for:
- Agnico Gold
- Barrick Gold
- AngloGold
- Newmont Mining
- RoyalGold
- Silver Wheaton
- Platinum
- Anglo American
- Lonmin
- PetroBras
Peter Goodburn
Chief Elliott Wave Analyst
WaveTrack International
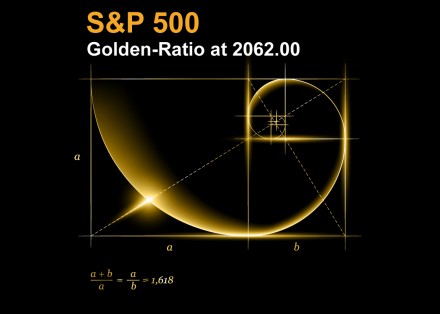
S&P 500 – Golden Ratio at 2062.00
by WaveTrack International| August 10, 2015 | No Comments
Much debate continues over the S&P’s course and direction with mainstream Elliott Wave analysts and bloggers hedging bets with various ‘alternate counts’ – so many in fact that it becomes a real head-spin!
But there are clues that provide a more realistic probability in favour of continued upside progress. But to see this, you have to leave behind certain U.S.-centric perceptions derived solely from staring at the S&P or Dow Jones futures every day. Instead, scan across the global scene of major indices and select a proxy index that’s unfolding into a reliable Elliott Wave pattern – one that can be easily identified. We’ve been doing this for entire year so far and it’s maintained an overall bullish outlook with Europe’s Eurostoxx 50 leading the way.
S&P 500 Golden-Ratio at 2062.00
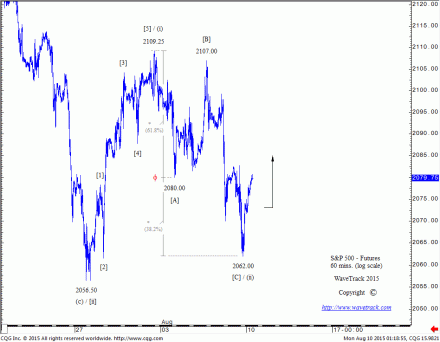
But during last week’s sell-off, even the S&P was clarifying the bullish intent for the markets to resume higher – see chart. The late July advance unfolded into a clearly defined five wave expanding-impulse pattern, beginning from 2056.50 and ending at 2109.25. This was followed by a deep counter-trend correction labelled [A]-[B]-[C].
Fibonacci-Price-Ratios (FPR) provide valuable clues in identifying the progress of a pattern, allowing differentiation when deciphering what pattern is unfolding whilst having the ability to eliminate other alternate counts. In this latest example that I’d like to share with you, the most common of FPR’s, the ratio 61.8% or ‘golden-ratio’ phi measurement is used to project the completion of the counter-trend decline.
Extending wave [A] x 61.8% = [C] at 2062.00 – this was the exact low traded last Friday evening.
The following upswing towards the 2080.00+/- level is enough to qualify a ‘reversal-signature’ – so from this action of pattern and ratio, we can surmise that the S&P is preparing to resume its uptrend.
Elliott Wave pattern of the month (US$ / Yen)
by m.tamosauskas| July 29, 2015 | No Comments
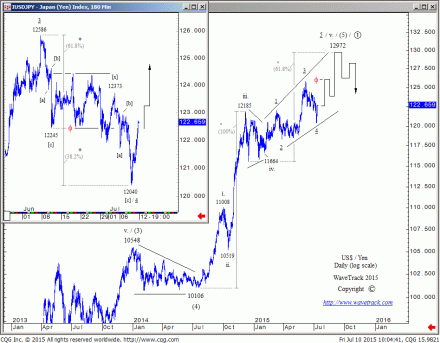
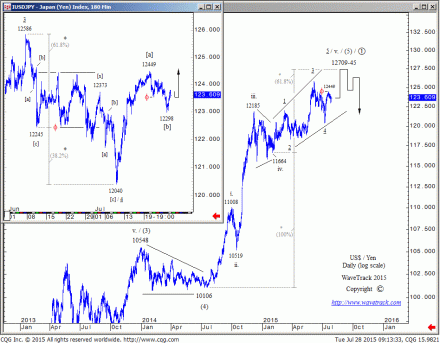
This month, we throw a glimpse on the US$/Yen. From the June high of 125.86, we saw a strong sell-off to a low of 122.45. This decline unfolded into three price swings and was therefore labelled as an [a]-[b]-[c] zig zag sequence. The subsequent price action however failed to trade higher and instead remained in a trading range of about 122.50 to 124.50.
In July, prices broke lower until they came to a halt at 120.40. For somebody not acquainted with Elliott Wave, this could have looked like the beginning of a much larger decline. But the Elliott Wave Principle, combined with our proprietary fib-price-ratio measurements for each individual pattern, provided a valuable clue.
First, a fib. 61.8% extension of the initial 125.86-122.45 decline exactly pinpointed the 120.40 low. This was the strongest evidence for the conclusion of the entire pattern from 125.86. But what kind of pattern? When we examine the structure, we see a similarity between the initial decline and the sell-off from 123.73 into the final low – both unfolded into 5-3-5 single zig zag sequences. This was the second clue that pointed to the conclusion that the US$/Yen had just completed a double zig zag pattern. This also explained the multi-week trading range that could now be labelled as wave [x] and classified as a running flat sequence.
Subsequent price action verified this count as the US$/Yen quickly continued higher and soon broke above the interim high of 123.73 high – a strong bullish signal.
Gold Bullion – Time to be a Contrarian!
by WaveTrack International| July 20, 2015 | No Comments
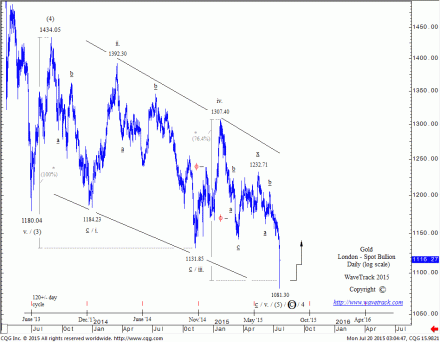
The Gold bullion declined over $53 dollars overnight as reports came through that half-an-hour after the Shanghai Gold Exchange opened, a Chinese source sold 5 tonnes of gold causing the sharp mark down of prices to a bullion low at 1081.30. Within minutes of the selling being completed, prices recovered quickly to 1114.80 as the London bullion dealers arrived at their desks to begin trading – there wasn’t much opportunity to buy at the cheaper levels, certainly not if your located in Europe or the U.S.
The sell-off traded smack into our long-awaited downside targets between 1096.00-91.16+/-, overreaching by just $9.8 dollars!
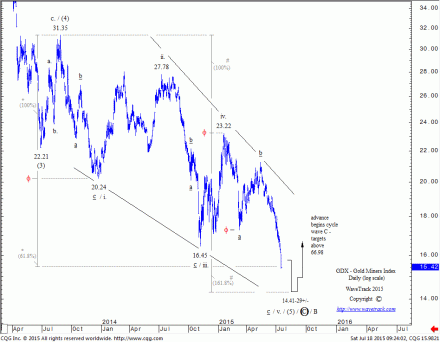
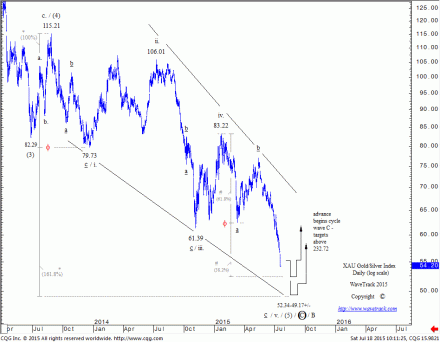
This latest action has far-reaching implications for the future of precious metals – one-by-one, all of the major commodity markets have been signalling the approach of a major ‘inflexion point’ – subscribe to the latest EW-Compass report and access the Gold/Silver forecasts, and the medium-term outlooks for Precious Metals and key indices like the GDX Gold Miners and XAU Gold/Silver Miners in our TWO-PART VIDEO SERIES.
Don’t miss out – get up-to-date now!
Subscribe to the EW-Compass here…
