Independent Research = IRP Journal – The New Generation of Research
by WaveTrack International| January 7, 2016 | No Comments
ANNOUNCEMENT | IRP JOURNAL | Latest Edition
To all our Subscribers, Club/Registrant members and Twitter/Facebook followers, we are pleased to announce WaveTrack International’s latest article published in the Independent Research Provider’s magazine. Issue 8/Volume 1 for December 2015 is off the press and you can read our article and others right now with this FREE complimentary download – just click on the link below:

IRP Journal – Independent Research – the new generation of research.
Furthermore, if you are interested in receiving the online-magazine each month, you can sign up for FREE, using this link:
Ensure that you insert your contact details into the correct category – for ‘Buy-Side’ (institutional) companies, Investment Banks, Pension Funds, Total/Absolute-Return/Hedge Funds, Sovereign Wealth Funds, Corporate and Market-Making/Trading institutions and informed individuals, use the ‘registration’ to the left of the page.
Why is Independent Research important?
Only conflict-free research can be used as an viable tool in investment decision-making.
How can you insure unbiased research?
Member business models are based on revenues paid to them for providing quality research – not from investment banking, underwriting, proprietary trading or market making, advisory or consultancy services for clients other than investors, or from companies that are the subject of their research.
What does IRP stand for?
Independent Research stands for quality, impartial investment research.
Connect to the IRP Journal via Twitter: IRP Journal TWITTER
WaveTrack is memember of the EuroIRP Association and supports the development of Independent Research.
The next Generation: Learn more why Independent Research is best financial trend in the last decade:
EU rules demand transparent research fees – Financial Times
ASX 200
by WaveTrack International| January 6, 2016 | No Comments

ASX 200 – Australia – Elliott Wave Compass Track Record
In November, we spotted a very interesting pattern developing for Australia’s ASX 200. The underlying story line is that the index (chart in the background) unfolded into an expanding flat counter-trend correction from its 4928 low whilst the futures (inset chart) synchronised with a single zig zag advance from their corresponding (deeper) 4733 low.
In the 13th November issue of our report, we forecast the ASX 200 to build to the downside in the weeks ahead as this convergence of pattern finalisation (an expanding flat for the index, a single zig zag for the futures) indicated the completion of the entire counter-trend correction labelled wave X in primary degree. But: we also forewarned of a possible halt at the 4963.00+/- level (see futures inset) that was derived by a fib. 61.8% extension of the initial sell-off from the October high of 5385.
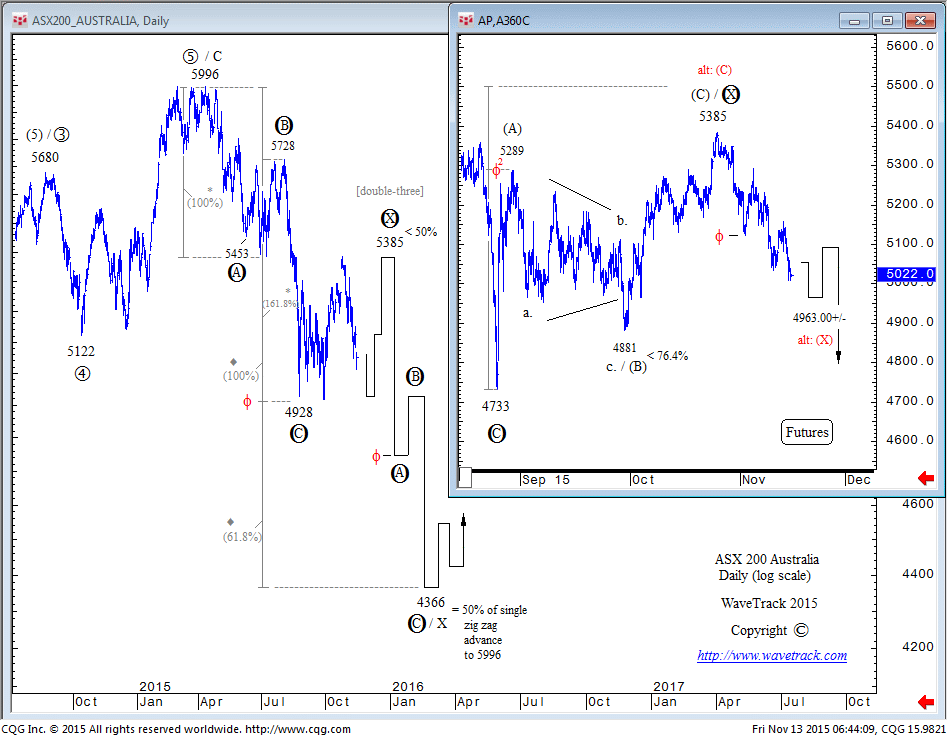
ASX 200 Forecast – 13th November 2015 – EW-Compass
What happened during the following weeks? The ASX 200 traded into a low of 4959 (see inset) and immediately reversed to the upside. This was no coincidence but the proof of well-established fib-price-ratio measurements – when prices react to these, it is almost always a strong sign of a more pronounced change in direction. In terms of the current situation for the ASX 200, it meant that the downswing from the October high of 5385 was only a temporary pullback – primary wave X would have to extend into a more complex correction: in case of the index, into a rare double three sequence (see background chart); in case of the futures, into a progressive double zig zag pattern (see inset).
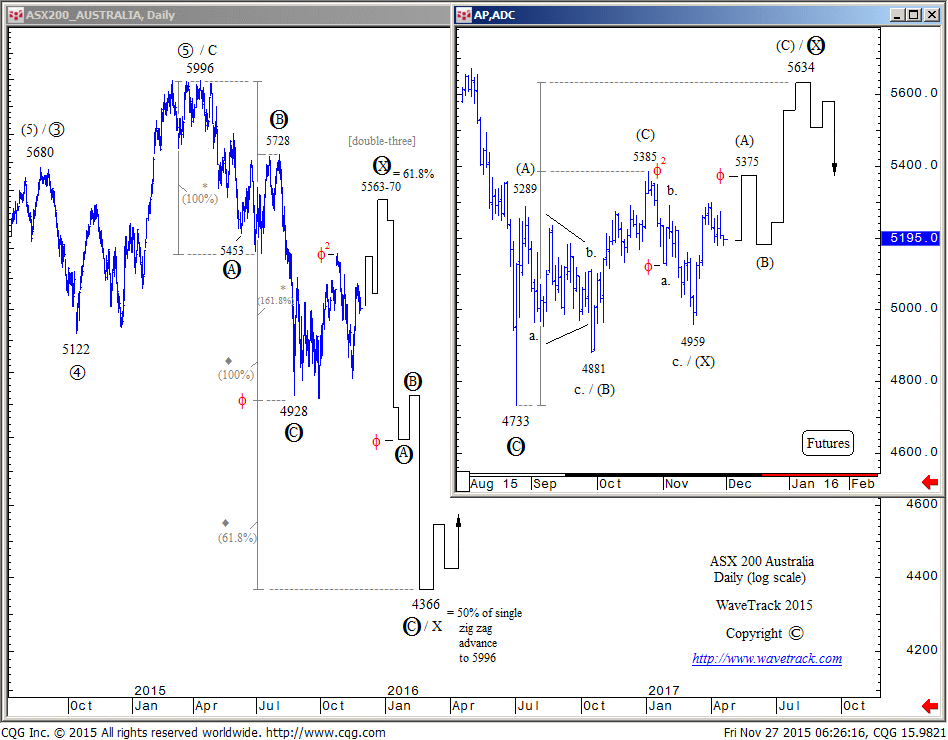
ASX 200 RESULT! – 27th November 2015
Don’t forget – our bi-weekly Elliott Wave Compass report features many short-term updates of various asset classes.
Start your New Year with Success
Subscribe to the EW-Compass here…
Merry Christmas
by WaveTrack International| December 25, 2015 | 1 Comment

Sawabona & Merrry Christmas!
Announcement – Christmas/New Year Schedule
by m.tamosauskas| December 24, 2015 | No Comments
 We’ll be taking the opportunity to rest the team a little during the following week, so this week’s EW-Compass report is the last for the year – the next edition will be published on Wednesday 6th January.
FEZ – SPDR Eurostoxx 50 ETF stages a reversal signature to the upside!
by m.tamosauskas| December 15, 2015 | 5 Comments
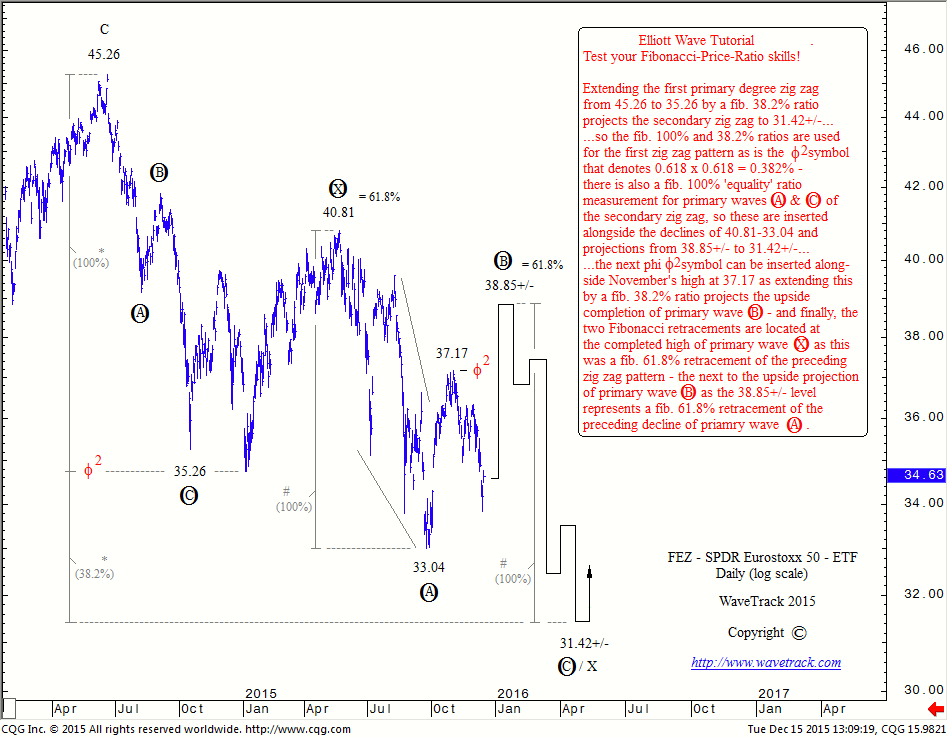
Last week we have been experimenting with the FEZ ETF which represents Eurostoxx 50 index. We found a near-perfect Elliott Wave structure and geometric Fib-Price-Ratio dimensions for a practice. As promised, now we are updating this chart with all annotations and explanation how to use our Fib-Price-Ratio methodology. Enjoy!
Tags: FEZ ETF
The hidden harmonic symmetry into the Elliott Wave pattern!
by m.tamosauskas| December 7, 2015 | 9 Comments
As we continue to update the myriad of different contracts within our ever-expanding portfolio in preparation for the release of annual 2016 forecasts, one new ETF has caught our attention. It is the ETF for the Eurostoxx 50 index and trades under the symbol FEZ. It has grossly underperformed the underlying index as all ETF’s do within a persistent declining phase because of the latent roll-overs etc. But somehow, this one has retained its near-perfect Elliott Wave structure and geometric Fib-Price-Ratio dimensions.

We would like to encourage you to train your eye spotting these powerful Fib-Price-Ratio and in this post we will leave annotations separate from the chart. Take a time and find most common Fibonacci ratios within a double zig zag pattern. We will update this chart during the next few days!
Tags: FEZ
Elliott Wave Pattern Precedes ECB Announcement
by WaveTrack International| December 4, 2015 | 8 Comments

Perfect Reaction Following ECB
Perfect Reaction Following ECB
Yesterday’s market reaction following the European Central Bank announcement was entirely predictable – no guessing required. Wednesday night’s update from the mid-week EW-Navigator supplement ahead of Thursday’s ECB meeting concluded…
‘…we expect the Eurostoxx 50 benchmark to decline by -5.4% per cent before resuming higher later. This probably suggests the ECB will either dilute its plan to extend its bond-buying programme or the market will be in some way disappointed with its tone’.
Contrary to consensus, this statement was made because a THREE WAVE ZIG ZAG pattern had just completed its advance from the mid-November low for the Eurostoxx 50 benchmark index. In this location, it is designated the SECOND sequence within a corrective EXPANDING FLAT decline, labelled intermediate wave (X). To complete the THIRD sequence, a decline of at least -5.4% was required. See original forecast from Wednesday’s report – fig #1. Downside targets are forecast to 3290.43-86.17+/-. These are derived where minor wave a. of the expanding flat is extended by a fib. 23.6% ratio and where the decline ends at the fib. 38.2% retracement level of the preceding advance.
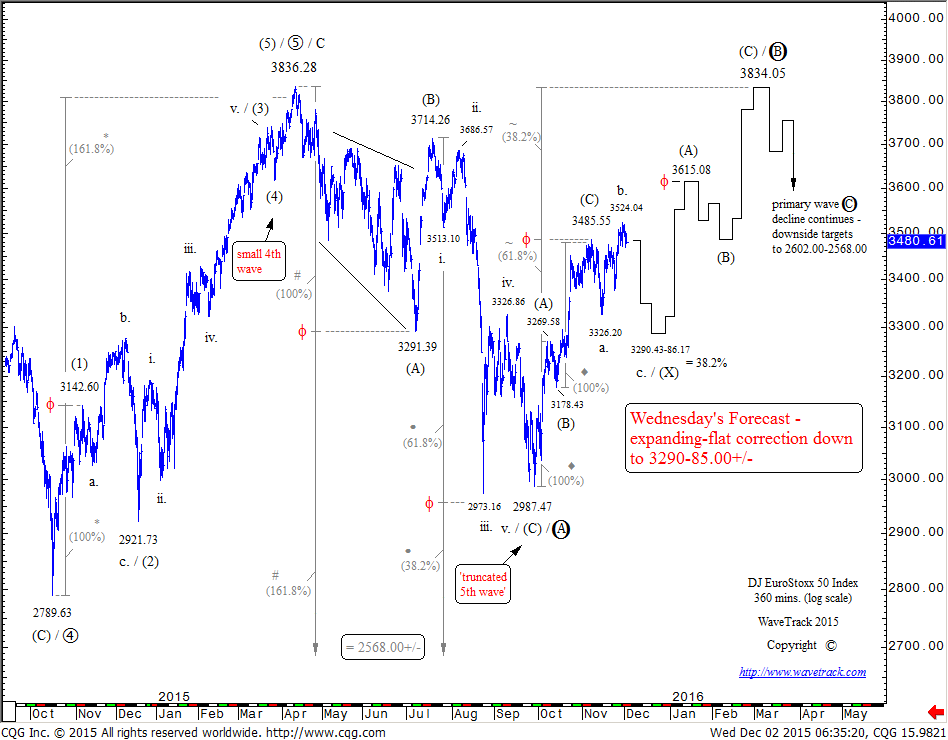
fig #1 – EuroStoxx – 360 mins.
This next chart illustrates a close-up view of the expanding flat and what happened after the ECB announcement – see fig #2. The decline represents the THIRD sequence of the EXPANDING FLAT, labelled minor wave c. It must unfold into a five wave pattern – original downside targets remain valid, but we’ve added to additional Fibonacci levels using a fib. 38.2% extension ratio, and 61.8% to 3267.27+/- and 3231.39+/- respectively. The 3231.39+/- level is also the fib. 50% retracement level of the preceding advance from the September low.
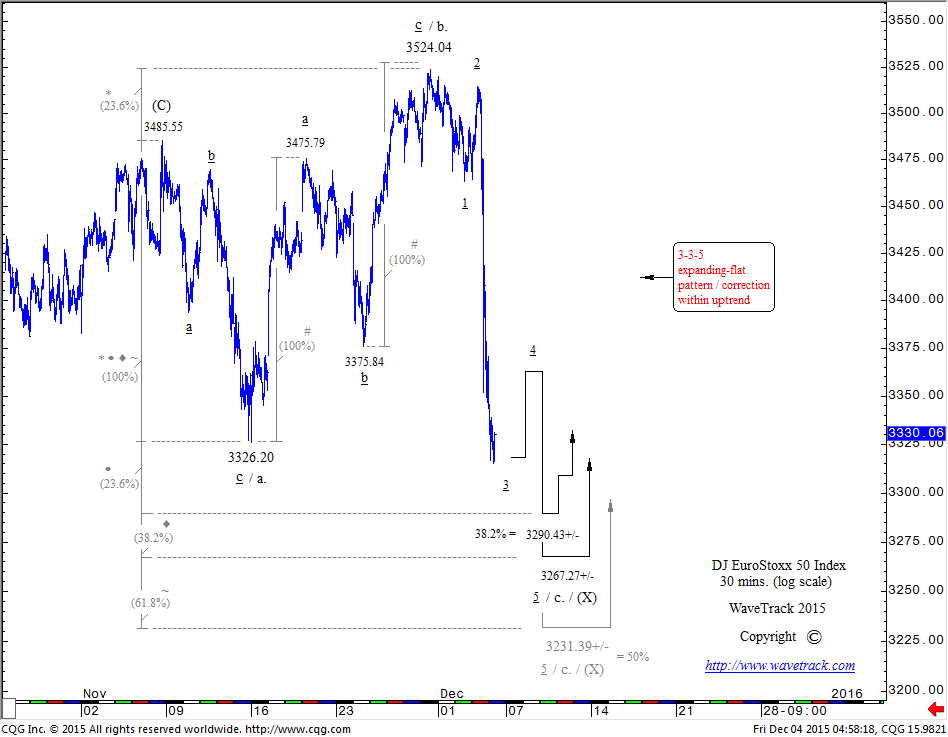
fig #2 – EuroStoxx – 30 mins.
In order to find the exact low point, the fourth wave within minor wave c.’s decline must unfold prior to taking additional measurements.
Looking at the implications of this EXPANDING FLAT, we know that such a pattern is a counter-trend sequence within a prevailing, dominant, directional UPTREND. So once completed, the uptrend is expected to resume.
Don’t forget – our bi-weekly Elliott Wave Compass report features many short-term updates of various asset classes.
Successful trading with WaveTrack International
Subscribe to the EW-Compass here…
Lonmin – Is there a Future?
by WaveTrack International| November 26, 2015 | 3 Comments

Lonmin PLC (LSE: LMI)
IN THE NEWS!
The shareholder approval of Lonmin’s rights issue on the 19th November resulted in a sharp mark-down in the share price when trading opened in London the next day. From the previous evening’s level of 9.85, it plunged to 1.50 on the opening, later edging down to 1.12 on the 25th November.
The company has re-negotiated its funding from a consortium of 10 banks for its existing facility of US$540m to US$370m due in 2020. As of September ’15, Lonmin had net debt of US$185m.
So what next?
From an Elliott Wave perspective, the additional decline that followed the rights issue has created an entirely different dynamic. It changes what was previously a three wave (counter-trend) pattern unfolding from the all-time-high of 4400.00 to the Sep.’15 low of 14.50 into a five wave (trend) expanding-impulse pattern – see fig #1. That translates into two ongoing aspects – first, it eliminates the possibility of trading into new record highs – second, following the completion of a counter-trend upswing, it will later crash down again, into oblivion.
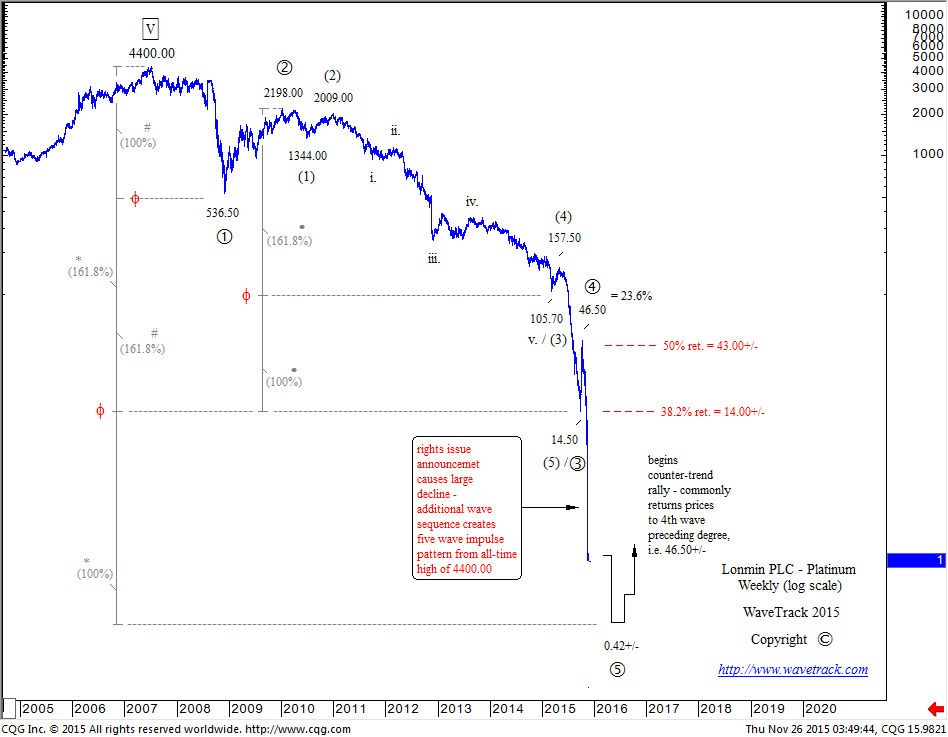
Lonmin – Platinum – Weekly
For the moment, basis Fibonacci-Price-Ratio (FPR) analysis, there is a risk that prices fall even further than they already have, meaning the five wave pattern remains incomplete. The next major support projects down to 0.42+/- pence, derived by extending primary waves 1-3 by a fib. 61.8% ratio.
Now that Pandora’s box has been opened, there are no guarantees, but upon a satisfactory completion of a five wave pattern, R.N.Elliott’s original postulation states that a counter-trend rally will follow and it will ultimately trade back towards ‘4th wave preceding degree’. This area is labeled primary wave 4 and it begins from the fib. 38.2% retracement level of 14.00+/- and extends to its approximate high at 43.00+/- which is the fib. 50% retracement level.
Successful with WaveTrack International
Our bi-weekly Elliott Wave Compass report features many short-term updates of various asset classes.
Subscribe to the EW-Compass here…
Argentina Merval Index – Buy the Rumour, Sell the Fact! (Elliott Wave analysis)
by m.tamosauskas| November 24, 2015 | No Comments
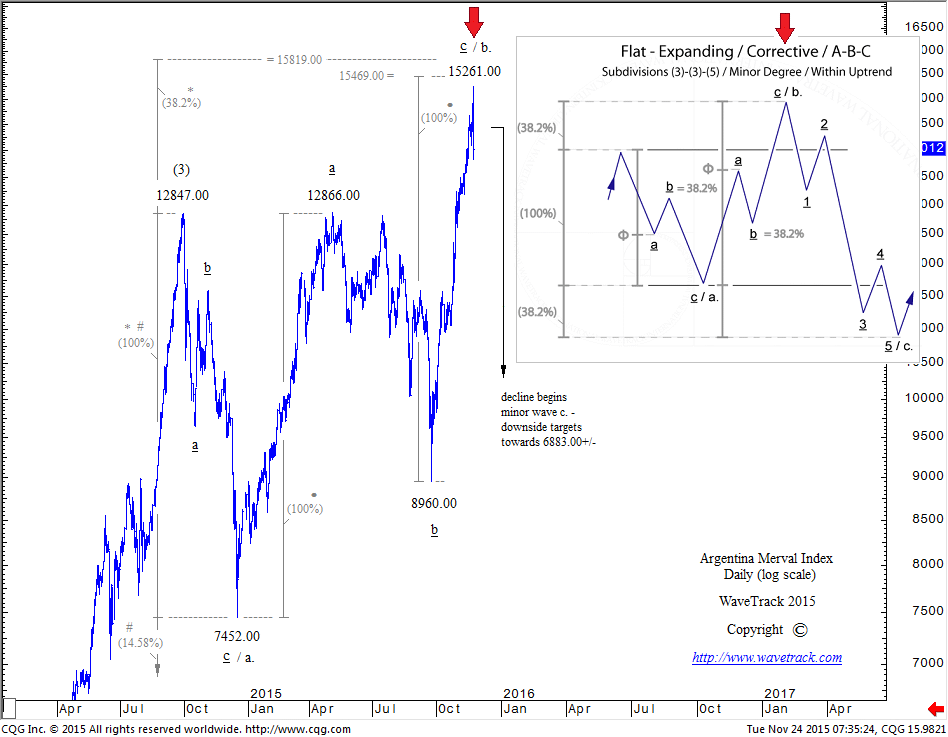
Yesterday’s news that confirmed Argentina’s centre-right wing party had won a slender majority in its latest elections might be the beginning of a long-term positive development for the country having been isolated from international funding since the left-wing party came to power in 2003.
The incumbent President Mauricio Macri had earmarked various changes to the monetary system including a ‘unified exchange rate’ and removing currency controls, bringing down the 20% per cent inflation rate, regaining access to international capital markets and reducing government spending that is currently at 40% GDP. The markets took cheer in his mandate – Argentina’s benchmark Bonar 24 dollar bonds rose 1.55% to 102.69 cents per dollar – corresponding yields fell from 8.61% per cent to 8.37% per cent.
Whilst this offers an optimistic ‘long-view’ outlook for Argentina, a look at the Merval index suggests otherwise – in fact, from an Elliott Wave perspective, it would seem that this is a classic set-up of ‘buy the rumour, sell the fact’.
The entire activity of the Merval index from the September ’14 high of 12847.00 has all the characteristics of a developing expanding flat corrective pattern – see fig #1. The pattern is composed of three main price-swings, labelled a-b-c and assigned in minor degree as intermediate wave (4). Minor wave a. establishes the initial ‘price-extremity’ of the pattern between 12847.00 and 7452.00 whilst waves b. and c. must ultimately trade slightly beyond these levels – see tutorial inset chart. The pattern is also required to subdivide into a 3-3-5 sequence – minor wave a. fulfils this criteria by unfolding into a 3-wave zig zag. Minor wave b. has just done the same, advancing from 7452.00 into Monday’s election high at 15261.00.
The zig zag advance for minor wave b. has also unfolded where minute waves a & c measure equally, by a fib. 100% correlative ratio. This adds to its integrity. Furthermore, it has completed above wave a. close to and within the fib. 38.2% extension level of wave a. – another criteria satisfied.
Monday’s higher high and lower low closing also triggers a technical ‘key-reversal’ sell-signal. If further downside occurs during the next week or so, and reintegration follows below the dual peaks of 12847.00 and 12866.00, then minor wave c. declines will become a high-probability reality with ultimate downside targets to 6883.00+/- during the next several months.
Mauricio Macri has admitted that he is in no position to determine what condition Argentina’s financials are in…‘To know what we are inheriting, we have to be there [in power] – we still don’t really know’.
Tags: Argentina > election 2015 > Merval > politic > stocks
US Dollar in Peril? – FXStreet Interview
by WaveTrack International| November 12, 2015 | No Comments

FXStreet Interview the reknown Dale Pinkert from FXStreet
In this exciting interview with Dale Pinkert – a Former Member of the Chicago Mercantile Exchange whose market forecasts have been aired on Financial Television and Radio station including CNBC Peter Goodburn elaborates his views on Elliott Wave, muses with Dale on the cyclicity behind historical market events and the US Dollar. Listen to this amazingly insightful interview here:
Thank you FXStreet and Dale Pinkert!
Don’t forget – our bi-weekly Elliott Wave Compass report features many short-term updates of various asset classes.
Successful trading with WaveTrack International
Subscribe to the EW-Compass here…
Tags: USD

Recent Posts
Recent Comments
Archives
- August 2026
- July 2026
- June 2026
- February 2026
- December 2025
- August 2025
- July 2025
- June 2025
- March 2025
- February 2025
- January 2025
- December 2024
- August 2024
- July 2024
- June 2024
- May 2024
- April 2024
- February 2024
- January 2024
- December 2023
- August 2023
- July 2023
- June 2023
- March 2023
- February 2023
- January 2023
- December 2022
- November 2022
- October 2022
- August 2022
- July 2022
- June 2022
- May 2022
- March 2022
- February 2022
- January 2022
- December 2021
- August 2021
- July 2021
- June 2021
- March 2021
- February 2021
- January 2021
- December 2020
- November 2020
- August 2020
- July 2020
- June 2020
- May 2020
- April 2020
- March 2020
- February 2020
- January 2020
- December 2019
- October 2019
- September 2019
- July 2019
- June 2019
- May 2019
- April 2019
- March 2019
- February 2019
- January 2019
- December 2018
- November 2018
- September 2018
- August 2018
- July 2018
- June 2018
- May 2018
- April 2018
- March 2018
- February 2018
- January 2018
- December 2017
- November 2017
- October 2017
- September 2017
- August 2017
- July 2017
- June 2017
- May 2017
- March 2017
- February 2017
- January 2017
- December 2016
- November 2016
- October 2016
- September 2016
- August 2016
- July 2016
- June 2016
- May 2016
- April 2016
- March 2016
- February 2016
- January 2016
- December 2015
- November 2015
- October 2015
- September 2015
- August 2015
- July 2015
- June 2015
- May 2015
- April 2015
- March 2015
- February 2015
- January 2015
- December 2014
- November 2014
- October 2014
- September 2014
- August 2014
- July 2014
- June 2014
- May 2014
- April 2014
- March 2014
- February 2014
- January 2014
- December 2013
- November 2013
- October 2013
- September 2013
- August 2013
- July 2013
- June 2013
- May 2013
- April 2013
- March 2013
- February 2013
- January 2013
- December 2012
- November 2012
- October 2012
- September 2012
- August 2012
Categories
- ADXY Index
- Agnico Eagle Mines
- AI Artificial Intelligence
- Alcoa
- Amazon
- AngloGold Ashanti
- Antofagasta
- APPL
- Apple
- ASX 200
- AUD vs USD
- AUD/YEN
- AUDNZD
- AUDUSD
- Australia ASX 200
- Baltic Dry Index
- Banking
- Base Metals
- Biotechnology
- Bitcoin
- Bovespa
- Broadcom
- Campanhia Siderugica
- Catalexit
- central banks
- CHF/Yen
- Christmas
- Commodities
- Commodities Video Outlook
- Commodities Video Outlook 2020
- Conference
- Copper
- Coronavirus Sell-Off
- CRB
- Crude oil
- crude oil price chart
- CryptoCurrency
- Currencies
- Currencies + Interest Rates Video Outlook
- Cycles
- Dax 30
- deutsche bank
- Dewey Cycle
- DJ Transportation Average
- DJ Utilities
- Dow Jones 30
- Dow Theory
- ECB
- economy
- Elliott Wave
- Elliott Wave Charts
- Elliott Wave Patterns
- Elliott Wave Principle
- Emerging Markets
- Ending-Diagonal Elliott Wave Pattern
- Equity
- EUR vs CHF
- EUR/CHF
- EUR/USD
- Euro / US$
- Eurostoxx 50
- EuroStoxx50
- EuroStoxxBanks
- EURUSD
- Expanding Flat Pattern
- FAAMG
- FANG+
- fib-price-ratio
- Fibonacci Trading
- Fibonacci-Price-Ratio
- Financial Forecasting
- Fixed Income
- forex
- Fortescu Metals
- Freeport McMoran
- FTSE 100
- Fund Management
- FX
- FXStreet
- GBP/AUD
- GBP/USD
- GDX
- GDXJ
- Gerdau Steel
- Germany 10 year Euro Bund future
- Gilead Sciences
- Glencore
- Global Economy
- Gold
- Gold Mining
- Golden Ratio
- goldman sachs
- Google Inc.
- Google/Alphabeth
- Greek debt crisis
- Hang Seng
- Harbinger
- Hungarian Forint
- IBEX 35 Index Spain
- Independent Research
- India-CNX Nifty 50
- Interest Rates
- Interview
- IRP Independent Research
- kbw bank index
- Lonmin
- MAG-7
- McDonald's
- MID-YEAR VIDEO UPDATE!
- Mifid II
- Mines
- Mining
- MSCI China
- MSCI Emerging Markets
- Nasdaq 100
- Nasdaq Biotechnology Index
- Nasdaq Composite
- Nasdaq100
- Netflix
- Newmont Mining
- Nikkei 225
- NVIDIA
- NYSE Composite Index
- Palladium
- Platinum
- Precious Metals
- Ralph Nelson Elliott
- Reversal-Signature
- Russell 2000
- Russia RTS
- S&P 500
- Sector
- Secular-Bull
- Sentiment Survey
- Shanghai Composite Index
- Silver
- Slanting Flat Elliott Wave Pattern
- SP100
- SP400 Mid-Cap
- SP500
- SPX 500
- STLG/AUD
- Stlg/US$
- STLG/USD
- STLG/YEN
- STLG/ZAR
- Stock Index
- Stock Index Tracking
- Stock Index Video
- Stock Indices
- Stock Indices Video Outlook 2023
- Stock Indices Video Outlook 2025
- Sugar
- Summary
- Tesla
- Tesla Inc
- Toyota
- Track Record
- trading
- Trusts
- Tutorial
- Uncategorized
- UniCredit
- US
- US Dollar Index (DXY) (USDX)
- US$ Index
- US-Dollar Index
- US10yrYields
- USD
- USD/ARS
- USD/CNY
- USD/IDR
- USD/INR
- USD/MXN
- USD/NOK
- USD/SEK
- USD/SGD
- USD/THB
- USD/YEN
- USD/ZAR
- Vale
- Value Line Index
- video
- VIDEO OUTLOOK 2018
- VIDEO OUTLOOK 2020
- VIX
- W.D. Gann
- WaveTrack International
- XAU Gold/Silver Index
- Xetra Dax
- XOP
- Yields
- Zig Zag
- Zinc
- ‘INFLATION-POP’
- ‘SHOCK-POP-DROP’