Currencies and Interest Rates Video Outlook 2024
by WaveTrack International| February 28, 2024 | No Comments
We’re pleased to announce the publication of WaveTrack’s annual Triple Video Mid-Year Update 2023 of medium-term ELLIOTT WAVE price-forecasts. Today’s release is PART III, CURRENCIES and INTEREST RATES.
• PART I – STOCK INDICES – out now!
• PART II – COMMODITIES – out now!
• PART III – CURRENCIES & INTEREST RATES – out now!
Now, let’s look at some of the Currencies and Interest Rates Mid-Year Video Highlights that are crucial to know during this economic timeline…
Highlights
…
Currencies and Interest Rates Preview
Are you ready for what’s next in the financial world? Our latest analysis reveals critical trends shaping the markets:
Higher Rates for Longer: Despite expectations of an end to interest rate hikes, countries like Japan, the U.K., and Germany are already in recession. Are we heading for a global slowdown? Discover the surprising truth in fig’s #186-187.
Recession Risks Looming: The U.S. yield curve inversion spells trouble, historically signaling a recession within 15 months. With 66% of fund managers expecting a ‘soft-landing’, are they right? Dive into the data in fig’s #188-189.
Commercial Real Estate (CRE) Concerns: $117bn in U.S. CRE refinancing this year alone, and European banks facing €1.4 trillion Euros in refinancing needs. Could this lead to another banking crisis? Find out more in fig #191.
Second Regional Banking Crisis: After 2022/23’s bank failures, signs point to more trouble. Banks like Deutsche Bank are raising provisions, signaling potential defaults. Learn about the risks in fig’s #192-193.
U.S. Debt Soars: With U.S. debt hitting $34.15 trillion, higher rates mean higher costs. Could this lead to a decline in the US$ dollar? Explore the implications in fig #194.
De-Dollarisation Trends: Global economies hold fewer US$ reserves, opting for partner currencies. Is the US$ losing its stronghold? Discover the potential impact in fig #195.
Currency Trends Unveiled: From G10 pairs to currency crosses, our analysis predicts major movements. See what’s ahead for Euro/US$, Stlg/US$, US$/CHF, and more in fig’s #196-238.
Fig #202 – USD Index – Daily – by WaveTrack International – Currencies and Interest Rates Video Outlook 2024
Unlocking Financial Insights: What’s Ahead for Interest Rates?
The 60-Year Cycle Unveiled: Corporate AAA Bond Yields hit a turning point in 2011, marking the start of a new 30+ year uptrend for interest rates. Despite COVID-19 disruptions, March ’20 lows confirm this upward trajectory. Discover more in fig’s #288-289.
Inflation Trends and Contrarian Risks: Real Interest Rates remain negative, even with central bank hikes. Bank of America’s survey reveals a record 91% expecting lower short-term rates, highlighting the contrarian risk of rising rates this year. Explore insights in fig’s #290-294.
U.S. Debt at Record Highs: With U.S. debt soaring to $34.15 trillion, higher rates will impact financing. A credit crunch looms, potentially spiking long-dated treasury yields to post-pandemic highs. Get details in fig’s #295-296.
US Interest Rates Outlook: Federal Funds rate nears its peak, poised to remain ‘higher-for-longer’ due to CPI upticks and risks like CRE and bank deposit runs. Are US30yr and US10yr yields set for more highs? Dive into the analysis in fig’s #297-307.
Figures refer to data points in our analysis.
Ready to unlock a whole new dimension of financial insights? 📈 We’re thrilled to invite you to the next chapter of our financial journey through an exciting video experience.
What Awaits You?
Get ready to gain a fresh perspective, delivered right to your screen. Prepare for enlightening discussions, visual breakdowns, and the latest market insights based on Elliott Wave, Fibonacci-Price Ratio’s and Cycle work – all in one place.
Most sincerely,
Peter Goodburn
Founder and Chief Elliott Wave Analyst
WaveTrack International
What you get
Contents: 156 charts | VIDEO DURATION: nearly 3 hours 4 mins.
The contents of this CURRENCIES & INTEREST RATES VIDEO include Elliott Wave analysis for:
Forex (99 charts):
• US FED Rate & PCE Inflation
• US Yield Curve
• CRE Commercial Real Estate
• US Treasury Fiscal Data
• US$ Index + Cycles
• USD COT
• Euro/US$
• EUR COT
• Stlg/US$
• STLG COT
• US$/Yen
• YEN COT
• CHF COT
• US$/CHF
• US$/NOK
• US$/SEK
• AUD/US$
• AUD COT
• US$/CAD
• CAD COT
• NZD/US$
• NZD COT
• Euro/Stlg
• Euro/CHF
• Euro/Yen
• EUR/AUD
• Stlg/AUD
• CAD/NOK
• USD/BRL
• USD/RUB
• US$/ZAR
• US$/MXN
• USD/ILS
• US$/TRY
• Asian ADXY
• US$/Renminbi
• US$/KRW
• US$/SGD
• US$/INR
• US$/TWD
• USD/THB
• US$/MYR
• US$/IDR
• US$/PHP
• Bitcoin
• Ethereum
Interest Rates (57 charts):
• US10yr Real Yield
• US TIPs
• US30yr Yield
• US10yr Yield + Cycle
• US2yr Yield
• US2yr-10yr Yield Spread
• US10yr-30yr Yield Spread
• US10-DE10yr Yield Spread
• DE10yr Yield
• DE2yr Yield
• UK10yr Yield
• ITY10yr Yield
• Italy10-DE10yr Yield Spread
• Australia 10yr Yield
• Canada 10yr Yield
• Japan 10yr Yield
How to buy the Currencies and Interest Rates Video Outlook 2024
Simply click on this PayPal Payment link to purchase the CURRENCIES + INTEREST RATES Video Outlook 2024 for USD 49.00 (+ VAT where applicable) or alternatively our Triple Video Offer for USD 99.00 (+ VAT where applicable) – Review the content of WaveTrack Stock Indices Video PART I here and the Commodities Video PART II here.
If you prefer to pay via a secure Credit Card payment link please contact us @ services@wavetrack.com ! Many thanks.
*(additional VAT may be added depending on your country – currently US, Canada, Asia have no added VAT but most European countries do)
We’re sure you’ll reap the benefits – don’t forget to contact us with any Elliott Wave questions – Peter is always keen to hear you views, queries and comments.
Visit us @ www.wavetrack.com
Tags: Currencies and Interest Rates Video Outlook
Commodities Outlook 2024 Video is now available!
by WaveTrack International| January 24, 2024 | No Comments
Commodities Video Outlook 2024
We’re pleased to announce the publication of WaveTrack’s annual Triple Video Outlook 2024 of medium-term ELLIOTT WAVE price-forecasts. Today’s release is PART II, COMMODITIES – Part I was released last month and Part III will be published in late-February / beginning of March 2024…
• PART I – STOCK INDICES – out now!
• PART II – COMMODITIES – out now!
• PART III – CURRENCIES & INTEREST RATES – coming soon!
Commodities Forecast Highlights 2024!
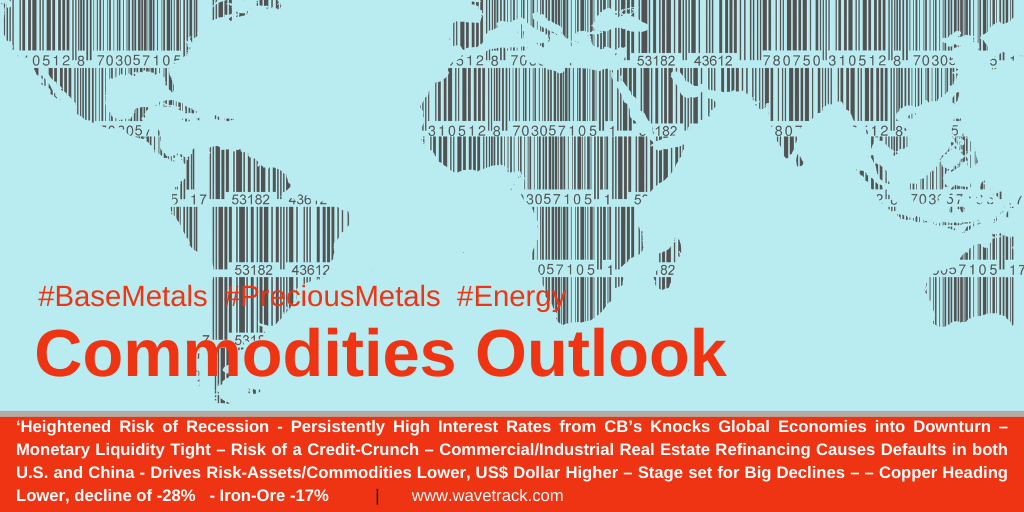
Commodities – Head and Tail Winds for 2024
In the ever-evolving landscape, our 2024 analysis begins by scrutinizing the main drivers shaping COMMODITY prices. Uncover potential headwinds, including the impact of prolonged higher interest rates, a looming commercial real estate refinancing wave exceeding $117 billion, and the repercussions of China’s economic stagnation linked to property sector loan backlogs. A silver lining emerges with a declining dollar, offering introspective opportunities, particularly for precious metals.
Venture into our analysis on Commodity vs. Equity valuations, addressing the pertinent question of undervalued commodities or overinflated equity valuations—or perhaps both!
Fig #1 – Ratio Chart: CRB Index / SP500 – by WaveTrack International Commodities Outlook 2024!
Anticipating Market Movements: A Glimpse into the Future
Our unique perspective on the evolution of commodity prices from the financial-crisis lows reveals a divergence from the ELLIOTT WAVE pattern within the SECULAR-BULL uptrend for global STOCK MARKETS. The birth of the term INFLATION-POP signals a cycle driving inflation to levels not seen since the 1970s, presenting an unprecedented opportunity for traders in the 21st century.
For those with memories of the late-1970s inflation surge, the current scenario seems like a cyclical repetition, offering a degree of predictability. Despite commodities surging post-pandemic, the past 18-24 months have witnessed corrections within the upward cycle. Brace yourselves for potential downside pressure this year. Now, setting the stage for a resilient bottom and another significant price rise into 2025/27.
Commodities Video Outlook 2024
With this new Commodities video you will review over 87 individual commodity contracts and Fibonacci Price Ratios within three main sub-sectors, Base Metals, Precious Metals, Precious and Base Metal Miners and Energy.
Don’t miss your chance to access this premium content, meticulously crafted to empower traders like you. Join us as we unveil the latest trends, strategies, and market analyses that will shape your success in the dynamic world of commodities.
Sincerely,
Peter Goodburn & EW-team
Commodities Video Outlook 2024 Part II/III
Contents: 87 charts
Time: 2 hours 13 mins.
• FED, Interest Rate, Inflation charts
• US 10yr Yield Cycle
• Commercial Real Estate Collapse
• US Dollar index + Cycles
• CRB-Cash index + Cycles
• Food and Agriculture Index
• DB PowerShares Agriculture Fund
• Copper
• Aluminium
• Lead
• Zinc
• XME Metals & Mining Index
• BHP-Billiton
• Freeport McMoran
• Antofagasta
• Anglo American
• Glencore
• Rio Tinto
• Vale
• Iron Ore
• Uranium
• Rare Earths
• Gold
• Gold-Silver Ratio
• Silver
• Platinum/Silver Ratio
• Platinum
• Palladium/SP500 Ratio
• Palladium/Gold Ratio
• Palladium/Platinum Ratio
• Palladium
• GDX Gold Miners Index
• Newmont Mining
• Amer Barrick Gold
• Agnico Eagle Mines
• AngloGold Ashanti
• XAU Gold/Silver Index
• Crude Oil
• Brent Oil
• Gasoline RBOB
• Natural Gas
• TTF Natural Gas
• XLE Energy SPDR
• XOP Oil and Gas Index
How can you purchase the video?
1. Single Commodities Video! Simply click on this PayPal payment link for the Commodities Video Outlook 2024 for USD 49.00 (for non-EU clients). Please note that it can take up to 6 hours until you receive this video.
2. Triple Video! Simply click on this PayPal payment link for the Triple Video Outlook 2024 for USD 99.00 (for non-EU clients). This covers Stock Indices, Commodities and Currencies + Interest Rates. Please note that it can take up to 6 hours until you receive this video.
3. Additionally, we now offer as well payment via credit card payment link – For the credit card payment option please Contact us @ services@wavetrack.com and state if you like to purchase the Commodities Single video for USD 49.00 + VAT* or the Triple Video for USD 99.00 +VAT*?. Thank you.
*(additional VAT may be added depending on your country – currently US, Canada, Asia have no added VAT but most European countries do)
We’re sure you’ll reap the benefits – don’t forget to contact us with any Elliott Wave questions – Peter is always keen to hear you views, queries and comments.
Visit us @ www.wavetrack.com
We’re sure you’ll reap the benefits. Don’t forget to contact us with any Elliott Wave questions. Our EW-team is always keen to hear your views, queries, and comments.
Visit us @ www.wavetrack.com
Stock Indices Video Outlook 2024 – PART I/III
by WaveTrack International| December 30, 2023 | No Comments

Stock Indices Video Outlook 2024
Recession Alert! – Heightened Risk of a Hard Landing in 2024!!
FANG+ & Mag-7 Slide Lower in 2024
Highlights 2024
TAIL RISK IN 2024!!
A yield curve inversion almost always occurs before a recession although its effects can begin up to 15 months later. The more recent inversion began in July ’22. And we’re now 17 months later. This is clearly highlighting the probability a recession is just ahead. Bank of America analysts show the S&P 500 begins a decline of up to -40% once the curve begins to steepen again.
The decline accelerates as the Federal Reserve begins to tighten credit and the market collapses following the first rate cut. It then forms a trough/low 9 months later. This synopsis tallies with our bearish Elliott Wave outlook for the S&P 500 for the coming year, 2024. We’re expecting a decline of -38% per cent. Contrastingly, Goldman Sachs forecasts a limited risk of recession with a year-end target of 4700.00+/- (-2%), Deutsche Bank a mild recession, 5100.00+/- (+8%), JP Morgan a risk of recession, 4200.00+/- (-12%) and Societe Generale a mild recession, 4750.00+/- (-1%).
However, the U.S. Banking sector is particularly vulnerable to a strong downturn should interest rates remain higher-for-longer with commercial real estate defaults likely to accelerate.
SPOTLIGHT – Technology!
This is a must have video for those who invested in the Magnificent 7 Stocks! We believe that Fang+ Technology are particularly vulnerable to Tail-Risk factor mentioned above. Moreover, there will be large counter-trend declines for Amazon Inc., Alphabet/Google, Apple Inc., Meta/Facebook, Microsoft, Netflix, Nvidia & Tesla. Get our latest video and be prepared.
New Stock Indices Video Outlook 2024 – PART I/III
The central themes we’ll be discussing in this video include Interest Rate trends and expectations, inflation and what happens should Central Banks keep interest rates higher-for-longer.
We’re examining clues in the last year’s yield curve inversion and later. Moreover, systemic financial credit risks showing-up in the U.S. and European banking sector.
We’re taking an updated look at the final stage of the inflation-pop cycle which is propelling stock indices higher from the pandemic lows. Many are unfolding into ending-type diagonal patterns but are missing the required 2nd wave downside sell-offs that only partially materialised in 2022. 2023’s rallies are unlikely to be sustained. European indices staged relative outperformance since lows in September 2022 but are also expected to generate big declines during the next year ahead of resuming higher afterwards.
MSCI China and the Emerging Market index are both looking positive. At the very least, these outperform Developed Market indices in 2024.
This STOCK INDICES Video Outlook 2024 is like nothing you’ve seen anywhere else in the world. It’s unique to WaveTrack International, how we foresee trends developing through the lens of Elliott Wave Principle (EWP) and how its forecasts correlate with Fibonacci Price Ratios, Sentiment extremes and Economic data trends.
We invite you to take this next step in our financial journey with us – video subscription details are below – just follow the links and we’ll see you soon!
Most sincerely,
Peter Goodburn
Founder and Chief Elliott Wave Analyst
WaveTrack International
Contents Stock Indices Video Outlook 2024
Charts: 97 | Video: 2 hours 29 mins.
CONTACT US NOW VIA EMAIL – SELECT YOUR PACKAGE
Single Video – *$49.00 – PART I Stock Index Video Outlook 2024 (December ’23) or send us an email to services@wavetrack.com
Triple Package offer – *$99.00 (saving 33%)! – PART I – PART II – PART III (January – February ’24)
*(additional VAT may be added depending on your country – currently US, Canada, Asia have no added VAT but most European countries do)
PARTS II & III will be available in a few weeks’ time – we’re working on it!
HOW CAN YOU RECEIVE THE VIDEO FORECAST?
To receive your VIDEO UPDATE please use this instant PayPal payment link for US, UK, Australian and international customer except EU customers click here.
– Alternatively, if you like to pay via credit card, we are very happy to send you a credit card payment link – contact us via email to services@wavetrack.com/
– Or opt for the TRIPLE PACKAGE for USD *99.00 in total?
– As soon as we receive payment either via the instant PayPal payment link or via the credit card link we provide you with the video link & PDF report once payment is confirmed. Please know the reply can take up to 6 hours. But rest assured we will give our best to provide you with the information as soon as possible!
*(additional VAT may be added depending on your country of residence. Currently, the US, Canada, Asia have no added VAT except EU countries)
We’re sure you’ll reap the benefits – don’t forget to contact us with any Elliott Wave questions – Peter is always keen to hear your views, queries, and comments.
Visit us @ www.wavetrack.com
Tags: 2024 Financial Outlook
New EW-Commodities Outlook
by WaveTrack International| August 29, 2023 | No Comments
EW-Commodities Outlook Highlights
EW-Commodities Outlook Major Themes for September 2023
Following-on from our PART II mid-year Commodities report, this month’s update continues with some of the central themes surrounding the macro economy and how that may affect prices going forward. From an Elliott Wave perspective, we will discuss three major risks…
Heightened Risk of Global Recession
This includes a heightened risk of a global recession, caused by central banks’ maintaining their current interest rate cycle. The theme is ‘higher-for-longer’. A withdrawal of liquidity as the Federal Reserve together with other Central Banks continue tightening.
Risk of Banking Crisis
Furthermore, there’s also an increasing risk that a 2nd phase of last March’s U.S. regional banking crisis. The development contributes to a recession as bank’s balance sheets deteriorate with depositor withdrawals quickening.
Risk of Real Estate Crisis
And a new risk of defaults in the property sector arises as major Real Estate Investment Trusts offer little in the way of dividends whilst China’s property developer giants seek U.S. Bankruptcy protection.
In short, without doubt, a global recession means Commodities would take another hit to the downside.
Subscribe to the latest EW-Commodities Outlook report and get trading insights and much more… Note the EW-Commodities Outlook includes a report and video update!
Currencies and Interest Rates Mid-Year Video Update 2023
by WaveTrack International| August 14, 2023 | No Comments
We’re pleased to announce the publication of WaveTrack’s annual Triple Video Mid-Year Update 2023 of medium-term ELLIOTT WAVE price-forecasts. Today’s release is PART III, CURRENCIES and INTEREST RATES.
• PART I – STOCK INDICES – out now!
• PART II – COMMODITIES – out now!
• PART III – CURRENCIES & INTEREST RATES – out now!
Now, let’s look at some of the Currencies and Interest Rates Mid-Year Video Highlights that are crucial to know during this economic timeline…
Highlights
Currencies and Interest Rates Preview
Central Banks’ Interest Rates?
Despite lingering concerns about Central Banks’ persistent interest rate levels, we’ve got you covered. Our cutting-edge Elliott Wave forecasts will help you navigate the challenging landscape, even as CPI inflation takes a dip from last year’s highs.
G10 Currency Trends Unveiled
Get ready for a shift in G10 currency pairs over the upcoming months…
Yen and Swiss Franc Shine: Amidst the changes, the Yen and Swiss Franc might emerge as safer havens compared to the dollar.
🇪🇺🇺🇸 Euro/US$ Decline: The Euro/US$ pair is expected to weaken from its high at 1.1277 in July, targeting downside levels around 1.0208+/-.
🇬🇧🇺🇸 Stlg/US$ Journey: Brace for a decline in Stlg/US$ from 1.3143, with a target of 1.1662+/-.
🇺🇸🇳🇴 US$/NOK Reversal: Watch for a turnaround in the US$/NOK pair, climbing from its low of 9.9245 in July and aiming for 11.4022+/-.
G10 Currency Crosses Dynamics
🇪🇺🇬🇧 Euro/GBP Dip: Euro/GBP is continuing its decline from July’s high at 0.8702, aiming for 0.8309+/-.
🇪🇺🇨🇭 Euro/CHF Direction: Euro/CHF is projected to move lower, heading towards 0.8850+/-.
🇪🇺🇯🇵 Euro/Yen Patterns: Euro/Yen completes an upswing, but get ready for a downward trend in the coming weeks and months, reflecting Yen strength.
🇪🇺🇨🇳 Euro/CNY Movement: Euro/CNY’s corrective upswing from July ’22 to July ’23 is evident, marking a change in direction…
Review all the contracts WaveTrack covers in this extraordinary Elliott Wave forecasting masterpiece published only twice a year. Stay informed and empowered in the ever-evolving financial landscape.
PREVIEW: Fig #241 – AUD vs. YEN – Daily Forecast by WaveTrack International
Ready to unlock a whole new dimension of financial insights? 📈 We’re thrilled to invite you to the next chapter of our financial journey through an exciting video experience.
What Awaits You?
Get ready to gain a fresh perspective, delivered right to your screen. Prepare for enlightening discussions, visual breakdowns, and the latest market insights based on Elliott Wave, Fibonacci-Price Ratio’s and Cycle work – all in one place.
Most sincerely,
Peter Goodburn
Founder and Chief Elliott Wave Analyst
WaveTrack International
What you get
Contents: 147 charts | VIDEO DURATION: nearly 2 hours 54 mins.
The contents of this CURRENCIES & INTEREST RATES VIDEO include Elliott Wave analysis for:
Forex (94 charts):
• US Deposit Outflows
• US Bank Annual Balance Sheet Changes
• US$ Index + Cycles
• USD COT
• Euro/US$
• Stlg/US$
• US$/Yen
• US$/CHF
• US$/NOK
• US$/SEK
• AUD/US$
• US$/CAD
• NZD/US$
• Euro/Stlg
• Euro/CHF
• Euro/Yen
• Euro/CNY Renminbi
• Stlg/YEN
• Stlg/ZAR
• AUD/YEN
• AUD/CNY Renminbi
• AUD/NZD
• USD/BRL
• USD/RUB
• US$/ZAR
• US$/MXN
• US$/TRY
• US$/ARS
• US$/PLZ
• Asian ADXY
• US$/Renminbi
• US$/KRW
• US$/SGD
• US$/INR
• US$/TWD
• USD/THB
• US$/MYR
• US$/IDR
• US$/PHP
• Bitcoin
• Ethereum
Interest Rates (53 charts):
• US10yr Real Yield
• US30yr Yield + Cycles
• US10yr Yield + Cycles
• US5yr Yield
• US2yr Yield
• US2yr-10yr Yield Spread
• US10yr-30yr Yield Spread
• 3mth EuroDollar-US10yr Yield Spread
• Comparison US10-DE10yr vs S&P 500
• US10yr TIPS Break Even Inflation Rate
• US10-DE10yr Yield Spread
• DE10yr Yield
• UK10yr Yield
• ITY10yr Yield
• Italy10-DE10yr Yield Spread
• Australia 10yr Yield
• Japan 10yr Yield
How to buy the Forex + Bonds Video Outlook 2023
Simply contact us @ services@wavetrack.com to buy the CURRENCIES + INTEREST RATES Mid-Year Video Update 2023 for USD 49.00 (+ VAT where applicable) or alternatively our Triple Video Offer for USD 99.00 (+ VAT where applicable) – Review the content of WaveTrack Stock Indices Video PART I here and the Commodities Video PART II here.
Please state your payment preference in the order email – we offer PayPal or a secure Credit Card payment link! Many thanks.
*(additional VAT may be added depending on your country – currently US, Canada, Asia have no added VAT but most European countries do)
We’re sure you’ll reap the benefits – don’t forget to contact us with any Elliott Wave questions – Peter is always keen to hear you views, queries and comments.
Visit us @ www.wavetrack.com
New Commodities Mid-Year Video Update 2023
by WaveTrack International| July 14, 2023 | No Comments
We’re pleased to announce the publication of WaveTrack’s annual Triple Video Mid-Year Update 2023 of medium-term ELLIOTT WAVE price-forecasts. Today’s release is PART II, COMMODITIES – Part I was released last month and Part III will be published in late-July / beginning of August 2023…
• PART I – STOCK INDICES – out now!
• PART II – COMMODITIES – out now!
• PART III – CURRENCIES & INTEREST RATES – coming soon!
Now, let’s look at some of the Commodities Mid-Year Video Highlights that are crucial to know during this economic timeline…
Commodities Mid-Year Video Highlights 2023!
What WaveTrack’s is covering in its Commodities Mid-Year Video Update 2023
Commodities are set to continue 2022’s decline during the remaining period of 2023 and perhaps into Q1 2024. H1 ’23 gains are corrective with significant downside risk ahead. Central Banks are fighting a credibility battle having begun their monetary tightening and interest rate hiking cycle too late.
And now, in this late period of the cycle, CB’s are in danger of overreacting, continuing tighter policies through Q3 whilst triggering a recession. However, Commodities are amongst other risk assets decline, although in some areas like Base Metal Miners, outperformance in this next declines offers some defensive protection.
Inflation-Pop cycle spanning two decades from financial-crisis lows remains in upward trajectory although taking a pause since interim highs of 2022. Base Metals, Precious Metals and Energy undergoing corrective downswings during next several months with lows late-2023 or extending into Q1 ’24. FAO food prices continuing declines from April 2022 highs but as 4th wave correction. CRB index heading lower.
US$ dollar index’s long-term 16.25-year cycle in downtrend, but dollar strength expected soon, beginning a counter-trend upswing from 99.66-54+/- (currently 102.92) targeting 111.20+/- during next several months as safe-haven buying triggered due to declining commodity prices and other risk assets.
Base Metals
This Mid-Year video update will feature Copper, Aluminium, Lead, Zinc, Nickel and Tin.
WaveTrack is forecasting that Copper is set to continue lower in H2 despite as final stage of corrective 4th wave downswing that began from the May ‘21 high. Targets towards 5870+/-.
Aluminium continuing corrective primary wave B decline during next several months towards 1627+/-. Lead declining as intermediate wave (2) towards 1680+/-. Zinc approaching earlier downside target of 1983+/-. Nickel resuming primary wave X decline towards 14050+/- and Tin declining as intermediate wave (X) towards 18800+/-.
Base Metal Miners – Outperformers?
WaveTrack believes that Base Metal Miners are set for outperformance during underlying base metal decline during next several months.
However, XME Metals & Mining index underperforms as primary wave X, continuing correction from April ’22 high towards 28.98+/-.
In more detail WaveTrack will be highlighting if BHP is outperforming with perhaps limited downside towards 51.61+/-.
BHP Billiton Mid-Year Video Forecast by WaveTrack International
Yet, Antofagasta is expected to hold above current levels. Whilst Anglo American shows a downside risk of -24%. Even more risk for Freeport McMoran with a possible downside of -39%. Glencore’s 4th wave correction towards 336.00+/- (459.50), -26%. Rio Tinto’s 2nd wave correction lower, towards 4109.00+/-, down by -19%. Vale performance is not yet decided. It might be bullish above 11.71, and bearish below this level.
Strategic Metals
In this section we’ve included Iron Ore in this section even though it’s officially not a strategic metal. Iron Ore in 5th wave uptrend from Oct.’22 low of 80.00 but engaged in shorter-term corrective downswing.
Iron Ore – WaveTrack’s Elliott Wave forecast – Mid-Year Video Update for Commodities
WaveTrack will focus on covering Uranium, Global X Uranium (URA), Northshore (URNM), VanEck Rare Earth (ETF) and last but not least MP Materials (Rare Earth) Corp.
Futhermore, WaveTrack will cover Precious Metals, Precious Metal Miners and Energy – please review the table of content below for the complete overview of all the chart you get access to!
What makes WaveTrack’s Elliott Wave Forecasts successful?
Peter Goodburn, the founder of WaveTrack International has developed a unique combination of the Elliott Wave theory and Fibonacci price ratios to provide traders with a powerful tool set for analyzing the market. The Elliott Wave theory helps to identify the general trend of the market, while Fibonacci ratios pinpoint key areas of support and resistance.
Whilst our long-term clients are familiar with this approach, we like to go into it in a bit more detail for newcomers. For example, if a market is in an uptrend, traders can use the Elliott Wave theory to identify the five-wave pattern. Once the fifth wave is complete, traders can use Fibonacci ratios to identify key support levels for the market, where there is a high probability of a price reversal. These levels are known as retracements and are typically found at 23.6%, 38.2%, 50%, and 61.8% of the movement of the trend.
The unique combination of the Elliott Wave theory and Fibonacci price ratios is a powerful trading strategy that can help traders improve their trading performance. While this method may require some practice, once mastered, traders can leverage this strategy to make better-informed trading decisions and ultimately increase their profitability. Review this magical Fibonacci-Price Example featured here. Our bi-annual Video Series focus on medium- to longer-term trends and have the unique advantage that you will hear Peter Goodburn’s explanations. These insights are priceless for any trader using Elliott Wave and intending to improve his trading performance.
Commodities Mid-Year Video Update 2023
This video is Part II and we’ll be taking a look at over 90 individual commodity contracts and cycles within three main sub-sectors, Base Metals, Precious Metals, Precious and Base Metal Miners and Energy.
Whether you’re an experienced trader or just starting out, the Mid-Year Commodities Video report can help you make better trading decisions. It provides a clear and concise overview of market conditions and trends, allowing you to identify opportunities for profit and manage risk effectively.
So why wait? Invest in your trading success today. Join a bespoke group of traders who rely on WaveTrack International’s technical analysis expertise to navigate the markets and achieve their financial goals.
This is WaveTrack’s state of the art video –only available twice a year– if you are trading commodities this is a must have.
Sincerely,
Peter Goodburn & EW-team
Commodities Mid-Year Video Outlook 2023 Part II/III
Contents: 95 charts
Time: nearly 2 hours
• US M2 Money Supply
• US Loan Book
• US Annual Balance Sheet change
• US Deposit Outflows
• Banks Tightening Credit in Eurozone
• Food and Agriculture Index
• DB PowerShares Agriculture Fund
• US Dollar index + Cycles
• CRB-Cash index + Cycles
• US CPI Food and Energy
• Copper + Cycles
• Aluminium
• Lead
• Zinc
• Nickel
• Tin
• Iron Ore
• Uranium
• Rare Earths
• MP Materials Corp
• BHP-Billiton
• Freeport McMoran
• Antofagasta
• Anglo American
• Glencore
• Rio Tinto
• Vale
• Gold
• Gold-Silver Ratio
• Silver
• Platinum/Silver Ratio
• Platinum
• Palladium/Gold Ratio
• Palladium/Platinum Ratio
• Palladium
• GDX Gold Miners Index
• Newmont Mining
• Amer Barrick Gold
• Agnico Eagle Mines
• AngloGold Ashanti
• XAU Gold/Silver Index
• Fresnillo Silver
• Crude Oil + Cycles
• Brent Oil
• Gasoline RBOB
• Natural Gas
• TTF Natural Gas
• XLE Energy SPDR
• XOP Oil and Gas Index
How can you purchase the video?
1. Contact us @ services@wavetrack.com and ask for a PayPal payment link (please state if you like to purchase the Commodities Single video for USD 49.00 + VAT* or the Triple Video for USD 99.00 +VAT*?).
2. Additionally, we now offer as well payment via credit card payment link
*(additional VAT may be added depending on your country – currently US, Canada, Asia have no added VAT but most European countries do)
We’re sure you’ll reap the benefits – don’t forget to contact us with any Elliott Wave questions – Peter is always keen to hear you views, queries and comments.
Visit us @ www.wavetrack.com
We’re sure you’ll reap the benefits. Don’t forget to contact us with any Elliott Wave questions. Our EW-team is always keen to hear your views, queries, and comments.
Visit us @ www.wavetrack.com
New Stock Indices Mid-Year Video Update now available!
by WaveTrack International| June 23, 2023 | No Comments
Stock Indices Mid-Year Video Update 2023
Hightlights
Central Banks
Central Banks are still warning markets that the fight against inflation is ongoing. This determined approach is perpetuating their hawkish resolve. Yet, should interest rates remain elevated, there is little doubt that major stock indices will struggle to maintain this year’s advances. The deteriorating bank balance sheets caused by deposit withdrawals are expected to trigger a second banking crisis. Perfectly following this year’s earlier debacle. Furthermore, we believe that systemic financial credit risk provides the catalyst for a short but sharp recession in developed markets.
Banking Sector Risk
The biggest downside risk remains in the banking sector. February/March’s meltdown in U.S. regional banks is only the beginning of a more widespread contagion. Rapidly declining deposit withdrawals due to banks’ reluctance to pass on interest rate rises to customers will cause another round of balance sheet problems.
U.S. Sectors
U.S. Sectors show another period of Value (SVX) outperforming Growth (SGX) over the next several months, suggesting an overall stock index decline prompting defensive or safe-haven strategies. Banking sector weakest although declines expected in Dow Jones Transportation, XLF Financials, NBI Biotechnology, XLV Healthcare and XLY Consumer Discretionary.
Furthermore, we will discuss in detail why we believe that Continental European and Asian stock indices are expected to decline by double-digit percentages during the next several months. Stay informed about the latest market predictions and analysis with our Video Mid-Year report.
Quite a Year so far for Stock Indices!
This year’s stock market recovery from last September’s/October’s 2022 lows has overturned the extreme bearish sentiment that occurred eight months ago. Initial gains were met with derision as central banks continued their rate-hiking cycle which began in March ’22. With headline inflation surging higher in both the U.S. and Europe, central banks had little choice but to maintain aggressive monetary tightening.
Ordinarily, money supply constraints would be bearish for stock markets, but last year’s (2022’s) sell-off came as a surprise to markets and by the time prices bottomed last September/October, sentiment was so bearish, it held back expectations of a sustained recovery. In fact, this was reflected over the next several months in various investment bank fund manager surveys – as the months ticked by, large asset managers held onto high cash levels, reluctant to buy back into the market so soon after lightening-up on positioning during last year’s sell-off. Expectations of a recession dominated thinking as CB’s continued rate-hiking cycles.
Stock markets ignored the fundamentals, rising initially modestly, hesitantly, with the benchmark S&P 500 gaining +20% per cent by early-May ’23. Only in June have prices begun to accelerate, mainly because of improving sentiment over the introduction of Artificial Intelligence (AI) and ChatGPT technologies, especially reflected in a narrow band of big-tech stocks like Nvidia Corp.
We’re now in a situation where the AI frenzy has turned mainstream, pushing other index benchmarks higher, attracting those big asset fund managers to re-enter the market. The big question everyone’s asking is whether this is a sustainable uptrend that began from last September’s/October’s lows? Or are central banks going to trigger a recession? Persistently high interest rate levels could precipitate another banking crisis. This latest mid-year report attempts to answer those questions.
New Stock Indices Mid-Year Video Update 2023 – PART I/III
This exclusive Stock Indices Mid-Year Video Update from WaveTrack International is a rare gem that presents the future trends using an innovative approach based on the Elliott Wave Principle (EWP), in addition to the correlation between Cycles, Fib-Price-Ratios, Sentiment extremes, and Economic data trends.
You don’t want to miss out on this unique opportunity to expand your financial knowledge, and we’re thrilled to invite you to join us on this exciting journey. With our video subscription details listed below, you’re just a few moments away from gaining access to valuable insights that will enhance your investment strategy.
WaveTrack’s team of experts offers you unprecedented access to a comprehensive analysis of the stock market that cannot be found anywhere else.
Most sincerely,
Peter Goodburn
Founder and Chief Elliott Wave Analyst
WaveTrack International
Contents Stock Indices Mid-Year Video Update 2023
Charts: 91 | Video: 2 hours 30 mins.
CONTACT US NOW VIA EMAIL – SELECT YOUR PACKAGE
Single Video – *$49.00 – PART I Stock Index Mid-Year Video Update 2023 (June 2023) or send us an email to services@wavetrack.com
Triple Package offer – *$99.00 (saving 33%)! – PART I – PART II – PART III (June – August ’23)
*(additional VAT may be added depending on your country – currently US, Canada, Asia have no added VAT but most European countries do)
PARTS II & III will be available in a few weeks’ time – we’re working on it!
HOW CAN YOU GET THE VIDEO FORECAST?
To receive your VIDEO UPDATE please click here to contact us.
– Please state if you wish to purchase the SINGLE VIDEO – Stock Index Mid-Year Video Update 2023 for USD *49.00 and send us an email to services@wavetrack.com?
– Or opt for the TRIPLE PACKAGE for USD *99.00 in total?
– Next -depending on you preference- we will send you a credit card payment link (for this we need your name and address) or alternatively, a PayPal payment request and provide you with the video link & PDF report once payment is confirmed. Please know the reply can take up to 6 hours. But rest assured we will give our best to provide you with the information as soon as possible!
*(additional VAT may be added depending on your country of residence. Currently, the US, Canada, Asia have no added VAT but most European countries do)
We’re sure you’ll reap the benefits – don’t forget to contact us with any Elliott Wave questions – Peter is always keen to hear your views, queries, and comments.
Visit us @ www.wavetrack.com
EW-Commodities Outlook March 2023
by WaveTrack International| March 6, 2023 | No Comments
Commodities – Main Drivers for Prices are…
The main drivers for commodity prices are inflation, interest rates, the US$ dollar and the impact of the reopening of China’s economy.
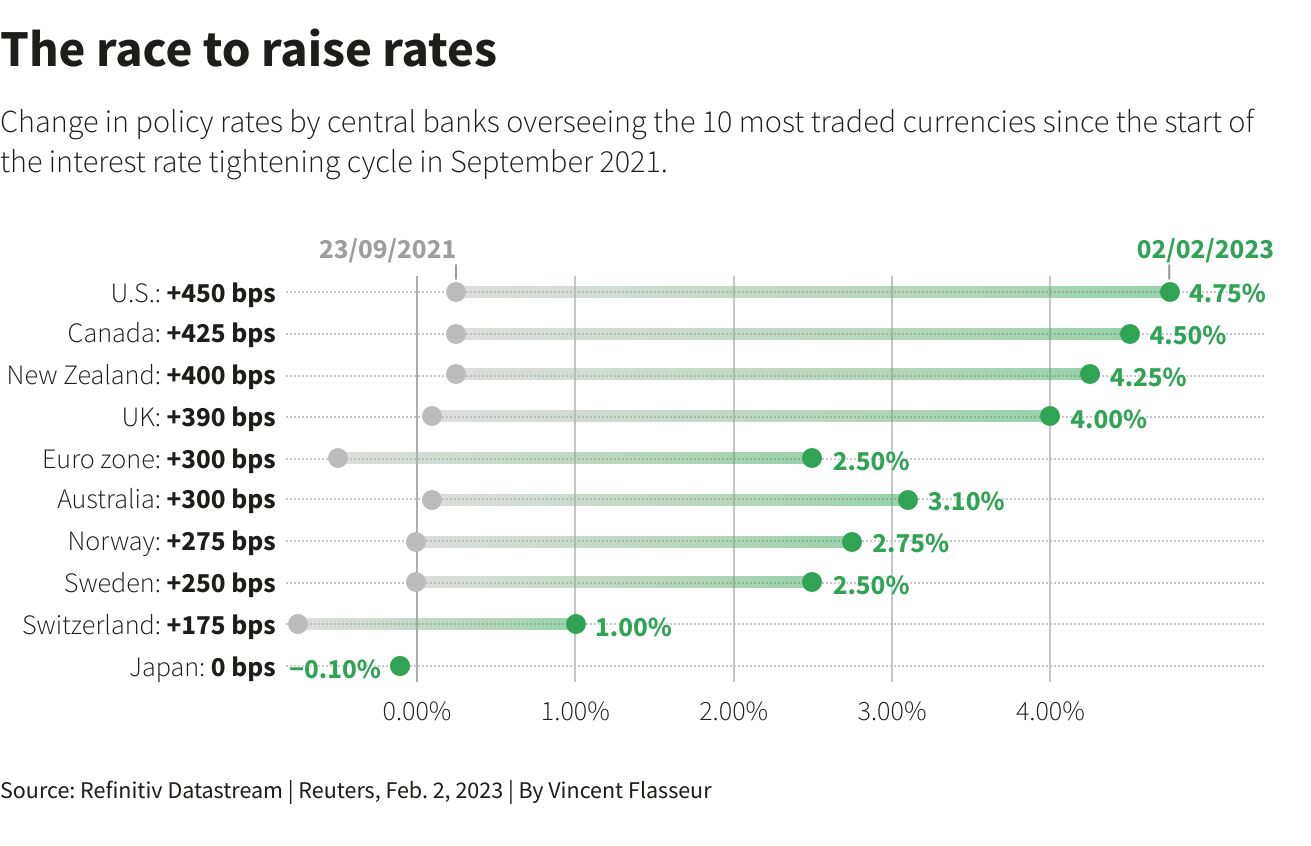
Fig #1 – The Race to Raise Interest Rates – Source: Refinitive
Central Banks have slowed the pace of interest rate hikes during the last couple of months basis declines in U.S. CPI from last June’s 9.10% peak – but a recent surge in U.S. employment numbers has shown that large corporations are managing the rise in interest rates far better than most expected.
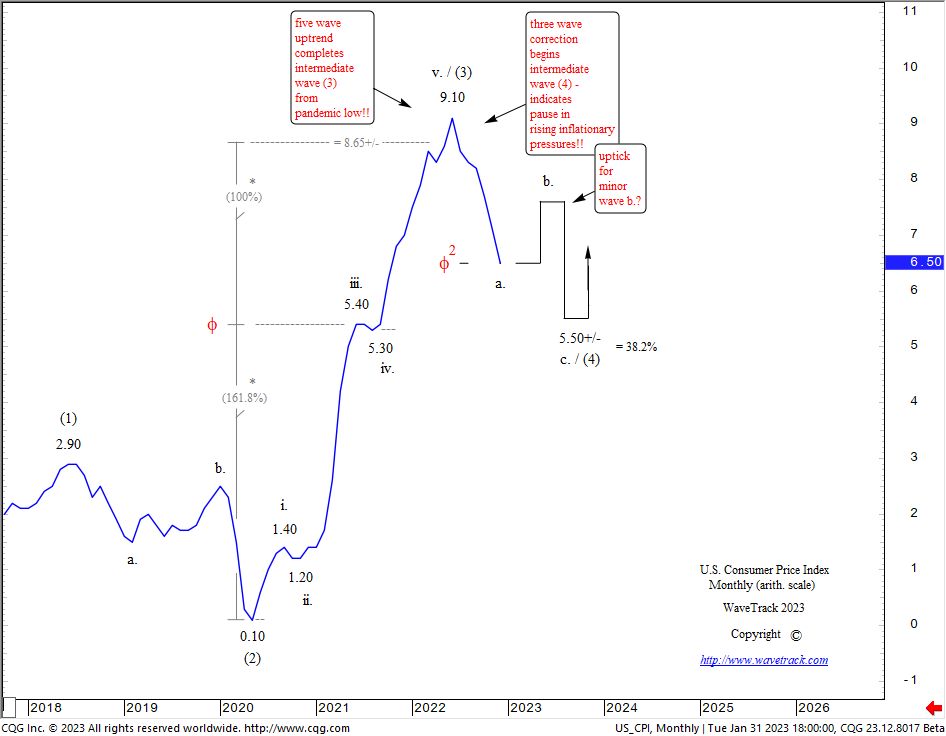
Fig #3 – US CPI – Monthly – Forecast by WaveTrack International
Regardless, Elliott Wave analysis expects an uptick in CPI and inflation expectations over the next few months before it turns down again later this year.
Government bond yields are trending higher again, although this wasn’t expected by consensus opinion earlier this year where a peak in inflation and a mild recession was mainstream – that’s changing too – the Fed’s mantra ‘Higher Rates for Longer’ is taking hold and this is one aspect that is expected to weigh heavily on Commodity Prices during the next several months.
The effects of a recession in western economies is not without risk – in fact, we’re expecting a short but sharp recession this year – and that’s despite the markets’ expectation of a reopening of China’s economy following three years of lockdown.
US$ Dollar
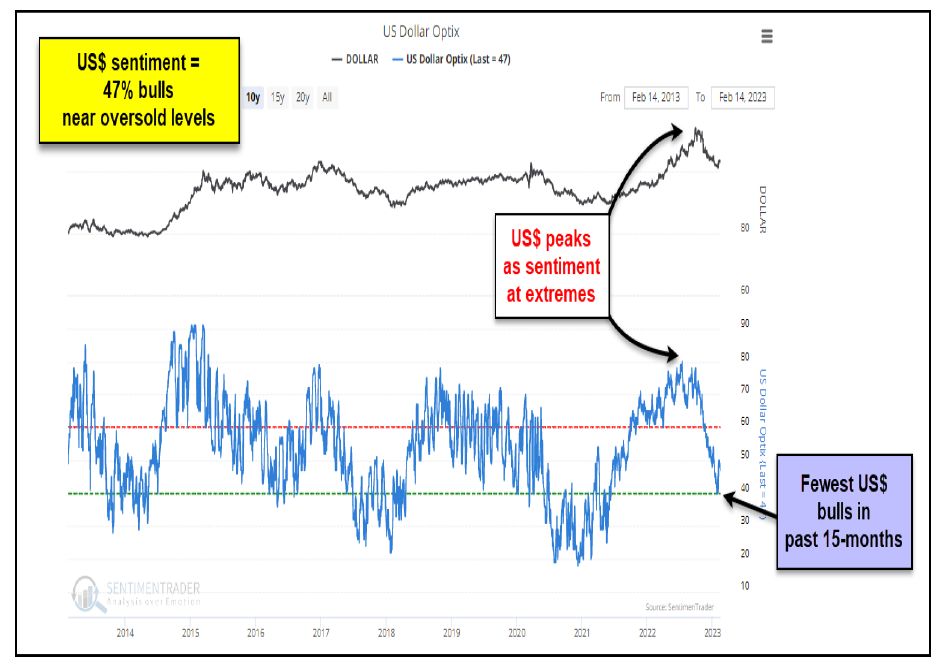
Fig #7 – Kimble Technical US Dollar Positioning – Source: Kimble
The US$ Dollar’s extreme long-positioning towards the end of last year has been completely reversed over the last 5 months – if anything, there are early signs of it being oversold although there’s a risk during March of one more decline before a multi-month upside correction begins. The dollar’s movements are more critical for precious metals as this month’s analysis shows.
CRB Index
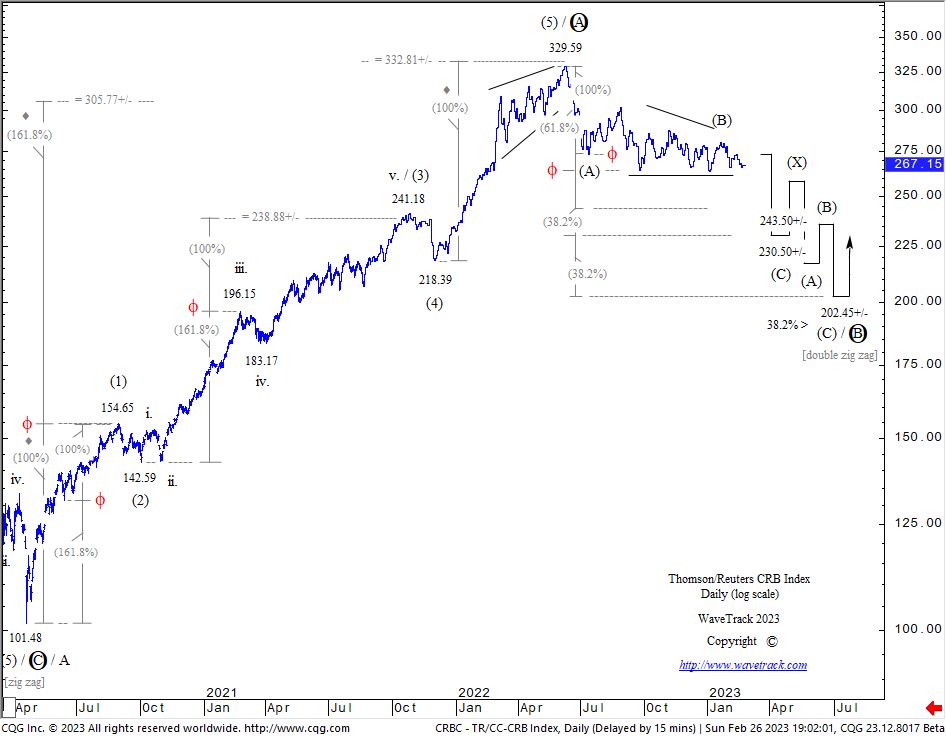
Fig #11 – Thompson/Reuters CRB Index – Daily – by WaveTrack International
The CRB Reuters-Jefferies index is set to continue its counter-trend decline that began from the June ’22 high of 329.59 later this month, maybe delayed into early-April although a postponement is more reflected in the way energy contracts are continuing to range trade whilst precious metals begin their next advance.
Base Metals
Base Metals can benefit from a short-term dollar decline this month, but overall, are expected lower during the next several months, including Copper and Aluminium. Energy markets like Crude and Brent oil are in transitory correction patterns since December’s lows – they can finish by month-end, but the direction is still lower, progressing last year’s counter-trend declines that began from the March ’22 highs.
Watch the latest amazing EW-Commodities video and get more insights about s trading opportunities in our latest EW-Commodities Outlook report and video update!
New Currencies + Interest Rate Video Outlook 2023
by WaveTrack International| February 25, 2023 | No Comments
Currencies and Interest Rate Video Outlook 2023
Inflation Ticks Higher before Resuming Lower – Short but Sharp Recession for 2023
Currencies and Interest Rates Highlights
Yield Inversion Normalises into Steeper Trajectory
Bank of Japan Raise JGB Limit
Outlook Preview Currencies
• Central Banks (CBs) have overestimated the impact from 6-month declines in headline Consumer Price Index (CPI) prices – whilst CB’s are still maintaining their interest rate-hiking cycles, they’ve slowed the pace as they approach perceived ceilings – market participants have expected a Fed-Pivot but this is unlikely right now – Elliott Wave analysis expects further interest rate rises through Q1/2 ’23 before a collapse lower afterwards as risk-assets sell-off triggering a short but sharp recession for 2023.
• The long-term outlook for the US$ dollar index remains very bearish – the year-1985 decline from record highs of 164.72 began a cycle degree A-B-C zig zag correction – wave A ended at 85.33 in 1987 and wave B only recently, into the Sep.’22 high of 114.78 – wave C has since begun a primary degree five wave impulse decline where ultimate downside targets remain towards 51.18+/-. That’s a depreciation of -55% per cent before the end of the decade.
Outlook Preview – Interest Rates
• The 60-year cycle in Corporate AAA Bond Yields formed a major low in year-2011 which ordinarily translates into a new sustained half-cycle uptrend of 30+/- years – but the COVID-19 coronavirus pandemic forced more monetary accommodation from central banks, prolonging the previous 30-year cycle downtrend even longer – but the March ’20 lows are finally secure, confirming a new 30+ year uptrend for interest rates has begun.
• Central Banks & Inflation – In last year’s mid-year report, we forecast an interim high for inflation and a pullback lasting several months, maybe longer. That scenario has unfolded to plan – U.S. headline CPI has pulled lower from last June’s high of 9.1% to 6.4% in Jan.’23 fueling market expectations of higher risk-assets, i.e. stocks and commodities on a growing belief that inflation has peaked, Central Banks will deliver a soft (economic) landing, consumers adapting to higher costs and a China reopening. But Elliott Wave analysis suggests this is too optimistic – inflationary pressures are expected to tick higher during the next 2-3 months causing a re-think from the consensus Fed-Pivot/soft-landing forecasts – rather, Central Banks are forced to turn more hawkish, prolonging the current interest rate hiking cycle, i.e. higher-rates-for-longer. This triggers a risk-asset collapse which later turns yields lower but not before higher-highs during the next 2-3 months.
Currencies – US$ Dollar Index – Long-Term Cycle
The origin of the US$ dollar goes back to the 1660’s when the Spanish Real-de-a-Ocho, also known as the piece of eight, is a silver coin worth eight Spanish Reales. It was minted in the Spanish Empire following a monetary reform in 1497 with content 25.563 g = 0.822 oz t fine silver (Quarterly Forecast chart in our latest report!).
The amazing thing about the price development of the Spanish dollar into the American dollar is the way in which it unfolds over many centuries into a perfectly formed Elliott Wave impulse pattern consisting of five waves from the all-time-low of the American Civil War low of 1864 into the eventual peak of 1985. That five wave expanding impulse ending on a quarterly closing price of 149.46 (intraday at 164.72) explains why the dollar has been declining ever since reaching this peak – because the completion of a five wave uptrend must next be compensated by a three wave correction, in this case, labelled as a cycle degree A-B-C zig zag which is still unfolding to this day.
Cycle wave B ended last September ’22 at 114.78 having completed a primary degree running flat pattern from the Oct/’87 low of 85.33. Extending wave A (including the lower-low to 70.70 of wave B) by a fib. 38.2% ratio projects wave C down to 51.18+/- within the next several years. Such a decline would emulate wave A’s decline which took 2½ years to complete – that’s a dollar depreciation of -55% per cent with a date for completion in March ’25.
Fig #216 – US$ Dollar Index – Composite Cycle – Monthly by WaveTrack International
We think it will take a little longer basis the 195-month, 16.25-year cycle which depicts the next major low around Oct.’27 – see fig #216.
Preview Currencies – USD vs. CAD
US$/CAD Canadian dollar ended cycle wave B at 1.4040 (146.69) into the pandemic high and is now trending lower as cycle wave C during the next several years. Shorter-term, the outlook is unclear with primary wave 2’s rally from the June ’21 low of 1.2007 ending into the Oct.’22 high of 1.3978 alongside a US$ dollar index peak – but so far, no five wave impulse decline to confirm the new downtrend. See fig 253.
Fig #253 – USD vs. CAD – Daily – Forecast by WaveTrack International
Year of Opportunity and Vigilance – Be Prepared
Our EW-team worked hard to put this information together in a way that is comprehensive to ensure that you are prepared for the major FX moves to come in 2023 and beyond. Check out the table of contents below and if you are trading Currencies – don’t miss it!
We invite you to take this next step in our financial journey with us – video subscription details are below – just follow the links and we’ll see you soon!
Most sincerely,
Peter Goodburn
Founder and Chief Elliott Wave Analyst
WaveTrack International
What you get
Contents: 150 charts | VIDEO DURATION: nearly 2 hours 44 mins.
The contents of this CURRENCIES & INTEREST RATES VIDEO include Elliott Wave analysis for:
Forex (151 charts):
• US CPI
• US PCE
• US$ Index + Cycles
• Euro/US$ + Cycles
• Stlg/US$
• US$/Yen
• US$/CHF
• US$/NOK
• US$/SEK
• AUD/US$
• US$/CAD
• NZD/US$
• Euro/Stlg
• Euro/Yen
• Euro/CNY Renminbi
• Stlg/YEN
• Stlg/AUD
• Stlg/ZAR
• AUD/YEN
• AUD/CNY Renminbi
• AUD/NZD
• Asian ADXY
• US$/Renminbi
• US$/KRW
• US$/SGD
• US$/INR
• US$/TWD
• USD/THB
• US$/MYR
• US$/IDR
• US$/PHP
• USD/BRL
• USD/RUB
• US$/ZAR
• US$/MXN
• US$/TRY
• US$/PLZ
• Bitcoin
• Ethereum
Interest Rates (53 charts):
• US10yr Real Yield
• US30yr Yield + Cycles
• US10yr Yield + Cycles
• US5yr Yield
• US2yr Yield
• US2yr-10yr Yield Spread
• US10yr-30yr Yield Spread
• 3mth EuroDollar-US10yr Yield Spread
• Comparison US10-DE10yr vs S&P 500
• US10yr TIPS Break Even Inflation Rate
• US10-DE10yr Yield Spread
• DE10yr Yield
• ITY10yr Yield
• Italy10-DE10yr Yield Spread
• Australia 10yr Yield
• Japan 10yr Yield
How to buy the Forex + Bonds Video Outlook 2023
Simply contact us @ services@wavetrack.com to buy the CURRENCIES + INTEREST RATES Video Outlook 2023 for USD 49.00 (+ VAT where applicable) or alternatively our Triple Video Offer for USD 99.00 (+ VAT where applicable) – Review the content of WaveTrack Stock Indices Video PART I here and the Commodities Video PART II here.
*(additional VAT may be added depending on your country – currently US, Canada, Asia have no added VAT but most European countries do)
We’re sure you’ll reap the benefits – don’t forget to contact us with any Elliott Wave questions – Peter is always keen to hear you views, queries and comments.
Visit us @ www.wavetrack.com
New Commodities Video Outlook 2023
by WaveTrack International| January 23, 2023 | No Comments
Commodities Video Outlook 2023 – ‘Let’s review the main drivers for COMMODITY prices – Inflation, Interest Rates, the likelihood of an Economic Recession and trends in the US$ Dollar’
We’re pleased to announce the publication of WaveTrack’s annual Triple Video Outlook 2023 of medium-term ELLIOTT WAVE price-forecasts. Today’s release is PART II, COMMODITIES – Part I was released last month and Part III will be published in late-February / beginning of March 2023…
• PART I – STOCK INDICES – out now!
• PART II – COMMODITIES – out now!
• PART III – CURRENCIES & INTEREST RATES – coming soon!
Commodities Forecast Highlights 2023!
Commodities Underperformers vs. Outerperformer’s for 2023
Commodities tied to the fluctuations in the global economic cycle are preparing for another downturn during the first-half of 2023. In many cases, corrective declines that began mid/late-2021 or early-2022. This depended greatly on the specific commodity to remain incomplete with further declines forecast this year, in 2023. Recession fears have since been diluted in January’s optimism, but downside risks remains.
Base Metals like Copper were initially down in 2022 by -35% but rallied higher from July’s low by +33% per cent. Eroding those earlier losses. Prices are set to decline again though, from current levels.
Energy markets which were big outperformers in 2022 are also expected lower this year. Crude/Brent oil are expected to see some of the biggest declines together with benchmark XLE and XOP ETF’s. These declines can pull prices down by -40% per cent through the first-half of the year.
In contrast, Precious Metals bottomed in September ’22 having undergone a successful counter-trend completion over the last two years. Gold, Silver, Platinum and Palladium are all set to outperform and trend higher whilst industrial commodities decline. Whilst 2-year uptrends are underway, pockets of downward corrections are expected to mirror the US$ dollar’s movements. Find out more amazing details in our Elliott Wave Commodities Video 2023!
Main Drivers for Commodity Prices
Commodities main drivers for this year remain with existing inflationary trends, interest rates, the risk of an economic recession and direction in the US$ dollar.
Double-digit inflation in some developing economic regions of the world has resulted in cap-ex reductions in key commodity areas. Especially, in developing nations, high single-digit inflation has increased fears of a recession this year, in 2023 – see fig #96. Fund managers were unanimous late last year (2022) that persistent inflationary pressures would trigger an economic downturn this year although declines in U.S. CPI from the June ’22 peak of 9.1% to 6.5% has given way to January’s optimism for a mild recession.
Fig #96 – Double-Digit Inflation – Source: Elements ELEMENTS.VisualCapitalist.com
‘Goldilocks’ moment?
Goldman Sachs analysts are epitomising that change into more optimistic sentiment. They say that commodities have the strongest outlook of any asset class in 2023, with a perfect macroeconomic environment and critically low inventories for almost every key raw material. They said that demand in China is starting to rebound and there’s insufficient investment in supply, meaning the year as a whole will be a ‘Goldilocks’ moment for rising prices.
The Federal Reserve dot-plot
The Federal Reserve dot-plot suggests the fed-funds rate will end up around 5.0% per cent. February’s next meeting suggests a slowing down in the pace of increases with the market expecting only 0.25% rate hike. Even so, rising rates remain in the background. The long-end of the interest rate curve, ten-year treasuries and bunds traded in Europe completed counter-trend 4th wave corrections into December’s lows. They’re already showing signs of heading higher. This is really important because if interest rates are set to resume higher, then it will be the major pain trade of the year because just about every bond trader is currently positioned for lower rates, not higher.
The US$ Dollar
One of the main contributing factors that’s expected to drive commodity prices higher over the next several years into an ‘inflation-pop’ peak is the weakening of the US$ dollar. There’s a distinct 15.6-year cycle recurrence for the US$ dollar index which has signalled the various peaks and troughs over the past several decades – see fig #105.
Fig # 105 – US Dollar Index – Composite Cycle by WaveTrack International
Commodities Video Outlook 2023
This video is Part II and we’ll be taking a look at over 100 individual commodity contracts and cycles within three main sub-sectors, Base Metals, Precious Metals, Precious and Base Metal Miners and Energy.
The central themes we’ll be discussing in this video include amongst those mentioned before an update of inflation-sensitive commodities like Food and Energy including ETF’s like the DB Agriculture Fund, XLE and XOP. Furthermore, we’re taking a look at some strategic metals like Iron Ore, Uranium and Rare Earth ETF’s and a few related equities. And much more…
This is WaveTrack’s state of the art video –only available twice a year– if you are trading commodities this is a must have.
Sincerely,
Peter Goodburn & EW-team
Commodities Video Outlook 2023 Part II/III
Contents: 113 charts
Time: 2 hours 24 mins.
• US CPI
• Food and Agriculture Index
• DB PowerShares Agriculture Fund
• US Dollar index + Cycles
• CRB-Cash index + Cycles
• Copper + Cycles
• Aluminium
• Lead
• Zinc
• Nickel
• Tin
• Iron Ore
• Uranium
• Rare Earths
• BHP-Billiton
• Freeport McMoran
• Antofagasta
• Anglo American
• Glencore
• Rio Tinto
• Vale
• Gold
• Gold-Silver Ratio
• Silver
• Platinum/Silver Ratio
• Platinum
• Palladium/Gold Ratio
• Palladium/Platinum Ratio
• Palladium
• GDX Gold Miners Index
• Newmont Mining
• Amer Barrick Gold
• Agnico Eagle Mines
• AngloGold Ashanti
• XAU Gold/Silver Index
• Fresnillo Silver
• Crude Oil + Cycles
• Brent Oil
• Gasoline RBOB
• Natural Gas
• TTF Natural Gas
• XLE Energy SPDR
• XOP Oil and Gas Index
How can you purchase the video?
1. Contact us @ services@wavetrack.com and ask for a PayPal payment link(please state if you like to purchase the Commodities Single video for USD 49.00 + VAT* or the Triple Video for USD 99.00 +VAT*?).
2. Additionally, to PayPal we now offer as well payment via credit card payment link
*(additional VAT may be added depending on your country – currently US, Canada, Asia have no added VAT but most European countries do)
We’re sure you’ll reap the benefits – don’t forget to contact us with any Elliott Wave questions – Peter is always keen to hear you views, queries and comments.
Visit us @ www.wavetrack.com
We’re sure you’ll reap the benefits. Don’t forget to contact us with any Elliott Wave questions. Our EW-team is always keen to hear your views, queries, and comments.
Visit us @ www.wavetrack.com

Recent Posts
Recent Comments
Archives
- June 2025
- March 2025
- February 2025
- January 2025
- December 2024
- August 2024
- July 2024
- June 2024
- May 2024
- April 2024
- February 2024
- January 2024
- December 2023
- August 2023
- July 2023
- June 2023
- March 2023
- February 2023
- January 2023
- December 2022
- November 2022
- October 2022
- August 2022
- July 2022
- June 2022
- May 2022
- March 2022
- February 2022
- January 2022
- December 2021
- August 2021
- July 2021
- June 2021
- March 2021
- February 2021
- January 2021
- December 2020
- November 2020
- August 2020
- July 2020
- June 2020
- May 2020
- April 2020
- March 2020
- February 2020
- January 2020
- December 2019
- October 2019
- September 2019
- July 2019
- June 2019
- May 2019
- April 2019
- March 2019
- February 2019
- January 2019
- December 2018
- November 2018
- September 2018
- August 2018
- July 2018
- June 2018
- May 2018
- April 2018
- March 2018
- February 2018
- January 2018
- December 2017
- November 2017
- October 2017
- September 2017
- August 2017
- July 2017
- June 2017
- May 2017
- March 2017
- February 2017
- January 2017
- December 2016
- November 2016
- October 2016
- September 2016
- August 2016
- July 2016
- June 2016
- May 2016
- April 2016
- March 2016
- February 2016
- January 2016
- December 2015
- November 2015
- October 2015
- September 2015
- August 2015
- July 2015
- June 2015
- May 2015
- April 2015
- March 2015
- February 2015
- January 2015
- December 2014
- November 2014
- October 2014
- September 2014
- August 2014
- July 2014
- June 2014
- May 2014
- April 2014
- March 2014
- February 2014
- January 2014
- December 2013
- November 2013
- October 2013
- September 2013
- August 2013
- July 2013
- June 2013
- May 2013
- April 2013
- March 2013
- February 2013
- January 2013
- December 2012
- November 2012
- October 2012
- September 2012
- August 2012
Categories
- ADXY Index
- Agnico Eagle Mines
- Alcoa
- Amazon
- AngloGold Ashanti
- Antofagasta
- APPL
- Apple
- ASX 200
- AUD vs USD
- AUDNZD
- AUDUSD
- Australia ASX 200
- Baltic Dry Index
- Banking
- Base Metals
- Biotechnology
- Bitcoin
- Bovespa
- Broadcom
- Catalexit
- central banks
- Christmas
- Commodities
- Commodities Video Outlook 2020
- Conference
- Copper
- Coronavirus Sell-Off
- CRB
- Crude oil
- crude oil price chart
- CryptoCurrency
- Currencies
- Currencies + Interest Rates Video Outlook
- Cycles
- Dax 30
- deutsche bank
- Dewey Cycle
- DJ Transportation Average
- DJ Utilities
- Dow Jones 30
- Dow Theory
- ECB
- economy
- Elliott Wave
- Elliott Wave Charts
- Elliott Wave Patterns
- Elliott Wave Principle
- Emerging Markets
- Ending-Diagonal Elliott Wave Pattern
- Equity
- EUR vs CHF
- EUR/USD
- Euro / US$
- Eurostoxx 50
- EuroStoxx50
- EuroStoxxBanks
- EURUSD
- Expanding Flat Pattern
- FAAMG
- FANG+
- fib-price-ratio
- Fibonacci Trading
- Fibonacci-Price-Ratio
- Financial Forecasting
- Fixed Income
- forex
- Freeport McMoran
- FTSE 100
- Fund Management
- FX
- FXStreet
- GBP/AUD
- GBP/USD
- GDX
- GDXJ
- Germany 10 year Euro Bund future
- Gilead Sciences
- Glencore
- Global Economy
- Gold
- Gold Mining
- Golden Ratio
- goldman sachs
- Google Inc.
- Google/Alphabeth
- Greek debt crisis
- Hang Seng
- Harbinger
- Hungarian Forint
- IBEX 35 Index Spain
- Independent Research
- India-CNX Nifty 50
- Interest Rates
- Interview
- IRP Independent Research
- kbw bank index
- Lonmin
- McDonald's
- MID-YEAR VIDEO UPDATE!
- Mifid II
- Mines
- Mining
- MSCI China
- MSCI Emerging Markets
- Nasdaq 100
- Nasdaq Biotechnology Index
- Nasdaq Composite
- Nasdaq100
- Netflix
- Newmont Mining
- Nikkei 225
- NVIDIA
- NYSE Composite Index
- Palladium
- Platinum
- Precious Metals
- Ralph Nelson Elliott
- Reversal-Signature
- Russell 2000
- Russia RTS
- S&P 500
- Sector
- Secular-Bull
- Sentiment Survey
- Shanghai Composite Index
- Silver
- Slanting Flat Elliott Wave Pattern
- SP100
- SP400 Mid-Cap
- SP500
- SPX 500
- STLG/AUD
- Stlg/US$
- STLG/USD
- STLG/YEN
- STLG/ZAR
- Stock Index
- Stock Index Tracking
- Stock Index Video
- Stock Indices
- Stock Indices Video Outlook 2023
- Stock Indices Video Outlook 2025
- Sugar
- Summary
- Tesla
- Tesla Inc
- Toyota
- Track Record
- trading
- Trusts
- Tutorial
- Uncategorized
- UniCredit
- US
- US Dollar Index (DXY) (USDX)
- US$ Index
- US-Dollar Index
- US10yrYields
- USD
- USD/ARS
- USD/CNY
- USD/IDR
- USD/INR
- USD/MXN
- USD/SGD
- USD/THB
- USD/YEN
- USD/ZAR
- Vale
- Value Line Index
- video
- VIDEO OUTLOOK 2018
- VIDEO OUTLOOK 2020
- VIX
- W.D. Gann
- WaveTrack International
- XAU Gold/Silver Index
- Xetra Dax
- XOP
- Yields
- Zig Zag
- Zinc
- ‘INFLATION-POP’
- ‘SHOCK-POP-DROP’