Commodities Mid-Year Video Outlook 2026 Part II / III
by WaveTrack International| July 31, 2026 | No Comments

The Hidden Commodity Rotation Most Investors Haven’t Seen Yet
Why the next major opportunities in Energy, Copper and Precious Metals may not be where conventional analysis is looking.
Every commodity bull market creates a familiar story.
This year, that story revolves around artificial intelligence, electrification, geopolitical tensions and inflation. Copper is expected to remain in structural shortage. Oil is believed to be driven primarily by events in the Middle East. Gold continues to attract attention as the ultimate safe-haven asset.
These narratives may sound convincing—but markets often change direction long before the headlines do.
History repeatedly shows that the biggest investment opportunities emerge when investors stop looking at individual markets in isolation and begin understanding how they interact with one another.
That is the foundation of Elliott Wave analysis.
The Relationship That Matters
One of the most revealing indicators Peter Goodburn follows is not a commodity at all—it’s the Copper/Oil Ratio.
Fig #274 – Copper-Crude Oil Ratio – Weekly
Few investors pay attention to it, yet it has repeatedly highlighted important shifts in leadership within the commodity complex.
Today, the ratio is sending a fascinating message.
Rather than confirming broad strength across commodities, it suggests a period of growing divergence. Energy appears capable of extending its advance, while Copper may be approaching a much more challenging phase than current consensus expects.
This distinction matters because commodities rarely move together. Leadership rotates. Capital rotates. Sentiment rotates.
Understanding those rotations often provides a significant advantage over simply reacting to today’s news.
Looking Beyond the AI Narrative
Copper has become one of the market’s favourite long-term investment themes.
Artificial intelligence, data centres, electric vehicles and infrastructure spending have fuelled widespread expectations of ever-rising demand.
Yet successful investing has never been about following the most popular story.
It has been about recognising when expectations have become too one-sided.
Peter’s latest Elliott Wave analysis suggests that Copper may have already completed a major advance that began after the financial crisis. At the same time, global inventories remain historically elevated—a combination that contrasts sharply with the overwhelmingly bullish sentiment seen across much of the market.
That doesn’t change Copper’s long-term importance.
It simply suggests that timing matters.
Markets often require significant corrections before the next secular advance begins.
Why Energy May Still Surprise
While many investors have become comfortable expecting oil prices to remain within a relatively narrow range, sentiment itself can become a valuable contrarian indicator.
Periods of widespread pessimism have frequently appeared close to important turning points.
The Elliott Wave structure, supported by the behaviour of the Copper/Oil Ratio, continues to point toward the possibility of another meaningful advance in Crude and Brent Oil before a much larger correction develops.
In other words, today’s consensus may be focusing on the wrong phase of the cycle.
Precious Metals: Preparing for the Next Opportunity
Gold, Silver, Platinum and Palladium have experienced meaningful corrections from their highs earlier this year.
At the same time, several major financial institutions have begun reducing their near-term price forecasts.
Contrarian investors know this pattern well.
The strongest opportunities often emerge when optimism fades—not when enthusiasm is at its peak.
Peter’s analysis suggests that precious metals may be approaching important cyclical lows during the months ahead, particularly as the US Dollar completes its current advance. If that relationship unfolds as expected, the coming correction could become the foundation for the next significant move higher in both precious metals and mining shares.
A Market of Increasing Divergence
Perhaps the most important conclusion from this year’s research is that commodities should no longer be viewed as one single asset class.
The next phase appears increasingly selective.
Energy may continue outperforming.
Industrial metals may weaken.
Precious metals could be preparing for an important recovery.
Strategic metals such as Iron Ore, Uranium and Rare Earths continue following their own distinct Elliott Wave structures.
This environment rewards analysis based on relationships rather than headlines.
It also places greater importance on understanding where each market sits within its larger cycle.
Seeing the Bigger Picture
Financial markets rarely announce their next major turning point in advance.
Instead, they leave clues.
Sometimes those clues appear in sentiment.
Sometimes in price structure.
And sometimes in the relationship between two markets that few investors are watching.
The goal of Elliott Wave analysis is not to predict every short-term fluctuation. It is to identify the larger patterns before they become widely recognised and to help investors prepare rather than react.
If the months ahead unfold as anticipated, the biggest opportunities may not come from following the consensus—but from recognising where leadership is quietly beginning to change.
The Mid-Year 2026 Commodities Video Update provides that broader perspective, offering a comprehensive roadmap across the global commodity complex for the remainder of 2026 and beyond.
Sincerely,
Peter Goodburn & EW-team
Commodities Mid-Year Video Outlook 2026 Part II/III
Contents: 112 charts
Time: 2 hours 17 mins.
• Copper vs. Crude Oil Ratio
• CRB-Cash vs. SP500
• CRB Commodity Index
• Copper Track Record
• Food and Agriculture Index
• DB PowerShares Agriculture Fund
• Baltic Dry Index
• Copper
• Aluminium
• Lead
• Zinc
• XME Metals & Mining Index
• COPX Copper Miners ETF
• DBB Base Metal Fund
• BHP-Billiton
• Anglo American
• Antofagasta
• Freeport McMoran
• Rio Tinto
• Glencore
• Vale
• Iron Ore
• Fortescue Metals
• Companhia Siderurgica
• Gerdau Steel
• Uranium
• Rare Earths
• Gold
• Gold-Silver Ratio
• Silver
• Gold/Platinum Ratio
• Platinum
• Palladium
• GDX Gold Miners Index
• XAU Gold/Silver Index
• Agnico Eagle Mines
• AngloGold Ashanti
• Amer Barrick Gold
• Newmont Mining
• Crude Oil
• Brent Oil
• Natural Gas
• TTF Natural Gas
• XLE Energy SPDR
• XOP Oil and Gas Index
SELECT YOUR PACKAGE
Single Video – *$99.00 – PART II Commodities Mid-Year Video Outlook 2026 (July ’26)
Order the Triple Package via PayPal. We will send you the video via email! Part III will be automatically sent to you as soon as they are published! Triple Package offer – *$211.00 (discount)! – PART I – PART II – PART III (June – August ’26)
PART III will be available in a few weeks’ time – we’re working on it!
ORDER NOW
Single Video – *$99.00 – PART II Commodities Mid-Year Video Outlook 2026 (July ’26)
We’re sure you’ll reap the benefits – don’t forget to contact us with any Elliott Wave questions – Peter is always interested to hear your views, queries, and comments.
Visit us @ www.wavetrack.com
Stock Indices Mid-Year Video Update PART I/III
by WaveTrack International| June 30, 2026 | No Comments
Stock Indices Mid-Year Video Update 2026
Includes ECONOMIC INDICATOR & SENTIMENT STUDIES
AI Roadmap II 2026 – Easy Money Transitions to Heightened Risk
AI Roadmap II: The Easy Money Trade Is Ending. What Comes Next?
For the Last 18 Months, Buying Every Dip Worked.
What if the next six months are completely different?
Since late 2024, investors have been rewarded for doing one thing: buying market corrections. From the October 2024-April 2025 decline to the October 2025-April 2026 correction, the dominant trend has remained remarkably consistent—temporary weakness followed by renewed advances to fresh highs.
WaveTrack anticipated both corrective phases well before they unfolded.
Now, however, the market is beginning to tell a different story.
The easy-money phase that has characterised the AI-led bull market is gradually giving way to a far more demanding environment—one where timing, market selection and risk management become increasingly important.
Fig #15 – S&P 500 – Weekly – Elliott Wave Forecast – Baseline for the Mid-Year Report
The AI Boom Has Changed the Market
Most investors still think in terms of the “Magnificent Seven.”
But beneath the surface, institutional money has been quietly rotating.
Leadership has shifted toward semiconductor manufacturers, AI infrastructure, microchip producers, data-centre companies and supporting technology industries. Meanwhile, many software companies have begun to lag despite continued enthusiasm surrounding Artificial Intelligence.
This internal rotation has created an increasingly fragmented market.
Many technology stocks no longer move together.
That makes market forecasting considerably more challenging—and far more dependent on understanding the underlying Elliott Wave structure rather than simply following headlines.
Why This Report Is Different
Our Mid-Year 2026 Trilogy is not simply another market commentary.
It is a comprehensive global roadmap built from 175 Elliott Wave charts covering the world’s major stock indices across:
Read more «Stock Indices Mid-Year Video Update PART I/III»
Currencies and Interest Rates Video Outlook 2026 Part III/III
by WaveTrack International| February 28, 2026 | No Comments

We’re pleased to announce the publication of WaveTrack’s annual Triple Video Outlook 2026 of medium-term ELLIOTT WAVE price-forecasts. Today’s release is PART III, CURRENCIES + INTEREST RATES.
• PART I – STOCK INDICES – out now!
• PART II – COMMODITIES – out now!
• PART III – CURRENCIES + INTEREST RATES – out now!
Now, let’s look at some of the Currencies + Interest Rates Outlook Highlights that are crucial to know during this economic timeline…
The Dollar’s “Watershed Moment” — And What Comes Next
Last year, everyone loved the US dollar.
This year, it fell -12%.
Most investors see that as weakness.
We see it as a watershed moment.
Because when sentiment swings that violently…
When positioning hits extremes…
When the headlines feel obvious…
That’s usually when the real move begins.
And in our latest Currencies & Interest Rates Video (Part III), we lay out exactly why.
The Setup Most Traders Are Missing
In this special annual edition (170+ FX & Interest Rate charts), we walk through two powerful, interconnected themes:
1. A US$ rally within a larger long-term decline
2. Range-bound interest rates… before a much more significant move lower later
That combination alone should make serious market participants sit up straight.
Because if the dollar rallies first — while yields stay range-bound — the positioning implications across:
Read more «Currencies and Interest Rates Video Outlook 2026 Part III/III»
Commodities Video Outlook 2026 – PART II/III
by WaveTrack International| February 2, 2026 | No Comments
Commodities Video Outlook Part II (2026): The Inflation-Pop Is Alive… But It Isn’t Moving in Sync
Every big commodity cycle has a “tell.”
Not a headline.
Not a rumor.
Not a one-day spike.
A tell is when two key markets that normally move together… suddenly don’t.
That’s what we’re seeing right now.
In our latest Annual Trilogy Video Series, Part II focuses on Commodities — and it begins with a question we can’t ignore:
An inflation-pop peak should happen around the same time — just like it did in 2007–2008.
But today, copper and crude oil are telling two completely different stories.
And that divergence is not a small detail.
It’s a signal..
Part II: Commodities (100+ Elliott Wave Charts) — What This Video Covers
This video is Part II of WaveTrack International’s medium- and long-term forecast series, led by Peter Goodburn and the Elliott Wave analysis team.
Inside Part II, you’ll see roughly 100 commodity charts, grouped into the three big engines of the global cycle:
Read more «Commodities Video Outlook 2026 – PART II/III»
Stock Indices Video Outlook 2026 – PART I/III
by WaveTrack International| December 31, 2025 | No Comments
Stock Indices Video Outlook 2026
AI (Artificial Intelligence) Roadmap 2026!
AI – Short-term Correction – Upside Continuation
Highlights 2026
and so much more
The Elliott Wave Signal Most Investors Will Miss Before 2026
Every year, markets tell a story. Most investors hear the noise—but only a few understand the plot.
In WaveTrack International’s Elliott Wave Triple Video Outlook 2026, Peter Goodburn and his team step back from headlines and sentiment to reveal the structure beneath the chaos. This three-part annual video series maps the medium- and long-term trajectory of global markets—stock indices, commodities, currencies, and interest rates—using one unifying framework: the Elliott Wave Principle.
Part I: Stock Indices—the focus of this first release—analyses nearly 140 global equity charts across the U.S., Europe, and Asia. But this isn’t just a forecast for next year. It’s a roadmap that stretches into the final stages of the current “Inflation-Pop” cycle, potentially defining how this decade ends. Central to the discussion is one question investors can’t stop asking:
Is AI a bubble—or the engine of the next major wave higher?
This video doesn’t argue opinions. It lets the waves speak.
Why This Outlook Changes How You See 2026
Here’s what makes this outlook different: it doesn’t focus on what might happen—it focuses on when and how markets typically unfold.
A short-term correction appears increasingly likely as 2026 begins, setting the stage for a powerful continuation phase later in the year. This rhythm—pause, then acceleration—is especially important for investors exposed to AI, mega-cap technology, and global indices.
The analysis challenges popular narratives. While mainstream commentary debates whether AI is in a speculative bubble, the wave structure suggests something more nuanced:
a correction, not a collapse—followed by leadership into new highs.
Under the surface, short-term sentiment indicators flash warnings: fund managers holding record-low cash, crowded trades in the MAG-7, margin debt divergences, and option activity at historical extremes.
To provide perspective, the video goes far beyond recent history. You’ll see Elliott Wave patterns applied to the Dow Jones stretching back to the 1700s, revealing recurring long-cycle rhythms that still influence markets today. This historical lens helps explain why short-term volatility may be necessary before the next sustained advance—and why 2026 could be a defining year rather than a final peak.
From U.S. indices and AI leadership, to European relative strength, emerging market rotations, and global synchronisation, the message is clear:
Markets are aligning—but timing will be everything.
And that’s exactly what this video is designed to help you see—before the rest of the crowd does.
The Elliott Wave Triple Video Outlook 2026 isn’t about predictions.
It’s about preparation.
If you want to understand where this cycle may be heading—and how today’s uncertainty fits into a much bigger picture—this is where the story truly begins.
We invite you to take this next step in our financial journey with us – video subscription details are below – just follow the links and we’ll see you soon!
Most sincerely,
Peter Goodburn
Founder and Chief Elliott Wave Analyst
WaveTrack International
Contents Stock Indices Video Outlook 2026
Charts: 141 | Video: 2 hours 50 mins.
CONTACT US NOW – SELECT YOUR PACKAGE
Single Video – *$66.00 – PART I Stock Indices Video Outlook 2026 (December ’25) or send us an email to services@wavetrack.com
Triple Package offer – *$122.00 (discount)! – PART I – PART II – PART III (January – February ’26)
*(additional VAT may be added depending on your country – currently US, Canada, Asia have no added VAT but most European countries do)
PARTS II & III will be available in a few weeks’ time – we’re working on it!
ORDER NOW
1. Click on the payment link.
2. Choose your Stock Indices Video Outlook or Triple Video Outlook.
3. Start trading with clear patterns and confidence.
To receive your VIDEO UPDATE please use this instant PayPal payment link for US, UK, Australian and international customer except EU customers click here USD 88.00 (instant Download with VAT).
– Alternatively, if you like to pay via credit card, we are very happy to send you a credit card payment link – contact us via email to services@wavetrack.com/
– Or opt for the TRIPLE PACKAGE for USD *122.00 in total?
– As soon as we receive payment either via the instant PayPal payment link or via the credit card link we provide you with the video link & PDF report once payment is confirmed. Please know the reply can take up to 6 hours. But rest assured we will give our best to provide you with the information as soon as possible!
*(additional VAT may be added depending on your country of residence. Currently, the US, Canada, Asia have no added VAT except EU countries)
We’re sure you’ll reap the benefits – don’t forget to contact us with any Elliott Wave questions – Peter is always interested to hear your views, queries, and comments.
Visit us @ www.wavetrack.com
Currencies and Interest Rates Mid-Year Video Update! PART III/III
by WaveTrack International| August 25, 2025 | No Comments
We’re pleased to announce the publication of WaveTrack’s annual Triple Video Mid-Year Update 2025 of medium-term ELLIOTT WAVE price-forecasts. Today’s release is PART III, CURRENCIES and INTEREST RATES.
• PART I – STOCK INDICES – out now!
• PART II – COMMODITIES – out now!
• PART III – CURRENCIES & INTEREST RATES – out now!
Now, let’s look at some of the Currencies and Interest Rates Mid-Year Video Highlights that are crucial to know during this economic timeline…
Highlights
Currencies and Interest Rates – Turning Point
The financial world is at a turning point. After months of steady US dollar weakness and central banks cutting rates across the globe, sentiment is shifting fast. WaveTrack International’s latest EW-Navigator Video Report – Part III of our Mid-Year Trilogy takes you inside the charts with Elliott Wave analysis across Currencies and Interest Rates, revealing what’s next for the markets.
A Contrarian Dollar Rally?
The US dollar has fallen over -12% since January, and sentiment towards “King Dollar” has collapsed to a 20-year low. On the surface, the story seems simple: debt burdens are mounting, global reserves are diversifying away from the dollar, and traders are overwhelmingly long the euro.
But here’s the twist—such extremes often mark turning points. WaveTrack’s analysis suggests that a contrarian US dollar rally could be right around the corner, lasting several months before the long-term decline resumes.
Key signals include:
Interest Rates – The Decline After the Surge
Central banks worldwide have been trimming rates, but the US Federal Reserve has been dragging its feet. Markets now price in at least two rate cuts from the Fed, while long-term bond yields are preparing for their next big move.
WaveTrack’s forecasts highlight:
Crypto Joins the Story
While traditional markets wrestle with currencies and yields, the crypto space looks far more bullish. WaveTrack projects long-term upside targets of:
These cycles position cryptocurrencies as a dynamic counterweight to fiat and bonds, particularly during downturns in risk assets.
Why This Matters Now
The US dollar’s positioning at a 20-year underweight and the historic scale of US national debt ($36.2 trillion and rising) set the stage for volatile, market-defining moves. The interplay between tariffs, trade wars, and central bank policy means traders and investors cannot afford to rely on old narratives.
WaveTrack’s Elliott Wave roadmap provides clarity in the chaos, revealing how currencies and yields are likely to unfold—not just over the next few months, but deep into the next few years.
Get ready to gain a fresh perspective, delivered right to your screen. Prepare for enlightening discussions, visual breakdowns, and the latest market insights based on Elliott Wave, Fibonacci-Price Ratio’s and Cycle work – all in one place.
Most sincerely,
Peter Goodburn
Founder and Chief Elliott Wave Analyst
WaveTrack International
What you get
Contents: 132+ charts | VIDEO DURATION: nearly 2 hours 28 mins.
The contents of this CURRENCIES & INTEREST RATES VIDEO include Elliott Wave analysis for:
Forex (92 charts):
• US Effective Tariff Rate
• National Debt, USD, EUR Sentiment, Fed Rates, CPI an more
• US Yield Curve
• G10 Interest Rates
• US$ Index
• USD COT
• Euro/US$
• EUR COT
• Stlg/US$
• STLG COT
• US$/Yen
• YEN COT
• CHF COT
• US$/CHF
• US$/NOK
• US$/SEK
• US$/CAD
• CAD COT
• NZD/US$
• AUD/US$
• AUD COT
• NZD COT
• Euro/Stlg
• Euro/CHF
• Euro/Yen
• STLG/Yen
• AUD/Yen
• USD/BRL
• USD/RUB
• US$/ZAR
• US$/MXN
• USD/ILS
• Asian ADXY
• US$/Renminbi
• US$/KRW
• US$/SGD
• US$/INR
• US$/TWD
• USD/THB
• US$/MYR
• US$/IDR
• US$/PHP
• Bitcoin
• Ethereum
• XRP Ripple
Interest Rates (40 charts):
• History of Interest Rates
• US FED Funds
• US Fed Rate Cuts, Global Sentiment, Trade War…
• US30yr Yield + Cycle
• US10yr Yield + Cycle
• US2yr Yield
• US2yr-10yr Yield Spread
• US10-DE10yr Yield Spread
• DE10yr Yield
• DE2yr Yield
• DE2-DE10yr Yield Spread
• UK10yr Yield
• Australia 10yr Yield
• Canada 10yr Yield
• Japan 10yr Yield
BUY NOW! FOR CLIENTS OUTSIDE THE EU (no extra VAT)
Simply click on this PayPal Payment link to purchase the CURRENCIES + INTEREST RATES Mid Year Video Update 2025 for USD 55.00 or alternatively our Triple Video Offer for USD 111.00 NOTE: We offer these videos at lower prices without VAT and no extra fees – but the processing can take up to 6 hours. No instant access.
BUY NOW! FOR CLIENTS within the European Union! (plus VAT)
Simply click on this PayHip Page link to purchase the CURRENCIES + INTEREST RATES Mid Year Video Update 2025 for USD 65.00 (+VAT and processing fees! However, you get immediate access!) or alternatively our Triple Video Offer for USD 122.00 + VAT and processing fees
– Alternatively, if you like to pay via credit card, we are very happy to send you a credit card payment link – contact us via email to services@wavetrack.com
We’re sure you’ll reap the benefits – don’t forget to contact us with any Elliott Wave questions – Peter is always keen to hear you views, queries and comments.
Visit us @ www.wavetrack.com
Commodities Mid-Year Video Update PART II/III
by WaveTrack International| July 29, 2025 | No Comments

Commodities Mid-Year Video Update 2025!
We’re pleased to announce the publication of WaveTrack’s Mid-Year Triple Video Update 2025 of medium-term ELLIOTT WAVE price-forecasts. Today’s release is PART II, COMMODITIES – Part I was released last month and Part III will be published in late-July / beginning of August 2025…
• PART I – STOCK INDICES – out now!
• PART II – COMMODITIES – out now!
• PART III – CURRENCIES & INTEREST RATES – coming soon!
Commodities Forecast Highlights 2025 and beyond!
and so much more…
Commodities Mid-Year Video Update 2025 – Where Are the Markets Headed Next?
Are Commodities Approaching a Tipping Point? The 2025 mid-year landscape is rapidly evolving—and our latest Commodities Video Update (Part II) is here to help you stay ahead of the curve.
This exclusive update dives deep into the forces driving global commodity markets, revealing both risks and opportunities with over 97 expertly analyzed charts. Whether you’re trading, investing, or managing portfolios, this is essential viewing for staying informed and positioning effectively for the months ahead.
Energy & Base Metals – The Downtrend Deepens
A clear theme has emerged: Base Metals and Energy are entering the next phase of multi-month declines.
Read more «Commodities Mid-Year Video Update PART II/III»
Stock Indices Mid-Year Video Update PART I/III
by WaveTrack International| June 25, 2025 | No Comments
Stock Indices Mid-Year Video Update 2025
Includes ECONOMIC INDICATOR & SENTIMENT STUDIES
Fang+ 7 Mag-7 Equities to outperform Tech Indices
Analyzing the Markets: Insights from Elliott Wave Theory for Traders and Investors
As investors and traders, staying updated on Stock Indices market trends is crucial for making informed decisions. Earlier this year, we witnessed significant movements in the stock market, particularly around April, which has set the stage for current and future trading opportunities. Many of our subscribers could take advantage of our Elliott Wave Video Outlook 2025 already as we forecasted the SP500, Nasdaq100, Alphabeth/Google amongst others correctly…
As we reach the midpoint of 2025, financial markets are in a continual state of flux, influenced by various sentiment shifts and underlying factors that affect trading strategies. If you’re an investor interested in Elliott Wave analysis and the dynamics of stock indices, you’re in for a treat with WaveTrack’s Stock Indices Mid-Year Video Update.
In this post, we’ll break down the essential insights from the Stock Indices Mid-Year Video Update. We’re covering everything from market corrections to potential future trends, all while ensuring it’s easy to digest for both seasoned investors and the financially curious.
A Quick Look Back: April Low Points
In December, forecasts indicated a potential correction of 20-30% for major indices. Especially those tied to AI technologies. Fast-forwarding to April, those projections materialized as the markets hit key downside targets. This period of uncertainty, however, has laid the groundwork for a new bull market uptrend.
Current Market Sentiment: What the Data Shows
Despite a recovery since April, large asset managers are exhibiting a degree of hesitation. Their equity allocations have only modestly increased, remaining net -38% underweight in U.S. equities. This sentiment is deemed contrarianly positive; when big players show reluctance, it often suggests that a broader market rally could be on the horizon, particularly as hedge funds are demonstrating renewed interest.
MAG7 – FANG+ Technology Sector Spotlight
The video focuses on the performance of major technology stocks, notably the Fang+ and Mag-7 equities. As per Elliott Wave principles, these stocks showcase strong uptrends driven by hedge fund activities. Riding these waves could be beneficial for those looking to capitalize on the tech boom we are witnessing.
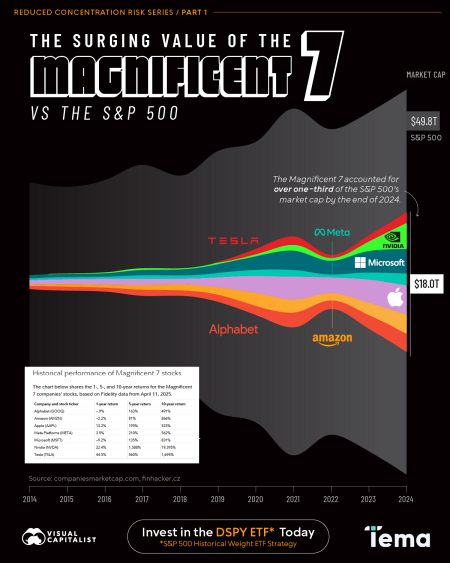
Fig #29 – % Capitalisation of Magnificent 7 Stocks in S&P 500 – WaveTrack International’s Mid-Year Financial Video Forecast 2025
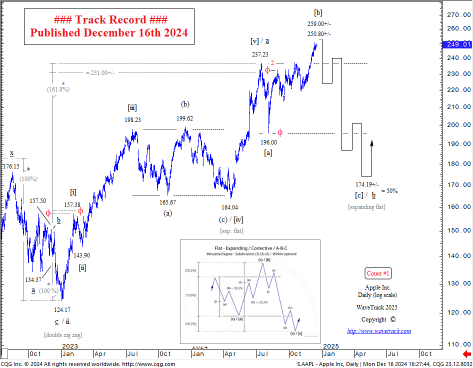
Fig #38 – Apple Inc. Track Record Dec. 16th 2024 – Forecast by WaveTrack International
Sector Highlights: Banks and Semiconductors
Following April’s lows, various U.S. sectors are showing signs of recovery. Particularly, banks and semiconductors are seen as having bottomed out and are primed for growth. For instance, the semiconductor sector is positioned to outperform, which can be pivotal as technology continues to be a driver of market momentum.
European Markets: An Attractive Alternative
Interestingly, as U.S. asset managers recalibrate their portfolios, there has been a notable shift towards European equities. Drawn by more attractive valuations compared to the U.S. In contrast, benchmarks like the Eurostoxx 50, Xetra DAX, and FTSE-100 have all bottomed and are entering new bullish uptrends. This could suggest a potential for considerable gains if you have exposure to these markets.
Global Indices: A Mixed Outlook
When examining global indices, the MSCI Emerging Markets index presents a more complex picture. While there’s bullish sentiment for countries like Brazil, Russia, and India, China’s indices are at a crossroads. Above all, the balancing between bearish and bullish scenarios is essential. Monitoring resistance levels in these markets will be vital for determining the next directional movement.
Why You Should Watch WaveTrack’s Mid-Year Update
In conclusion, WaveTrack’s Stock Indices Mid-Year Video Update offers a keen insight into market dynamics and provides practical information that can assist investors in navigating their trading strategies effectively. With the market facing both challenges and opportunities, leveraging Elliott Wave analysis could be your edge in achieving financial success in today’s complex landscape.
Stay ahead of the curve—watch the full video update now and prepare for what’s to come in the second half of 2025!
Most sincerely,
Peter Goodburn
Founder and Chief Elliott Wave Analyst
WaveTrack International
Contents Stock Indices Mid-Year Video Update 2025
Charts: 110 | Video: 2 hours 30 mins.
ONLY FOR CLIENTS outside the EU – SELECT YOUR PACKAGE
Single Video – *$55.00 – PART I Stock Index Mid-Year Video Uptrend 2025 (June ’25) or send us an email to services@wavetrack.com
Triple Package offer – *$111.00 (saving!)! – PART I – PART II – PART III (June – August ’25)
*(additional VAT may be added depending on your country – currently US, Canada, Asia have no added VAT but most European countries do)
PARTS II & III will be available in a few weeks’ time – we’re working on it!
HOW CAN YOU RECEIVE THE VIDEO FORECAST within the Europeean Union?
– If you are a EU client contact us under services@wavetrack.com so that we can issue you a quote with added VAT! Sorry for the extra step but it is European tax law. Thank you for your understanding!
– Alternatively, if you like to pay via credit card, we are very happy to send you a credit card payment link – contact us via email to services@wavetrack.com/
*(additional VAT may be added depending on your country of residence. Currently, the US, Canada, Asia have no added VAT except EU countries)
To receive your VIDEO UPDATE please use this instant PayPal payment link for US, UK, Australian and international customers click here.
– Or opt for the TRIPLE PACKAGE for USD *111.00 in total?
– As soon as we receive payment either via the instant PayPal payment link or via the credit card link we provide you with the video link & PDF report once payment is confirmed. Please know the reply can take up to 6 hours. But rest assured we will give our best to provide you with the information as soon as possible!
We’re sure you’ll reap the benefits – don’t forget to contact us with any Elliott Wave questions – Peter is always keen to hear your views, queries, and comments.
Visit us @ www.wavetrack.com
Currencies + Interest Rates Outlook 2025 PART III/III
by WaveTrack International| March 3, 2025 | No Comments
We’re pleased to announce the publication of WaveTrack’s annual Triple Video Outlook 2025 of medium-term ELLIOTT WAVE price-forecasts. Today’s release is PART III, CURRENCIES + INTEREST RATES.
• PART I – STOCK INDICES – out now!
• PART II – COMMODITIES – out now!
• PART III – CURRENCIES + INTEREST RATES – out now!
Now, let’s look at some of the Currencies + Interest Rates Outlook Highlights that are crucial to know during this economic timeline…
Currencies + Interest Rates Highlights
…
The Rise & Fall of King Dollar – Major Market Shifts Ahead
For decades, the U.S. dollar has reigned supreme as the world’s dominant currency. However, significant macroeconomic and geopolitical shifts are now setting the stage for a potential decline. Our latest Currencies & Interest Rates Video provides a comprehensive analysis of this unfolding trend, offering key insights into global markets, currency movements, and interest rate expectations for 2025 and beyond.
Is the Dollar’s Dominance Coming to an End?
The Federal Reserve’s interest rate policy has long played a crucial role in supporting the strength of the U.S. dollar. However, as G10 central banks resume their rate-cutting cycles while the Fed hesitates, the balance of power is shifting. With U.S. debt spiraling out of control and growing concerns about de-dollarization, confidence in the greenback is waning. Will the Federal Reserve be forced into action? Our analysis highlights the key scenarios that could unfold.
Recession Risks vs. Inflation Pressures – What Comes Next?
The global economy stands at a crossroads. While recession risks remain high following the yield curve inversions of 2022-23, inflationary pressures could resurface due to new tariff policies under the Trump administration. This presents a major dilemma for the Fed: cut rates to support growth, or hold firm to prevent inflation from reigniting? Meanwhile, central banks worldwide are adjusting their policies in response to shifting economic conditions.
Our video explores:
✔️ US Interest Rates & Federal Reserve Policy – Where are rates heading next?
✔️ Stagflation or Recession? – Key indicators to watch.
✔️ Global Debt Concerns – How rising debt levels could reshape monetary policy.
Currency Markets: A Major Realignment is Underway
A weakening dollar doesn’t just impact the U.S. economy—it has far-reaching implications for global currency markets. Our Elliott Wave analysis indicates that the US dollar index is entering a long-term corrective decline, setting the stage for:
✔️ Stronger Euro & Japanese Yen – Key technical patterns indicate major upside potential.
✔️ BRIC Currencies on the Rise – Emerging markets are gaining strength against the USD.
✔️ Major Currency Crosses in Focus – Euro/GBP, Euro/JPY, and more.
Bitcoin & Cryptos: The Next Big Move
The crypto market continues to evolve, with Bitcoin’s long-term uptrend intact and price targets extending towards 929k. Our detailed charts highlight the next key levels for Bitcoin, Ethereum, and other major digital assets. Could Ethereum soon outperform Bitcoin? Our Elliott Wave projections reveal critical insights for traders and investors.
A Must-Watch for Traders & Investors
Understanding the larger macro trends is essential for making informed trading and investment decisions. Our Currencies + Interest Rates Video Outlook 2025 provides an unparalleled perspective on the markets, combining Elliott Wave Theory, Fibonacci-Price Ratios, and Cyclical Analysis to forecast major moves across asset classes.
Gain expert insights on:
✔️ The evolving US Dollar cycle and its impact on global currencies.
✔️ Interest rate trends and what central banks are likely to do next.
✔️ Opportunities in crypto markets as Bitcoin and Ethereum set up for their next moves.
Stay ahead of the markets with WaveTrack’s cutting-edge analysis. Join us today and gain the insights you need for 2025 and beyond!
Most sincerely,
Peter Goodburn
Founder and Chief Elliott Wave Analyst
WaveTrack International
What you get
Contents: 142 charts | VIDEO DURATION: nearly 2 hours 39 mins.
The contents of this CURRENCIES & INTEREST RATES VIDEO include Elliott Wave analysis for:
Forex (96 charts):
• Developed Market Interest Rates
• G10 Central Bank Policy
• Scenarios for the US Economy…
• US Yield Curve
• De-Dollarisation
• US$ Index + Cycles
• USD COT
• Euro/US$
• EUR COT
• Stlg/US$
• STLG COT
• US$/Yen
• YEN COT
• CHF COT
• US$/CHF
• US$/NOK
• US$/SEK
• AUD/US$
• AUD COT
• US$/CAD
• CAD COT
• NZD/US$
• NZD COT
• Euro/Stlg
• Euro/CHF
• Euro/Yen
• AUD/YEN
• USD/BRL
• USD/RUB
• US$/ZAR
• US$/MXN
• USD/ILS
• Asian ADXY
• US$/Renminbi
• US$/KRW
• US$/SGD
• US$/INR
• US$/TWD
• USD/THB
• US$/MYR
• US$/IDR
• US$/PHP
• Bitcoin
• Ethereum
Interest Rates (46 charts):
• US10yr Yield + Cycle
• US2yr Yield
• US30yr Yield
• US2yr-10yr Yield Spread
• US10yr-30yr Yield Spread
• US10-DE10yr Yield Spread
• DE10yr Yield
• DE2yr Yield
• UK10yr Yield
• Australia 10yr Yield
• Canada 10yr Yield
• Japan 10yr Yield
How to buy the Currencies + Interest Rates Video Outlook 2025
Simply click on this PayPal Payment link to purchase the CURRENCIES + INTEREST RATES Video Outlook 2025 for USD 55.00 (+ VAT where applicable) or alternatively our Triple Video Offer for USD 111.00 (+ VAT where applicable) – Get WaveTrack’s Stock Indices Video PART I here and the Commodities Video PART II here.
If you prefer to pay via a secure Credit Card payment link please contact us @ services@wavetrack.com ! Many thanks.
*(additional VAT may be added depending on your country – currently US, Canada, Asia have no added VAT but most European countries do)
We’re sure you’ll reap the benefits – don’t forget to contact us with any Elliott Wave questions – Peter is always keen to hear you views, queries and comments.
Visit us @ www.wavetrack.com
Elliott Wave Hub Event Invitation!
by WaveTrack International| February 20, 2025 | No Comments
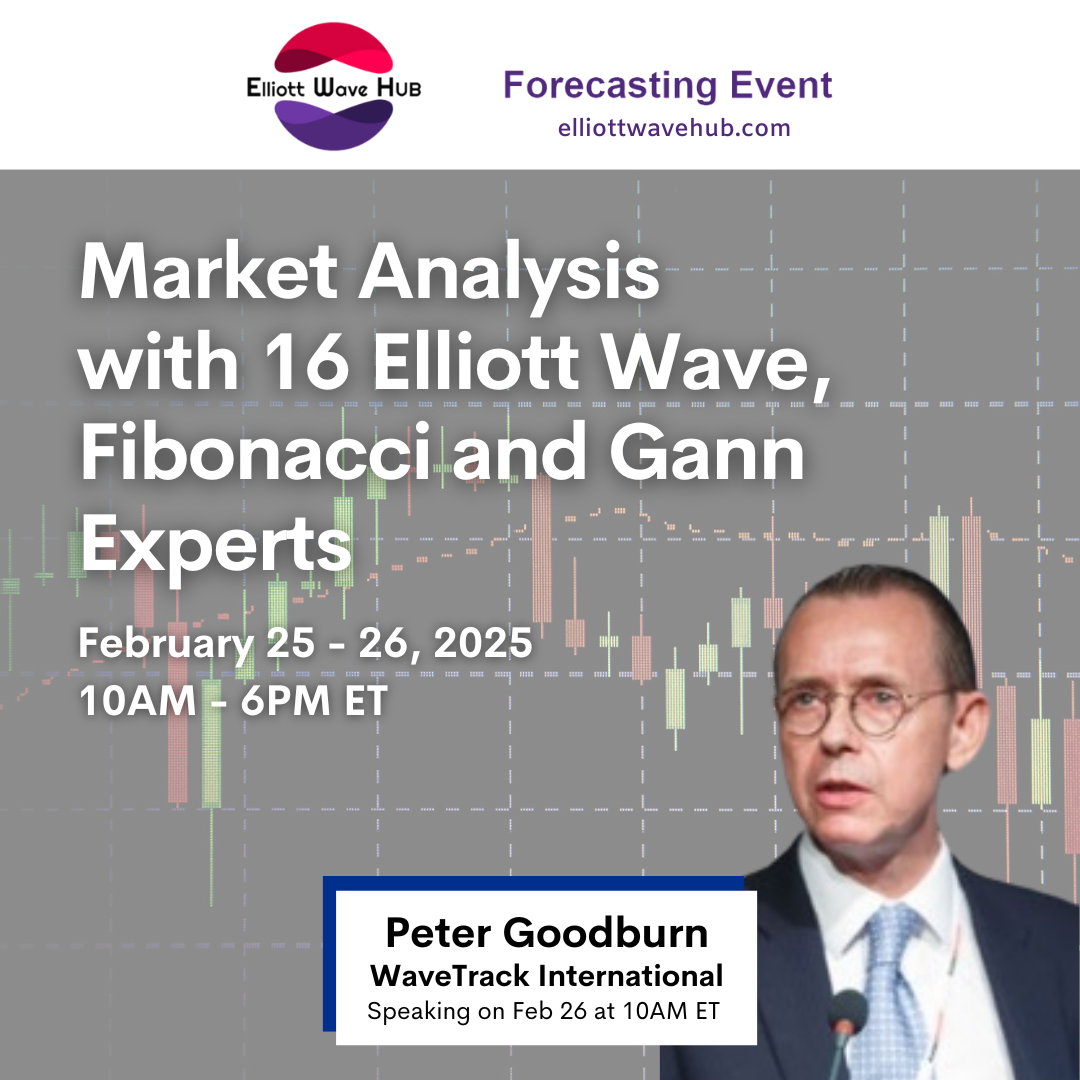
Elliott Wave Hub Event
Elliott Wave analysis is possibly THE most powerful means of predicting market movement. The question is, are you harnessing that power?
Join Peter Goodburn and 15 other Elliott Wave, Fibonacci and Gann experts on Tuesday, February 25th and Wednesday, February 26th from 10am-6pm ET for the Elliott Wave Hub Forecasting event, a unique market analysis event.
This event has come a long way since we started in 2020, and for this milestone, we’re expanding it to a 2-day event and incorporating the incredible power of Fibonacci and Gann analysis!
We’ll show you exactly how you can use the same type of Elliott Wave analysis that is used by most big banks and institutions to profit consistently in your account. We’ll be looking at LIVE MARKETS on Stocks and Options, Forex, Futures and Cryptos…
Why join this workshop?
• Top Experts: Learn directly from world-renowned Elliott Wave, Fibonacci and Gann professionals. See their long-term perspectives on the markets you watch and trade.
• Live Market Analysis: We’ll explore the hottest markets (Stocks and Options, Forex, Futures and Cryptos) in real-time to uncover actionable trade opportunities.
• Practical Trade Ideas: Gain strategies and techniques you can use immediately to enhance your trading.
• Entries & Exits: Discover reliable methods to find the best trade setups, including entries, stop losses, and profit targets.
• Simplified Wave Counting: Learn an easy, effective way to count waves and simplify your trading.
• Cutting-Edge Tools: Experience the latest innovations in Elliott Wave software for faster, more efficient analysis.
BONUS: Space is limited, and we’ll also be giving away FREE GIFTS during the event—but you have to attend to qualify!
Let’s make this 10th Elliott Wave Hub an unforgettable experience.
I’ll see you there!

Recent Posts
Recent Comments
Archives
- July 2026
- June 2026
- February 2026
- December 2025
- August 2025
- July 2025
- June 2025
- March 2025
- February 2025
- January 2025
- December 2024
- August 2024
- July 2024
- June 2024
- May 2024
- April 2024
- February 2024
- January 2024
- December 2023
- August 2023
- July 2023
- June 2023
- March 2023
- February 2023
- January 2023
- December 2022
- November 2022
- October 2022
- August 2022
- July 2022
- June 2022
- May 2022
- March 2022
- February 2022
- January 2022
- December 2021
- August 2021
- July 2021
- June 2021
- March 2021
- February 2021
- January 2021
- December 2020
- November 2020
- August 2020
- July 2020
- June 2020
- May 2020
- April 2020
- March 2020
- February 2020
- January 2020
- December 2019
- October 2019
- September 2019
- July 2019
- June 2019
- May 2019
- April 2019
- March 2019
- February 2019
- January 2019
- December 2018
- November 2018
- September 2018
- August 2018
- July 2018
- June 2018
- May 2018
- April 2018
- March 2018
- February 2018
- January 2018
- December 2017
- November 2017
- October 2017
- September 2017
- August 2017
- July 2017
- June 2017
- May 2017
- March 2017
- February 2017
- January 2017
- December 2016
- November 2016
- October 2016
- September 2016
- August 2016
- July 2016
- June 2016
- May 2016
- April 2016
- March 2016
- February 2016
- January 2016
- December 2015
- November 2015
- October 2015
- September 2015
- August 2015
- July 2015
- June 2015
- May 2015
- April 2015
- March 2015
- February 2015
- January 2015
- December 2014
- November 2014
- October 2014
- September 2014
- August 2014
- July 2014
- June 2014
- May 2014
- April 2014
- March 2014
- February 2014
- January 2014
- December 2013
- November 2013
- October 2013
- September 2013
- August 2013
- July 2013
- June 2013
- May 2013
- April 2013
- March 2013
- February 2013
- January 2013
- December 2012
- November 2012
- October 2012
- September 2012
- August 2012
Categories
- ADXY Index
- Agnico Eagle Mines
- AI Artificial Intelligence
- Alcoa
- Amazon
- AngloGold Ashanti
- Antofagasta
- APPL
- Apple
- ASX 200
- AUD vs USD
- AUDNZD
- AUDUSD
- Australia ASX 200
- Baltic Dry Index
- Banking
- Base Metals
- Biotechnology
- Bitcoin
- Bovespa
- Broadcom
- Campanhia Siderugica
- Catalexit
- central banks
- Christmas
- Commodities
- Commodities Video Outlook
- Commodities Video Outlook 2020
- Conference
- Copper
- Coronavirus Sell-Off
- CRB
- Crude oil
- crude oil price chart
- CryptoCurrency
- Currencies
- Currencies + Interest Rates Video Outlook
- Cycles
- Dax 30
- deutsche bank
- Dewey Cycle
- DJ Transportation Average
- DJ Utilities
- Dow Jones 30
- Dow Theory
- ECB
- economy
- Elliott Wave
- Elliott Wave Charts
- Elliott Wave Patterns
- Elliott Wave Principle
- Emerging Markets
- Ending-Diagonal Elliott Wave Pattern
- Equity
- EUR vs CHF
- EUR/USD
- Euro / US$
- Eurostoxx 50
- EuroStoxx50
- EuroStoxxBanks
- EURUSD
- Expanding Flat Pattern
- FAAMG
- FANG+
- fib-price-ratio
- Fibonacci Trading
- Fibonacci-Price-Ratio
- Financial Forecasting
- Fixed Income
- forex
- Fortescu Metals
- Freeport McMoran
- FTSE 100
- Fund Management
- FX
- FXStreet
- GBP/AUD
- GBP/USD
- GDX
- GDXJ
- Gerdau Steel
- Germany 10 year Euro Bund future
- Gilead Sciences
- Glencore
- Global Economy
- Gold
- Gold Mining
- Golden Ratio
- goldman sachs
- Google Inc.
- Google/Alphabeth
- Greek debt crisis
- Hang Seng
- Harbinger
- Hungarian Forint
- IBEX 35 Index Spain
- Independent Research
- India-CNX Nifty 50
- Interest Rates
- Interview
- IRP Independent Research
- kbw bank index
- Lonmin
- MAG-7
- McDonald's
- MID-YEAR VIDEO UPDATE!
- Mifid II
- Mines
- Mining
- MSCI China
- MSCI Emerging Markets
- Nasdaq 100
- Nasdaq Biotechnology Index
- Nasdaq Composite
- Nasdaq100
- Netflix
- Newmont Mining
- Nikkei 225
- NVIDIA
- NYSE Composite Index
- Palladium
- Platinum
- Precious Metals
- Ralph Nelson Elliott
- Reversal-Signature
- Russell 2000
- Russia RTS
- S&P 500
- Sector
- Secular-Bull
- Sentiment Survey
- Shanghai Composite Index
- Silver
- Slanting Flat Elliott Wave Pattern
- SP100
- SP400 Mid-Cap
- SP500
- SPX 500
- STLG/AUD
- Stlg/US$
- STLG/USD
- STLG/YEN
- STLG/ZAR
- Stock Index
- Stock Index Tracking
- Stock Index Video
- Stock Indices
- Stock Indices Video Outlook 2023
- Stock Indices Video Outlook 2025
- Sugar
- Summary
- Tesla
- Tesla Inc
- Toyota
- Track Record
- trading
- Trusts
- Tutorial
- Uncategorized
- UniCredit
- US
- US Dollar Index (DXY) (USDX)
- US$ Index
- US-Dollar Index
- US10yrYields
- USD
- USD/ARS
- USD/CNY
- USD/IDR
- USD/INR
- USD/MXN
- USD/SGD
- USD/THB
- USD/YEN
- USD/ZAR
- Vale
- Value Line Index
- video
- VIDEO OUTLOOK 2018
- VIDEO OUTLOOK 2020
- VIX
- W.D. Gann
- WaveTrack International
- XAU Gold/Silver Index
- Xetra Dax
- XOP
- Yields
- Zig Zag
- Zinc
- ‘INFLATION-POP’
- ‘SHOCK-POP-DROP’