SP500 – Approaches Upside Targets!
by WaveTrack International| October 30, 2019 | 22 Comments
SP500 – Leading/Expanding-Diagonal Approaches Upside Targets!
Read more «SP500 – Approaches Upside Targets!»
Russia RTS Index – Decline Underway?
by WaveTrack International| October 3, 2019 | 2 Comments
Russia RTS Index – Decline Underway Towards 1171.00+/- but Downside Risk to 990.00+/-
Two Elliott Wave pattern developments dominate the short-term picture over the next few months – both confer a decline to minimum levels of 1171.00+/- but there is also a heightened downside risk of a sustained decline towards 990.00+/- as the concluding sequence of an a-b-c running flat pattern that began from the Jan.’17 high. The medium-term outlook remains very bullish with outperformance forecast during the next few years.
The Russia RTS is a favourite of ours, mainly because it fits the pattern schematic of the A-B-C ‘Inflation-Pop’ from its financial-crisis low of 493.00 but also because its upside potential as primary wave C is huge during the next several years.
Wave C’s uptrend must ultimately develop into a five wave impulse pattern, labelled (1)-(2)-(3)-(4)-(5). A 2nd wave correction as a subdivision within intermediate wave (3) began from the Jan.’17 high of 1197.00. It was originally identified as completing an a-b-c running flat pattern into the Dec.’18 low of 1033.00, the same time that U.S. indices, including the S&P 500 ended their corresponding expanding flat patterns.
But the following advance into the July ’19 high of 1414.00 is problematic. It’s difficult to identify this upswing as unfolding into a five wave impulse pattern. However, this irregularity in identification opens the way for two developing scenarios. Although, both confer a more immediate short-term decline testing levels towards 1171.00+/-.
Russia RTS Index – Count #1
Count #1 – the Dec.’18 advance from 1033.00 to July’s high of 1414.00 unfolded into a five wave sequence. A counter-trend corrective downswing is currently engaged, targeting levels towards 1171.00+/-. See fig #1.
Russia RTS Index – Daily – Financial Forecasting by WaveTrack International
Russia RTS Index – Count #2
Count #2 – this scenario depicts the continuation of the a-b-c running flat pattern that began the corrective downswing from the Jan.’17 high of 1197.00. Wave b has unfolded higher into a multi-year double zig zag pattern ending last July at 1414.00 – wave c must now develop lower into a five wave impulse pattern with an ultimate task or revisiting the 2017 low of 959.00+/-. Fib-price-ratio targets are towards 990.00+/-. See fig #2.
Russia RTS Index – Daily – Count #2 – Financial Forecasting by WaveTrack International
Conclusion
The Russia RTS’s pattern development from its June ’17 low in incredibly complex. Hence, two ongoing scenarios. But when juxtaposed to each other, both confer a minimum downside risk towards 1171.00+/-. Most importantly, this is in alignment with expectations of deeper corrective declines emerging from U.S./European indices. A time horizon is into the Jan/Feb.’20 period.
Doomsday Dollar, FT and Peter Goodburn
by WaveTrack International| October 1, 2019 | 4 Comments
US Dollar Highlight – This is Peter Goodburn’s response to a Financial Times article published in Monday’s newspaper entitled ‘The Doomsday Dollar Scenario’ by Rana Foroohar
Monday 30th September 2019
Dear Ms. Foroohar,
Just read your article on the US$ Dollar. Your reference Ulf Lindahl at AG Bisset as your source but notice you also build an interesting hypothesis around his idea that the US$ dollar would decline around 50-60% per cent whilst U.S. stock markets begin a generational decline.
WaveTrack is an Independent Research Provider and we specialise in price-forecasting. For price itself, we model the Elliott Wave Principle. And for timing, Cycle Analysis from Edward Dewey’s Foundation for the Study of Cycles model. Above all, both confirm what AG Bisset has hypothesised. The dollar’s decline resumed its 15.6-year cycle in late-2016. Actually, this next decline is its half-cycle interval of 7.8-years – see attached cycle chart (report dt. June 30th 2019, fig #125).
US Dollar Cycle – Monthly – WaveTrack International Financial Forecasting
Basis EWP model, downside targets for the benchmark US$ dollar index are towards 49.35+/- during this next 7.8-year cycle downtrend – see attached, $indx190806.
US Dollar Index – Monthly – WaveTrack International Financial Forecasting
US Dollar, the Elliott Wave Principle and Cycle Analysis
The only aspect that seems unlikely basis EWP and Cycle Analysis is that U.S. stock markets begin to trend lower now. Our ‘Inflation-Pop’ hypothesis which we’ve had in place since late-2010/early-2011 remains on course where U.S. stock markets remain in a secular-bull uptrend until its next cycle peak is due, sometime in year-2023 – see attached cycle chart (report dt. Dec. 27th 2018, fig #12).
Dow Jones – Quarterly – Cycles – by WaveTrack International
US Dollar – Looking Ahead
Looking ahead, beyond year-2023, yes, U.S. stock markets are set to undergo a quantum shift in the way we’ve perceived investing for a generational term. But this seismic shift will most likely, decimate asset values right across the global horizon. Worst affected will be those economies with the largest debt ratios. Governments will most likely be forced to confiscate wealth in order to ensure survival. That means hitting those at the high-end of the wealth-scale first. Subsequently, taxing property ownership to the point which causes a house-price collapse, triggering an uptrend in interest rates too.
Our analysis leans heavily on long-term historical data. We have interest rate data going back to year-1727 (almost 300 years), the US$ dollar index data begins in year-1660 and stock market data beginning in year-1695.
Would be happy to engage if you would like to follow-up on this intriguing subject. In the meantime, please see our annual 2019 currency market report which is attached – very best wishes,
Peter Goodburn
Founder, Managing Director
WaveTrack International
A Regulated Investment Research Company – BaFin
More insights on US Dollar developments…
If you’d like to learn more about the ‘Shock-Drop-Pop’ and ‘Inflation-Pop’ scenarios, long-term Elliott Wave Analysis + Cycles, see our annual and mid-year reports below.
To review WaveTrack’s mid-year 2019 video-trilogy of long/medium-term ELLIOTT WAVE price-forecasts simply click the links, then follow the instructions!
• STOCK INDICES Mid-Year-2019-Video – PART I
• COMMODITIES Mid-Year-2019-Video – PART II
• CURRENCIES & INTEREST RATES Mid-Year-2019-Video – PART III
EuroStoxx + Xetra Dax – Can You Spot the EXPANDING FLAT Pattern?
by WaveTrack International| September 27, 2019 | No Comments
Eurostoxx 50 – Xetra Dax 30
Can You Spot the EXPANDING FLAT Pattern?
Wow! – it’s been a really busy summer!! – but very profitable too! Although attention is usually focused on the major U.S. indices like the S&P 500, even if you don’t trade positively-correlated indices from other countries, we always advise analysing them as if you were.
A good example was how two European indices, the Eurostoxx 50 and Xetra Dax 30 played out from May’s highs into August’s lows. Back in May/June, our Elliott Wave Navigator and Elliott Wave Compass reports had identified a corrective pattern unfolding from the May’s highs, as a developing 2nd wave correction. Can you spot what pattern that is? – Yes, an expanding flat!
The expanding flat is a three wave sequence, A-B-C subdividing 3-3-5. For the Eurostoxx 50, (A)-(B)-(C) where wave (A) sets the initial price-range – to fulfill the pattern, waves (B) and (C) must marginally complete beyond wave (A)’s range whilst unfolding into a three and five wave sequence. If those conditions, those requirements are met, then the pattern can complete and is validated at predetermined fib-price-ratio levels – see figs #1 & #2.
EuroStoxx 50 Track Record by WaveTrack International
Basis charts in report/s dt. June 26th, wave (B) upside targets for the Eurostoxx 50 were towards 3530.00+/-, to max. 3559.00+/- then a five wave impulse decline to begin declines as wave (C) towards 3210.00+/-. The actual high for wave (B) was 3569.00 and the low for (C) at 3231.00.
Xetra Dax Track Record by WaveTrack International
The Xetra Dax had minor wave b. upside targets towards 12602.00+/-, max. 12821.00+/- then a five wave impulse decline to begin declines as wave c. towards 11399.00+/-. The actual high for wave b. was 12650.00 and the low for c. at 11257.00.
Conclusion
The completion of these expanding flat patterns was also replicated in London’s FTSE-100 index. Moreover, it gave validation that other major indices, like the benchmark S&P 500 would also stage a reversal-upswing in August, despite unfolding into a slightly different corrective pattern. This affirms our belief that trading a set of indices should be supported by analysing other related groups too!
Find out what WaveTrack’s latest EuroStoxx and Xetra Dax forecasts are and subscribe to the Elliott Wave Compass report.
The ELLIOTT WAVE COMPASS report focuses on the shorter-term perspective of price development comprising of two online updates per week describing and illustrating a cross-section of market trends/counter-trends for stock indices, bonds, currencies and commodities from around the world. This report is ideal for professional and private clients trading a time horizon of a just a few days to a few weeks ahead.
The bi-weekly EW-Compass report offer short-term perspective for global markets
· Stock Indices
· Bonds
· Currencies (FX)
· Commodities
If you like to know more details about the Elliott Wave Compass report and what contracts are covered please https://www.wavetrack.com/products/elliott-wave-compass.html
New CURRENCIES Mid-Year Video Update! PART III/III
by WaveTrack International| July 24, 2019 | No Comments
Currencies and Interest Rates H2-2019 Video – PART III/III
We’re pleased to announce the publication of WaveTrack’s mid-year 2019 video updates of medium-term ELLIOTT WAVE price-forecasts. Today’s release is PART III, CURRENCIES & INTEREST RATES – Parts I & II were released in June/early-July
• PART I – STOCK INDICES – out now!
• PART II – COMMODITIES – out now!
• PART III – CURRENCIES & INTEREST RATES – out now!
Currencies Review – H1 2019
January/February’s annual report began by forecasting US$ dollar strength, currency weakness across-the-board. This was based upon the incomplete a-b-c zig zag advance in the US$ dollar index from its Feb.’18 low of 88.26. Upside targets to complete minor wave c. were towards 102.79+/- and six-months on, that’s still the current outlook.
The last several months has seen a gradual push higher for the dollar, but each time it has attempted to break to a higher-high, it has fallen back inside the preceding trading range. But importantly, it has produced higher-lows together with higher-highs which maintains wave c.’s five wave impulse uptrend. We can look back over the first-half of the year and say that nothing too much has developed, but that’s certainly not the case going forward, for the next 6-month period.
Currencies – Key Drivers/Events for H2 2019
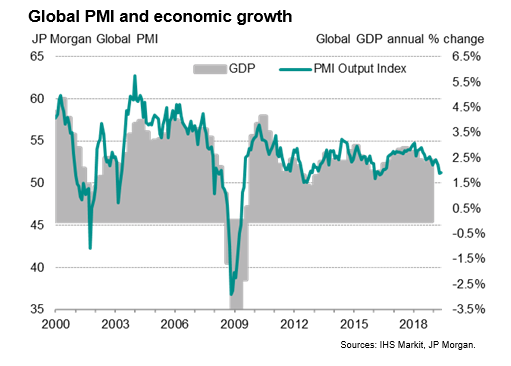
The most important event gripping the headlines revolves around expectations of a mild global recession. The latest Global Purchase Managers’ Index (PMI) from JP Morgan/IHS Markit shows economic activity continuing to oscillate towards a 3-year low.
That fact has not gone amiss with central banks. The European Central Bank and the Federal Reserve have both reiterated their commitment to ease back on monetary tightening policies with interest rate cuts, as necessary. Investors are watching how the trade negotiations are developing between the U.S. and China, but also Europe as the U.S. threatens to slap tariffs on European car imports.
Significance of the Inflation-Pop
From an Elliott Wave perspective, the slowdown in economic activity is expected to be simply a temporary dip within the larger ‘INFLATION-POP’ event. The ‘inflation-pop’ is the second event within the multi-decennial ‘SHOCK-POP-DROP’ deflationary cycle. The ‘inflation-pop’ began lifting asset prices higher following the end of the 2007-09 financial-crisis. Central banks added monetary liquidity that forced sharp asset price rises in the following years to this day.
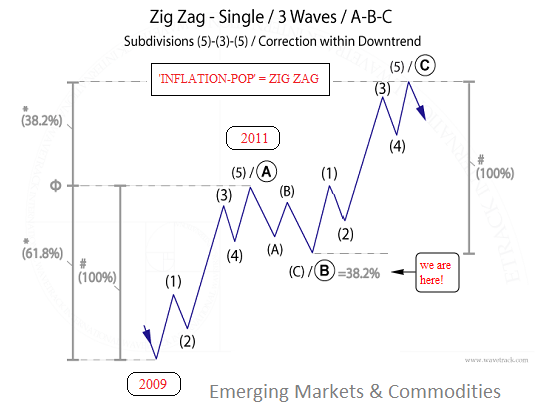
Shock-Pop-Drop
The Shock-Pop-Drop can be visualized as an Elliott Wave expanding flat pattern, A-B-C – the ‘Inflation-Pop’ is simply wave B, itself unfolding in an upward direction as a primary degree zig zag pattern, A-B-C. Primary wave A represents the way asset values trended higher from the financial-crisis lows but ending into the peak in early-2011. Wave B then declined afterwards, but a retracement of wave A’s preceding advance – by necessity, wave B’s retracement is only a partial regression so it must end above the 2009 lows of wave A.
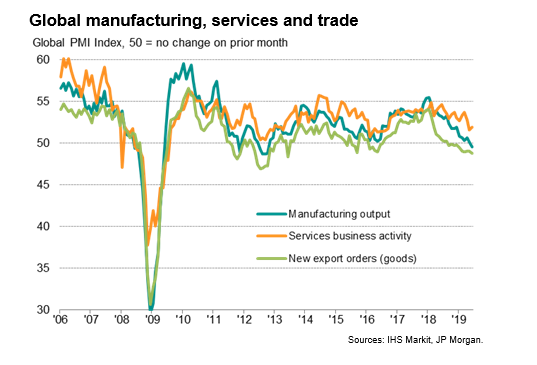
If you take a look at the JP Morgan/IHS Markit global PMI and the related Manufacturing/Services & Trade chart (see above), you’ll see the primary degree zig zag in upward progress from the 2009 lows. The peaks in 2010/11 complete primary wave A but wave B is still engaged to the downside, but is attempting to complete before year-end 2019. Levels might break slightly below the initial lows of 2013, but not too far – but afterwards, turning higher to begin primary wave C’s advance.
From this we can discern that the global economy will tick lower through H2-2019 into year-end, which is expected to have the effect of pushing the US$ dollar higher during the same period. Why is that? Mainly because a dip in the economies will prompt safe-haven buying of the US$ dollar, especially since Elliott Wave analysis expects U.S. stock markets to undergo a -11% per cent correction into year-end. But also because of interest rate differentials – the Euro currency is attracts negative interest rates, as does the Yen. That’s a huge premium for the US$ dollar.
EW-Forecasts H2 2019
For more detailed analysis, please view the video/report
Bitcoin
Crypto Currencies like Bitcoin have trended exponentially higher since ending 4th wave corrective lows last December. Our latest Elliott Wave analysis updates the medium-term outlook, Bitcoin’s uptrend over the next several years. Amazingly, it projects an uptrend towards some astonishingly high levels!! – this is going to be quite a journey!
Interest Rates Review – H1 2019
The year began with US30yr yields at 3.000% per cent, US10yr at 2.700% per cent and forecasts down to 2.690+/- and 2.075+/-. That seemed enough to depict a counter-trend correction unfolding from the late-2018 highs. Yields have since traded even lower, to 2.465% and 1.939% but they’re still counter-trend declines!
The big clues on interest rate direction comes from the fact that the 60-year cycle in AAA Corporate Bond Yields is very rhythmic, oscillating at 30 to 35-year sub-intervals from peak-to-trough-to-peak etc. The last cyclical peak occurred back in 1981 – thirty-five years later, the next cycle-trough bottomed in July 2016, at least for the long-end yields. It would take a phenomenal feat for interest rates to break back below those lows during 2019’s declines because the next 30-35 year cycle is already exerting its influence higher.
Interest Rates – Key Drivers/Events for H2 2019
This year’s corrective declines in underlying U.S. and European interest rates are expected to continue even lower than original downside targets. A global downturn in economies is being exacerbated by U.S. President Trump’s trade war with China and its allies, Japan, Europe, Canada and Mexico.
The IMF has just published its latest World Economic Outlook paper – it summarises ‘global growth forecast at 3.2% per cent in 2019, picking up to 3.5% per cent in 2020 (0.1 percentage point lower than in the April WEO projections for both years). GDP releases so far this year, together with generally softening inflation, point to weaker-than-anticipated global activity’. It highlights weak final demand, soft global trade and muted inflationary pressures.
EW-Forecasts H2 2019
For more detailed analysis, please view the video/report
New Currencies and Interest Rates H2-2019 Video – PART III/III
This MID-YEAR 2019 VIDEO UPDATE for CURRENCIES & INTEREST RATES is unique to WaveTrack International, how we foresee trends developing through the lens of Elliott Wave Principle (EWP) and how its forecasts correlate with cycles and Fibonacci price ratios.
We invite you to take this next step in our financial journey with us – video subscription details are below – just follow the links and we’ll see you soon!
Most sincerely,
Peter Goodburn
Founder and Chief Elliott Wave Analyst
WaveTrack International
What you get
Contents: 68 charts | Video duration: 1 hours 45 mins.
The contents of this CURRENCY & INTEREST RATES VIDEO include Elliott Wave analysis for:
• US$ index + cycle
• Euro/US$ + cycle
• Stlg/US$
• US$/YEN
• US$/CHF
• AUD/US$
• NZD/US$
• US$/CAD
• Euro/CHF
• Euro/Stlg
• Euro/YEN
• Stlg/YEN
• Stlg/ZAR
• Stlg/AUD
• Asian ADXY
• US$/IDR
• US$/MXN
• US$/TRY
• US$/ZAR
• US$/BRL
• US$/RUR
• US$/YUAN
• US$/PLZ
• Bitcoin
Interest Rates:
• U.S. AAA+ 30-Year Corporate Bond Yields
• US30yr Yield + cycle
• US10yr Yield
• US10yr TIPS Break-Even Inflation Rate
• DE10yr Yield
• ITY10yr Yield
• JPY10yr Yield
CONTACT US NOW VIA EMAIL – SELECT YOUR PACKAGE
Single Video – *$48.00 – PART III Currencies + Interest Rates Video 2019 (July ’19)
Triple Package offer – *$96.00 (saving 33%)! – PART I – PART II – PART III (June – July ’19)
*(additional VAT may be added depending on your country – currently US, Canada, Asia have no added VAT but most European countries do)
HOW CAN YOU RECEIVE THE VIDEO FORECAST?
To receive your VIDEO UPDATE please click here to contact us.
– Or opt for the TRIPLE PACKAGE for USD *96.00 in total?
– Next we will send you a PayPal payment request and provide you with the video link & PDF report once confirmed.
– Alternatively, we can process credit card payments for you as well – please contact us. Thank you.
*(additional VAT may be added depending on your country of residence. Currently, the US, Canada, Asia have no added VAT. However, most European countries do)
We’re sure you’ll reap the benefits – don’t forget to contact us with any Elliott Wave questions – Peter is always keen to hear you views, queries and comments.
Visit us @ www.wavetrack.com
New Commodities 2019 Video Update!
by WaveTrack International| July 8, 2019 | No Comments
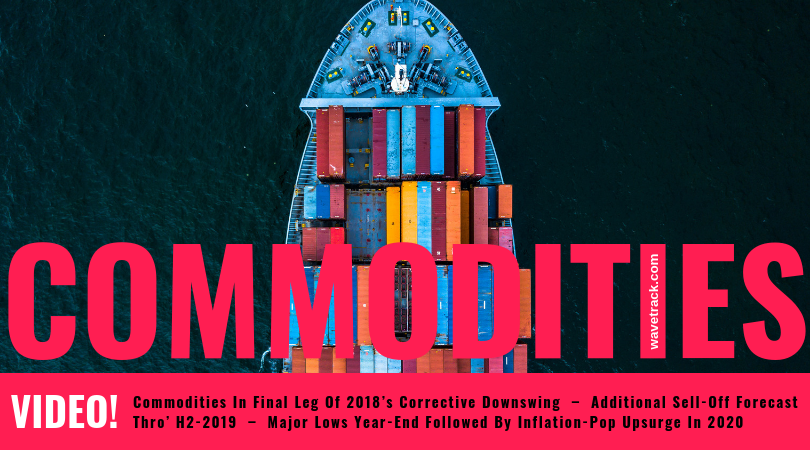
Commodities In Final Leg Of 2018’s Corrective Downswing – Additional Sell-Off Forecast Thro’ H2-2019 – Major Lows Year-End Followed By Inflation-Pop Upsurge In 2020
INCLUDES ANALYSIS ON MEDIUM-TERM CYCLES & EQUITY MINERS
New Commodities 2019 Mid-Year Video Series | PART II/III
We’re pleased to announce the publication of WaveTrack’s mid-year 2019 video updates of medium-term ELLIOTT WAVE price-forecasts. Today’s release is PART II, COMMODITIES – Part I was released last month and Part III will be published later this month, in July.
• PART I – STOCK INDICES – out now!
• PART II – COMMODITIES – out now!
• PART III – CURRENCIES & INTEREST RATES – coming soon!
EW-Forecast Review – H1 2019
The Annual 2019 report published last February (2019) highlighted several main points. Base Metals were set to continue 2nd wave corrective downswings that began almost a year earlier, from the Jan.’18 highs. Copper, Aluminium, Lead and Zinc were all engaged in wave (2) downswings although only at the half-way stage. As barometers of the global economy, this was indicating a period when inflationary pressures that were beginning to build higher for the first time in a decade through 2016 were easing back for a while.
So far this year, benchmark Copper rallied higher into a correction from December ‘18’s low of 5725 ending into the April high of 6608. But prices have since resumed wave (2)’s downswing with a price decline towards 5740. And there’s more to come before year-end! Note the timing correlation with U.S. stock markets.
The same pattern development is unfolding in the other Base Metals, Aluminium, Lead, Zinc and Nickel.
The Next 6 Months?
The latest Elliott Wave patterns indicate some short-term upside potential but targets are limited. Especially, since analysis of the US$ dollar indicates the currency will significantly trend higher into year-end. The downside targets for Copper, Aluminium, Lead and Zinc vary, the smallest is -12% per cent, the largest is -19% per cent.
Base Metal Miners
The trade war initiated by U.S. President Trump with China continued through the first-half of this year but this had little impact for the equity markets. January/February’s forecasts for the benchmark XME Metals & Mining index included an initial downswing from 28.21 to targets of 24.12+/-, ending the entire correction from 2018’s high of 39.62. The actual low traded in late-May to 24.25!! Prices have since trended higher to 28.00. This action was typical for several mining stocks. But one aspect which is recurring across those miners that are directly connected to the Copper sector is that more downside potential exists for the remains 6-month period of 2019.
Precious Metals
Over the last several years, two medium-term wave counts/scenarios exist for precious metals, one super-bullish, the other bearish. When the upside rallies occurred from the grand ‘Re-Synchronisation’ lows of 2016, gold advances by +30% per cent whilst some gold mining stocks rallied by +300% per cent, a 1:10 ratio. This level of underperformance in the underlying bullion price of gold and silver means there’s no longer a certainty they will undergo a sustained uptrend to new record highs during the final stages of the ‘Inflation-Pop’. Rather, they will participate in the next advances, but unfolding into corrective patterns, ending below those current historical highs of April/August 2011. Despite this, the mid-year report updates both scenarios.
Meanwhile, gold has attracted attention recently, since breaking above the 2016 high of 1375.27 but over the next 6-month period, Elliott Wave analysis predicts an initial extension higher, above 1500.00+/- but then a severe counter-trend downswing unfolding into year-end.
Silver has prolonged its 2016 downswing from 21.14 into last September’s (2018’s) low of 13.93 and whilst it is possible to construct an intermediate-term bullish count from this low, and the slightly lower-low of 13.89 traded last November, the following rally into February’s high of 16.22 and its subsequent decline into the late-May low of 14.29 is more leaning towards the confirmation that 2016’s double zig zag pattern is extending into a triple zig zag.
Platinum is positively correlated to silver and is also extending its decennial A-B-C zig zag pattern unfolding lower from historical highs traded back in March ’08 when it was at 2304.00. Downside targets for wave C require a break below wave A’s low of 732.50.
Palladium has been one of the star outperformers since bottoming in Jan.’16 at 450.67 and price rises have continued until reaching a high last March at 1624.33. This began a counter-trend 4th wave correction beginning with a decline of -22% per cent but all of this has since been recovered with a current reattempt of the highs. But another downswing is expected to get underway soon.
Precious Metal Miners
These are expected to outperform the underlying bullion price in the next phase of the ‘Inflation-Pop’ uptrend, due to resume later this year. But as bullion gold, silver, platinum, even palladium pull lower into year-end, so does a pause occur in the mining stocks.
In the shorter-term, further gains are expected in July/August but then turning lower afterwards to begin a correction. This report examines how deep those corrections can unfold.
Several precious metal mining stocks like Newmont Mining project uptrends towards 166.00+/- over the next several years (currently 38.30) although some form of correction is seen unfolding from current shorter-term upside targets. Other miners including Barrick Gold, Agnico-Eagle Mines, AngloGold Ashanti each have a similar wave count/structure to the GDX.
Commodities – Energy
There’s a certain fascination with the energy contracts of Crude & Brent oil because their price declines from the 2011 highs which coincided with Base/Precious Metal interim peaks within the ‘Inflation-Pop’ uptrend ultimately broke below the financial-crisis lows, unlike their commodity counterparts.
Crude oil
The low in Feb.’16 for Crude oil at 26.05 ended a zig zag downswing from the all-time-high of 147.27 traded in July ’08. That means the following advance from 26.05 is either a single zig zag as wave X ending into Oct.’18 high of 76.90 a developing double zig zag that ultimately extends to new record highs, at some stage over the next several years.
Our take on this depicts a double zig zag unfolding to record highs – why? Because it’s positively correlated to the driving force of the global economy, U.S. stock markets and eventually, a weakening US$ dollar. Stock markets are forecast to higher-highs over the next several years – the US$ dollar correspondingly engaged in a downtrend (notwithstanding the opposite moves during H2 2019).
The sharp decline from the Oct.’18 high of 76.90 began an X wave correction in the form of an A-B-C zig zag, but this remains incomplete. Downside targets are below last December’s low of 42.36 which can only mean one thing – a dip in global growth will limit consumption over the next 6-month period, pulling prices lower.
Brent oil
Brent oil has exactly the same rhythm as Crude oil. Brent formed its major low in Feb.’16 at 27.10 and is engaged in a cycle degree A-B-C-X-A-B-C double zig zag advance which ultimately projects prices trading to new record highs over the next several years.
Shorter-term however, a stronger US$ dollar through H2 2019 combined with a slowing of global growth pulls prices lower as wave X – downside targets are below the Dec.’18 low of 49.93.
XLE Energy index
One interesting contradiction comes from the XLE Energy index. Its Dec.’18 low at 53.36 ended a primary degree expanding flat correction which began from the Dec.’16 high of 78.45. Furthermore, the Dec.’18 advance into the May ’19 high of 68.81 completed the 1st wave of a new major uptrend and this was followed by a zig zag correction ending just recently, at the end-May low of 58.77. That ended a 2nd wave retracement at the exact fib. 61.8% level, confirming the next stage of its 3rd wave uptrend has already begun. Some pullback can be expected over the shorter-term horizon, perhaps reattempting the 58.77 low if Crude/Brent stage expected declines, although not breaking below that support. But it does question the validity of the comparably larger declines forecast for Crude/Brent oil through H2 2019.
Conclusions
As the second-half of 2019 gets underway, there are several aspects to be aware of. The first is the heightened probability that the US$ dollar will now accelerate higher by up to +7% per cent. Base Metals are still engaged in 2nd wave corrective downswings that began from the early-2018 highs. Precious Metals are set to pull lower over the next 6-months despite gold recently breaking above its 2016 highs. Crude and Brent oil have yet to complete zig zag downswings that began from their 2018 highs (similar pattern to Base Metals), requiring a modest break below last December’s lows.
The natural conclusion is that the global economy will take a dip in growth during the next 6-month period, causing stock markets to extend counter-trend declines that began from the early-May highs, triggering safe-haven buying of the US$ dollar and pulling economic-sensitive commodities lower in the process.
New Commodities H2-2019 Video – PART II/III
This MID-YEAR 2019 VIDEO UPDATE for COMMODITIES is like nothing you’ve seen anywhere else in the world – it’s unique to WaveTrack International, how we foresee trends developing through the lens of Elliott Wave Principle (EWP) and how its forecasts correlate with cycles across several sectors, Base Metals, Precious Metals & Energy.
We invite you to take this next step in our financial journey with us – video subscription details are below – just follow the links and we’ll see you soon!
Most sincerely,
Peter Goodburn
Founder and Chief Elliott Wave Analyst
WaveTrack International
Contents: 69 charts
• CRB-Cash index + Cycles
• Copper + Cycles
• Aluminium
• Lead
• Zinc
• Nickel
• Tin
• XME Metals & Mining Index
• BHP-Billiton
• Freeport McMoran
• Antofagasta
• Anglo American
• Kazakhmys Copper
• Glencore
• Rio Tinto
• Gold + Cycles
• GDX Gold Miners Index
• Newmont Mining
• Barrick Gold
• Agnico Eagle Mines
• AngloGold Ashanti
• Silver
• XAU Gold/Silver Index
• Palladium
• Platinum
• Crude Oil + Cycles
• Brent Oil
• XLE Energy SPDR Index
CONTACT US NOW VIA EMAIL – SELECT YOUR PACKAGE
Single Video – *$48.00 – PART II Commodities Video 2019 (July ’19)
Triple Package offer – *$96.00 (saving 33%)! – PART I – PART II – PART III (June/July ’19)
*(additional VAT may be added depending on your country – currently US, Canada, Asia have no added VAT but most European countries do)
PART III will be available in a few weeks’ time (February/March 2019!) – we’re working on it!
HOW CAN YOU RECEIVE THE VIDEO FORECAST?
To receive your VIDEO UPDATE please click here to contact us.
– Please state if you wish to purchase the SINGLE VIDEO – Commodities Video 2019 for USD *48.00?
– Or opt for the TRIPLE PACKAGE for USD *96.00 in total?
– Next we will send you a PayPal payment request and provide you with the video link & PDF report once confirmed.
– Alternatively, we can process credit card payments for you as well – please contact us. Thank you.
*(additional VAT may be added depending on your country of residence. Currently, the US, Canada, Asia have no added VAT. However, most European countries do)
We’re sure you’ll reap the benefits – don’t forget to contact us with any Elliott Wave questions – Peter is always keen to hear you views, queries and comments.
Visit us @ www.wavetrack.com
Stock Index Video PART I/III
by WaveTrack International| June 24, 2019 | 5 Comments
PART I – STOCK INDICES
Includes Elliott Wave Analysis of U.S., European, Asian and Emerging Market Indices
STOCK INDICES – MAY’s CORRECTIVE DOWNSWING SET TO CONTINUE LOWER FOR REMAINDER OF 2019!
U.S. Stock Indices Set for Concluding Downswing into Year-End – European Indices Continue May’s Correction – Rapid EM Decline due to Resurgent US$ Dollar – Asia Follows EM’s Lower
We’re pleased to announce the publication of WaveTrack’s mid-year 2019 video updates of medium-term ELLIOTT WAVE price-forecasts. Today’s release is PART I, STOCK INDICES – Parts II & III will be published during the next month.
• PART I – STOCK INDICES
• PART II – COMMODITIES
• PART III – CURRENCIES & INTEREST RATES
EW-Forecast Review – H1 2019
The Annual 2019 report published last January (2019) highlighted several main points. Contrary to consensus Elliott Wave and Economists’ opinion, the U.S. secular-bull uptrend remained in upward progress. Primary wave 5’s advance began from the ‘financial-crisis’ lows of 2008/09. Subdividing into a five wave pattern of intermediate degree, (1)-(2)-(3)-(4)-(5), wave (3)’s peak ended in early-2018. Also wave (4) was approaching a major low [we now know this ended into the late-December ’18 lows]. Finally, wave (5) would then begin one additional but final advance to record highs, but lasting the next several years targeting benchmark S&P 500 levels towards 4397.45+/- (that’s +52% per cent higher than today’s closing levels!!).
The ‘Inflation-Pop’ event first hypothesized back in early 2010 illustrates how central banks have inflated the price of things, stocks, bonds and commodities since the end of the ‘financial-crisis’ of 2008/09 in an attempt to prop-up economies to prevent them from imploding into a deflationary cycle.
With some certainty, derived from cross-correlation studies with European and Asian indices, U.S. markets are set for some extraordinary advances over the next few years. Positive correlations with mainstream commodities like Copper and Crude Oil support this forecast which is also backed-up by Elliott Wave pattern development in Emerging Market indices.
Main Theme’s & Drivers
There’s no doubt that U.S. trade policy led by President Donald Trump’s intention to reverse the 30-year decline of industry and manufacturing has led to protectionism and a potential trade war with China and most of its traditional allies. As a result trade tariffs with China focusing mainstream commodities and products has recently morphed into a technological trade war with China’s Huawei specifically targeted and China’s retaliation by banning exports of essential rare-earth metals.
Economists are continuing to remind us that an inverted yield-curve is signalling the onset of a recession. And more recently, international agencies like the International Monetary Fund (IMF) have warned that trade disputes will cause a drop of -0.5% per cent in global growth. So far economists are falling over each other to be first in downgrading their own growth targets.
The geopolitical environment is also fragile. There are sporadic reports that surface surrounding North Korea’s reactivation of nuclear facilities, U.S. pressure over Iran’s announcement that it intends to withdraw from the 2015 nuclear deal and tensions surrounding access through China’s ‘nine-dash’ demarcation line marking territorial waters in the South China Sea.
Despite these negative events, Elliott Wave analysis points towards the continuation of stock markets uptrends over the next few years. That just wouldn’t be possible if some geopolitical event was to trigger a military confrontation, or even a war – or perhaps some other exogenous event that hasn’t emerged so far – which means there’s a bright future ahead, once the short-term effects of a trade war and geopolitical tension are put aside. But what about the short-term implications of these current events?
What Next H2 2019?
The lows of December ’18 turned the corner for U.S. indices, ending 2018’s counter-trend declines – but not all global indices ended in similar fashion. European indices put in important lows but there are some Emerging Markets and Asian Indices where 2018’s corrections remain incomplete. These are set to extend lower into the second-half of 2019, already visible in January’s annual 2019 report. These up-coming declines are expected to drag U.S. indices lower in H2-2019 lasting until September/October. But as January’s forecasts anticipated, these declines would eventually give way to the next major uptrend.
Emerging Markets + Asia – Australia – Japan
Emerging Market indices offer revealing insights into future price direction, both in the short-term and the larger outlook over the next few years.
The benchmark MSCI EM index remains one of the key ‘Inflation-Pop’ archetypal patterns in development from the ‘financial-crisis’ lows of Dec.’08. Its advance is taking the form of a primary degree zig zag, A-B-C. Wave C’s final advance set for record highs over the next several years began from the grand ‘Re-Synchronisation’ lows of Jan/Feb.’16.
The advance as primary wave C must subdivide into an intermediate degree five wave impulse pattern, (1)-(2)-(3)-(4)-(5) and our default thinking is always attuned to an ‘expanding-impulse’ type pattern. But in actually fact, the initial 1st wave advance from 2016’s low exhibits three wave sequences ending into the Jan.’18 highs which confirms primary wave C is taking the form of a ‘diagonal-impulse’ pattern instead. The latest Elliott Wave analysis of the 2nd wave correction from that 2018 high remains in focus for the remainder of 2019 and it will have consequences for the major U.S., European and Asian indices too.
New Stock Index H2-2019 Video – PART I/III
This MID-YEAR 2019 VIDEO UPDATE for STOCK INDICES is like nothing you’ve seen anywhere else in the world – it’s unique to WaveTrack International, how we foresee trends developing through the lens of Elliott Wave Principle (EWP) and how its forecasts correlate with Cycles, Sentiment extremes and Economic data trends.
We invite you to take this next step in our financial journey with us – video subscription details are below – just follow the links and we’ll see you soon!
Most sincerely,
Peter Goodburn
Founder and Chief Elliott Wave Analyst
WaveTrack International
What you get!
Contents: 50 charts – 1 hour 56 mins.
• CRB-Cash index
• S&P 500 + Cycles
• Dow Jones Industrial Average
• AAII Bullish Sentiment
• Consumer Sentiment
• Consumer Confidence
• Cape P/E Ratio
• Russell 2000
• Nasdaq 100
• Dow Jones Transport
• Dow Jones Utilities
• KBW Banking Index
• XLF Financial
• XLK Technology
• XLP Consumer Staples
• XLY Consumer Discretionary
• Eurostoxx 50
• Xetra Dax 30
• FTSE-100
• MSCI Emerging Market
• Bovespa
• Russia RTS
• Nifty 50
• Sensex
• MSCI China
• Shanghai Composite
• China Enterprises
• Hang Seng
• Taiwan SE Weighted
• Singapore Straits
• ASX 200
• Nikkei 225
CONTACT US NOW VIA EMAIL – SELECT YOUR PACKAGE
Single Video – *$48.00 – PART I Stock Index Mid-Year Video 2019 (June ’19)
Triple Package offer – *$96.00 (saving 33%)! – PART I – PART II – PART III (June – July ’19)
*(additional VAT may be added depending on your country – currently US, Canada, Asia have no added VAT but most European countries do)
PARTS II & III will be available in a few weeks’ time – we’re working on it!
HOW CAN YOU RECEIVE THE VIDEO FORECAST?
To receive your VIDEO UPDATE please click here to contact us.
– Please state if you wish to purchase the SINGLE VIDEO – Stock Index Mid-Year Video Update 2019 for USD *48.00?
– Or opt for the TRIPLE PACKAGE for USD *96.00 in total?
– Next we will send you a PayPal payment request and provide you with the video link & PDF report once confirmed.
*(additional VAT may be added depending on your country of residence. Currently, the US, Canada, Asia have no added VAT but most European countries do)
We’re sure you’ll reap the benefits – don’t forget to contact us with any Elliott Wave questions – Peter is always keen to hear you views, queries and comments.
Visit us @ www.wavetrack.com
Tags: VIDEO UPDATE 2019
Nikkei – Watch out for next major decline
by WaveTrack International| May 20, 2019 | No Comments
Nikkei’s 5-Wave Decline from April High Great Proxy for U.S./European Indices – 3-Wave Correction Almost Done! Watch-Out for Next Major Decline!!
Nikkei 225 Elliott Wave Analysis
This short-term look at the Nikkei’s decline from the early-May high of 22505 (futures) is a perfect proxy of the entire scene unfolding in global indices.
Nikkei 225 Index – 60 mins. Forecast by WaveTrack International
There’s a very clear five wave impulse pattern unfolding into last Tuesday’s low of 20765. This pattern is labelled as minute wave a and subdividing [i]-[ii]-[iii]-[iv]-[v]. This is part of the ongoing zig zag downswing that began minor wave e. of the 18-month triangle pattern (more details in our previous Elliott Wave Compass Reports).
Note how the 3rd wave as minuette wave [iii] was the longest wave in the pattern. And how the two corrective waves, [ii] and [iv] adhered to the rule of ‘alternation’. Especially, how fib-price-ratios pinpointed the terminal completion at 20765, i.e. waves [i]-[iii] x 61.8% = [v].
Nikkei Forecast
A counter-trend rally has since begun but already approaching idealised upside targets for wave b towards 21482+/-. Once completed, we expect wave c to begin the next and final sequence of declines.
How to Subscribe?
Find out what WaveTrack’s latest Nikkei 225 Index forecast is and subscribe to the Elliott Wave Compass report.
The ELLIOTT WAVE COMPASS report focuses on the shorter-term perspective of price development comprising of two online updates per week describing and illustrating a cross-section of market trends/counter-trends for stock indices, bonds, currencies and commodities from around the world. This report is ideal for professional and private clients trading a time horizon of a just a few days to a few weeks ahead.
The bi-weekly EW-Compass report offer short-term perspective for global markets
· Stock Indices
· Bonds
· Currencies (FX)
· Commodities
If you like to know more details about the Elliott Wave Compass report and what contracts are covered please https://www.wavetrack.com/products/elliott-wave-compass.html
SP500 and Nasdaq 100!
by WaveTrack International| May 13, 2019 | 5 Comments
REVERSAL-SIGNATURE!! – SP500 and Nasdaq 100 Decline in 5 Wave Impulse from May Highs – Multi-Month Corrective Downswing Underway
Read more «SP500 and Nasdaq 100!»
Elliott Wave – Crude Oil – Are Price Trends Predictable?
by WaveTrack International| April 15, 2019 | 3 Comments
Is Crude Oil predictable?
Anyone connected to the financial markets industry knows just how difficult it is to accurately predict price changes, duration and the amplitude of trends. Billions of dollars are spent annually on research derived from varying models, economic, fundamental analysis, mathematical algorithms and even artificial intelligence programmes. But is there efficiency? Has market analysis really improved over the last several decades since the computer revolution?
It seems that more complex ways are being experimented in order to predict price trends but that hasn’t revolutionised the industry. Most large asset managers employ huge teams to outperform major indices which provide the benchmark for performance. However, most active managers are left either underperforming or are marginally ahead of the game. Consider to add all the twists and turns in a market trend together over a year. This would account to a far greater percentage swing than just a trend that measures its starting point in January and its completion in December. Which means there’s a lot of wastage – inefficiency.
Crude Oil or Forecasting Nightmare?
So, it was no surprise to read a recent report from CNBC which ran its story around a senior research analyst working for a major Oil brokerage company based in London, U.K. The analyst commented in its latest research note that ‘There are so many uncertainties surrounding the oil market that it makes it virtually impossible to predict developments for the rest of the week let alone for months or a year ahead’. The report went on ‘There are economic and geopolitical developments to deal with and these can change almost on a daily basis’. The analyst described oil market conditions as a ‘forecasting nightmare’.
Elliott Wave vs. Fundamental Forecasting
Now I’m the first to be sympathetic. I know just how difficult it can be to predict future price development several months in advance. Many analysts have climbed to fame over one maybe two historic calls. A few names, unmentioned here rose to notoriety during the financial-crisis collapse of 2007-09 but have since faded from view. Yes, because it’s difficult.
Most analysts pick their way through short-term calls which are about 3-5% per cent away from current levels, erratic as that performance may be. It’s a bit like two fleas playing ping-pong (table-tennis) on the back of a dog. Yes, they have some idea of the limits of the balls movement. But absolutely no idea about the direction of the dog.
But there’s a methodology that moves away from the ‘incrementalist’ idea of ‘linear-thinking’ which is better tuned into the concept that markets are non-linear progressions of action/reaction processes – and that’s the Elliott Wave (EW) methodology.
Can Elliott Wave predict Crude Oil?
Our specialisation in the EW model has produced some uncanny market calls over the last 25+ years, across all asset classes. Many cannot be scrutinised as random forecasts because of the sheer complexity of pattern, form, price amplitude and duration employed in that analysis. If you’re a mathematician and understand the probability of forecasting such trends, then you’ll know that to predict something so arcuate would be hundreds-of-thousands against – and if repeated, is so mathematically improbable that the only reasoning would be to confirm that there is an underlying law that is being applied in the process.
So when it comes to Crude Oil analysis, let’s see whether the Elliott Wave model has merits.
The next six charts represent a Track Record of EW price forecasts published in WaveTrack International’s bi-weekly and/or monthly analysis covering the last 3-year period.
WaveTrack’s Crude Oil Track Record
Crude Oil Exhibit 1 – January 9th 2016
Crude Oil – Weekly – 9th January 2016 Forecast
Crude Oil is engaged in a three price-swing zig zag decline that began from the July ’08 all-time-record high of $147.27, labelled A-B-C. Basis Elliott Wave and Fib-Price-Ratio analysis, wave C downside targets were measured towards $25.60-25.26+/-. The price at the time of this analysis was at 33.16 which means it was forecasting a decline of approx. $7.50 dollars but then ending the entire zig zag pattern/decline from $147.27, then staging a reversal to begin a new uptrend.
Crude Oil Exhibit 2 – May 10th 2016

Crude Oil – Weekly – 10th May 2016 Forecast
Crude Oil ended the three price-swing zig zag decline at 26.05, just $0.45 cents from the projected low. Coincidence? Hardly! The price responded not by any fundamental news at the time – sentiment was very bearish then – but it instead responded to the Laws that define price development as seen through the Elliott Wave Principle. Crude Oil was already trading up to $43.47, a recovery of +66% per cent. And not only that, the updated analysis then projected prices unfolding higher but within specific parameters, or conditions – the advance must unfold higher into a three price-swing formation, labelled A-B-C, and amplitude analysis using Fib-Price-Ratios predicted the advance would end towards $75.09+/-, then turn down dramatically afterwards.
Crude Oil Exhibit 3 – August 26th 2018
Crude Oil – Weekly – 26th August 2018 Forecast – www.wavetrack.com
It’s taken over 2½ years for the A-B-C zig zag upswing to develop and only in Aug.’18 is it approaching original upside targets of $75.09+/-, now revised to $78.90+/-. But the pattern isn’t quite finished – a little more upside was forecast from current levels of $68.72 to $78.90+/-. Afterwards, a big downswing would begin with initial targets towards 55.70+/-.
Crude Oil Exhibit 4 – November 22nd 2018
Crude Oil – Weekly – 22nd November 2018 Forecast – www.wavetrack.com
Crude Oil traded up to $76.90 in late-October, ending the A-B-C zig zag pattern that was forecast almost 3-years earlier to $75.09-78.90+/-! The next forecast predicted a decline towards min. $55.70+/-, revised here towards $44.75+/-.
Crude Oil Exhibit 5 – January 9th 2019
Crude Oil – Weekly – 9th January 2019 Forecast – www.wavetrack.com
Price declines continued down to a final low at $42.36, a massive drop of $34.54 dollars or a -44.9% per cent decline. Elliott Wave analysis then forecast a three price-swing zig zag pattern developing to the upside over several months, labelled (A)-(B)-(C) – upside projections were to min. $61.70+/-, max. $66.80+/-.
Crude Oil Exhibit 6 – April 11th 2019
Crude Oil – Weekly – 11th April 2019 Forecast – www.wavetrack.com
Crude Oil ran higher, exactly as predicted, unfolding into a three price-swing zig zag pattern, (A)-(B)-(C) with price targets being reached at 64.79 (April 8th). Analysis now predicts a sharp downswing over the next several months, towards $33.70+/-.
Conclusion
The overall form and price-forecasts presented in these six charts over a 3-year period developed almost perfectly according to the Universal Laws governing the Elliott Wave Principle. Even a casual eye will notice the predictability in price development and its accuracy can only result in one conclusion – an inherent, mysterious law is governing the price development of all financial/commodity/currency markets – if those laws are known, understood, then accurate price prediction is certainly possible
Peter Goodburn is the senior Elliott Wave analyst at WaveTrack International and is the author of the monthly institutional Elliott Wave-Navigator report and the bi-weekly individual investor Elliott Wave-Compass report. For information to subscribe to the annual 2019 VIDEO REPORTS – please click these links: alternatively, details at www.wavetrack.com
PART I – Stock Index Video January 2019
PART II – Commodities Video February 2019
PART I – Currencies and Interest Rates 2019 Video
« go back — keep looking »
Recent Posts
Recent Comments
Archives
- February 2026
- December 2025
- August 2025
- July 2025
- June 2025
- March 2025
- February 2025
- January 2025
- December 2024
- August 2024
- July 2024
- June 2024
- May 2024
- April 2024
- February 2024
- January 2024
- December 2023
- August 2023
- July 2023
- June 2023
- March 2023
- February 2023
- January 2023
- December 2022
- November 2022
- October 2022
- August 2022
- July 2022
- June 2022
- May 2022
- March 2022
- February 2022
- January 2022
- December 2021
- August 2021
- July 2021
- June 2021
- March 2021
- February 2021
- January 2021
- December 2020
- November 2020
- August 2020
- July 2020
- June 2020
- May 2020
- April 2020
- March 2020
- February 2020
- January 2020
- December 2019
- October 2019
- September 2019
- July 2019
- June 2019
- May 2019
- April 2019
- March 2019
- February 2019
- January 2019
- December 2018
- November 2018
- September 2018
- August 2018
- July 2018
- June 2018
- May 2018
- April 2018
- March 2018
- February 2018
- January 2018
- December 2017
- November 2017
- October 2017
- September 2017
- August 2017
- July 2017
- June 2017
- May 2017
- March 2017
- February 2017
- January 2017
- December 2016
- November 2016
- October 2016
- September 2016
- August 2016
- July 2016
- June 2016
- May 2016
- April 2016
- March 2016
- February 2016
- January 2016
- December 2015
- November 2015
- October 2015
- September 2015
- August 2015
- July 2015
- June 2015
- May 2015
- April 2015
- March 2015
- February 2015
- January 2015
- December 2014
- November 2014
- October 2014
- September 2014
- August 2014
- July 2014
- June 2014
- May 2014
- April 2014
- March 2014
- February 2014
- January 2014
- December 2013
- November 2013
- October 2013
- September 2013
- August 2013
- July 2013
- June 2013
- May 2013
- April 2013
- March 2013
- February 2013
- January 2013
- December 2012
- November 2012
- October 2012
- September 2012
- August 2012
Categories
- ADXY Index
- Agnico Eagle Mines
- AI Artificial Intelligence
- Alcoa
- Amazon
- AngloGold Ashanti
- Antofagasta
- APPL
- Apple
- ASX 200
- AUD vs USD
- AUDNZD
- AUDUSD
- Australia ASX 200
- Baltic Dry Index
- Banking
- Base Metals
- Biotechnology
- Bitcoin
- Bovespa
- Broadcom
- Catalexit
- central banks
- Christmas
- Commodities
- Commodities Video Outlook 2020
- Conference
- Copper
- Coronavirus Sell-Off
- CRB
- Crude oil
- crude oil price chart
- CryptoCurrency
- Currencies
- Currencies + Interest Rates Video Outlook
- Cycles
- Dax 30
- deutsche bank
- Dewey Cycle
- DJ Transportation Average
- DJ Utilities
- Dow Jones 30
- Dow Theory
- ECB
- economy
- Elliott Wave
- Elliott Wave Charts
- Elliott Wave Patterns
- Elliott Wave Principle
- Emerging Markets
- Ending-Diagonal Elliott Wave Pattern
- Equity
- EUR vs CHF
- EUR/USD
- Euro / US$
- Eurostoxx 50
- EuroStoxx50
- EuroStoxxBanks
- EURUSD
- Expanding Flat Pattern
- FAAMG
- FANG+
- fib-price-ratio
- Fibonacci Trading
- Fibonacci-Price-Ratio
- Financial Forecasting
- Fixed Income
- forex
- Freeport McMoran
- FTSE 100
- Fund Management
- FX
- FXStreet
- GBP/AUD
- GBP/USD
- GDX
- GDXJ
- Germany 10 year Euro Bund future
- Gilead Sciences
- Glencore
- Global Economy
- Gold
- Gold Mining
- Golden Ratio
- goldman sachs
- Google Inc.
- Google/Alphabeth
- Greek debt crisis
- Hang Seng
- Harbinger
- Hungarian Forint
- IBEX 35 Index Spain
- Independent Research
- India-CNX Nifty 50
- Interest Rates
- Interview
- IRP Independent Research
- kbw bank index
- Lonmin
- MAG-7
- McDonald's
- MID-YEAR VIDEO UPDATE!
- Mifid II
- Mines
- Mining
- MSCI China
- MSCI Emerging Markets
- Nasdaq 100
- Nasdaq Biotechnology Index
- Nasdaq Composite
- Nasdaq100
- Netflix
- Newmont Mining
- Nikkei 225
- NVIDIA
- NYSE Composite Index
- Palladium
- Platinum
- Precious Metals
- Ralph Nelson Elliott
- Reversal-Signature
- Russell 2000
- Russia RTS
- S&P 500
- Sector
- Secular-Bull
- Sentiment Survey
- Shanghai Composite Index
- Silver
- Slanting Flat Elliott Wave Pattern
- SP100
- SP400 Mid-Cap
- SP500
- SPX 500
- STLG/AUD
- Stlg/US$
- STLG/USD
- STLG/YEN
- STLG/ZAR
- Stock Index
- Stock Index Tracking
- Stock Index Video
- Stock Indices
- Stock Indices Video Outlook 2023
- Stock Indices Video Outlook 2025
- Sugar
- Summary
- Tesla
- Tesla Inc
- Toyota
- Track Record
- trading
- Trusts
- Tutorial
- Uncategorized
- UniCredit
- US
- US Dollar Index (DXY) (USDX)
- US$ Index
- US-Dollar Index
- US10yrYields
- USD
- USD/ARS
- USD/CNY
- USD/IDR
- USD/INR
- USD/MXN
- USD/SGD
- USD/THB
- USD/YEN
- USD/ZAR
- Vale
- Value Line Index
- video
- VIDEO OUTLOOK 2018
- VIDEO OUTLOOK 2020
- VIX
- W.D. Gann
- WaveTrack International
- XAU Gold/Silver Index
- Xetra Dax
- XOP
- Yields
- Zig Zag
- Zinc
- ‘INFLATION-POP’
- ‘SHOCK-POP-DROP’