Currencies and Interest Rates 2019 Video Outlook | PART III/III
by WaveTrack International| February 17, 2019 | 1 Comment

Currencies & Interest Rates 2019 Video Series | PART III/III
INCLUDES ANALYSIS ON MAJOR US$ DOLLAR PAIRS/CROSSES – ASIAN/EM CURRENCIES – MEDIUM-TERM CYCLES – LONG-DATED YIELDS US/EUROPE/JAPAN + SPREADS
US$ Dollar Continues Higher into Mid-Year 2019 before 7.8-Year Cycle Reasserts Downtrend – Long-Dated U.S./European Yields Heading Lower until June/July then Resuming Medium-Term Uptrend – Inflation Lower, then Surges Higher until 2021-24
We’re pleased to announce the publication of WaveTrack’s CURRENCIES & INTEREST RATES 2019 video updating medium-term ELLIOTT WAVE price-forecasts.
• PART I – STOCK INDICES – out now!
• PART II – COMMODITIES – out now!
• PART III – CURRENCIES & INTEREST RATES – out now!
CURRENCY REVIEW – 2018
In last year’s June ’18 mid-year EW-Forecast Video, several key CURRENCY & INTEREST RATE events were highlighted –
In fact, our analysis covered many more currency pairs/crosses. Actually, 30 in all but the overall theme that bound most of them together was a two-fold theme. First, the US$ Dollar’s period of strength that began 2018 would take a pause for several months. And second, it would resume higher after that consolidation/trading-range had completed.
How did these Elliott Wave price-forecasts pan out?
The three main drivers that provided US$ dollar strength was the continued expansion in the U.S. economy, the Federal Reserve’s persistence in tightening monetary policy with incremental interest rate hikes and some defensive, safe-haven plays as stock markets gyrated between mini-crashes and recoveries.
But these actions helped to mould the Elliott Wave patterns predicted in the June ’18 report/video.
Overall, the US$ dollar pairs performed successfully within the forecasts of June ’18. So what next?
Forecasts for 2019
This year is set to continue those US$ dollar corrective ZIG ZAG rallies that began from the Feb.’18 lows of 88.26. So there’s a more immediate emphasis on US$ dollar strength against most US$ dollar pairs, including those of Emerging Markets and Asian Currencies.
It may seem counter-intuitive because the latest news-flow indicates the Federal Reserve has been in a more conciliatory mood since stock markets crashed lower by -20% last October/December. But during this time, the US$ dollar actually steadied, if not, gained as safe-haven strategies kicked-in. Stock markets are preparing for another downswing in Q1 ’19. Whilst Emerging Markets and Asian Indices are seen as particularly vulnerable . If so, another round of safe-haven US$ dollar buying could see the final phase of 2018’s dollar correction advancing to meet those upside targets of mid-2018.
‘Inflation-Pop’
Looking further ahead, once the US$ dollar index has completed its final phase of advances as the ZIG ZAG correction from its 2018 lows, the dollar is then expected to resume its 7.8-year cycle downtrend – see fig #1 (below). This is very prevalent in the cycle analysis featured in these reports over the last several years – it’s part of a larger 15.6-year cycle that connects cycle-troughs and cycle-peaks over the last 60-years. The US$ dollar is forecast significantly lower over this next cycle interval. The main trigger – RISING INFLATIONARY PRESSURES!
US Dollar Index – Monthly – Cycle by WaveTrack International
In our PART I & II series for STOCK INDICES & COMMODITIES, we talked extensively about the final phase of an ‘INFLATION-POP’ that is set to lift asset prices significantly higher over the next few years. This maintains the SECULAR BULL UPTREND for stock markets and triggers a final round of COMMODITY price surges, many to NEW RECORD HIGHS. The ‘Inflation-Pop’ is triggered by several factors including rising interest rates and nationalistic protectionism which spills-over into rising prices of goods and services.
Secular-Bull Cycle
The U.S., as the largest economy in the world, is already suffering from bourgeoning fiscal and budget deficits and this is only going to get worse late into the SECULAR-BULL and INFLATION-POP cycle. The U.S. National Debt has exceeded $20 trillion dollars and shows no signs of abating. Current economic policies like reducing the trade deficit is already underway but is having little, immediate impact. If not from the Treasury of the Federal Reserve, the US$ dollar will eventually trade to the point of ‘least resistance’ which requires a hefty decline to re-balance this growing debt pile. In other words, the U.S. economy will be forced to reflate its way out of debt by allowing the US$ dollar to decline rapidly over the coming years into the next 7.8-year cycle low due in 2023/24. See fig #2 (below).
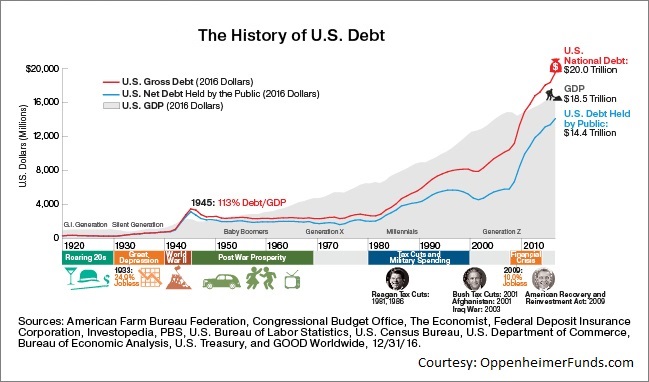
History of US Debt
Interest Rates
In the June ’18 mid-year update, the US10yr YIELD was forecast to begin a major corrective downswing from levels around the 3.127% area. This was due to the fact that a FIVE WAVE IMPULSE pattern was approaching completion from the all-time-low traded in July ’16 from 1.316%.
The yield ran up to 3.262% in October but has now succumbed to a THREE WAVE counter-trend ZIG ZAG correction with levels trading down to 2.543% since!!
Now, this zig zag correction is still some way off from completion – another downswing is forecast for the first half of 2019!
A similar Elliott Wave corrective pattern also began unfolding in the benchmark DE10yr Yield, from the Feb.’18 high of 0.806%. But this corrective decline is fast approaching its main downside objective. This could be delayed in order to synchronise with a dual low forecast in treasury yields, but the overall effect depicts additional declines into mid-year 2019.
But looking much further ahead, Elliott Wave analysis depicts the next phase of major uptrends resuming from June/July ’19 onwards. Interest rates are forecast significantly higher over the next few years, playing its part in the ‘INFLATION-POP’ story.
This 2019 report includes a look the US10yr INFLATION TIPS, trends in the shorter-dated maturities, the US05yr yield, the US02yr yield, the US10yr-DE10yr Spread and the US02yr-10yr Spread.
New Currencies & Interest Rates 2019 Video – PART III/III
We have amassed over 80 charts from our EW-Forecast database in this year’s Currencies & Interest Rates 2019 video. Each one provides a telling story into the way Elliott Wave price trends are developing in this next INFLATION-POP’ phase of cycle development. We’re taking a look at some very specific patterns that span the entire 15.6-year US$ dollar cycle. Explaining its current location and why inflation will trigger huge US$ dollar declines but simultaneously appreciating major Emerging Market and Asian Currencies.
We’re updating some amazing cycles in the US$ dollar that you’ve simply got to know. Plus updating the global US$ dollar positioning against several key US$ dollar pairs – it’s a must-see!
We invite you to take this next step in our financial journey with us – video subscription details are below – just follow the links and we’ll see you soon!
Most sincerely,
Peter Goodburn
Founder and Chief Elliott Wave Analyst
WaveTrack International
Contents: 81 charts | Time: 2 hours 5 mins. long
The contents of this CURRENCY & INTEREST RATES VIDEO include Elliott Wave analysis for:
• US$ index
• Euro/US$
• Stlg/US$
• US$/Yen
• US$/CHF
• AUD/US$
• NZD/US$
• US$/CAD
• Euro/Stlg
• Euro/Yen
• Asian ADXY
• US$/IDR
• US$/MXN
• US$/ARS
• US$/TRY
• US$/ZAR
• US$/BRL
• US$/RUR
• US$/CNY
• Bitcoin
Interest Rates:
• U.S. AAA+ 30-Year Corporate Bond Yields
• US30yr Yield
• US10yr Yield
• US10yr TIPS Break-Even Inflation Rate
• DE10yr Yield
• ITY10yr Yield
• JPY10yr Yield
2018’s 4th Wave Correction Approaching A Terminal Low In Q1 2019!
CONTACT US NOW VIA EMAIL – SELECT YOUR PACKAGE
Single Video – *$48.00 – PART III Currencies + Interest Rates Video 2019 (Feb. ’19)
Triple Package offer – *$96.00 (saving 33%)! – PART I – PART II – PART III (Jan. – Feb. ’19)
*(additional VAT may be added depending on your country – currently US, Canada, Asia have no added VAT but most European countries do)
HOW CAN YOU RECEIVE THE VIDEO FORECAST?
To receive your VIDEO UPDATE please click here to contact us.
– Or opt for the TRIPLE PACKAGE for USD *96.00 in total?
– Next we will send you a PayPal payment request and provide you with the video link & PDF report once confirmed.
– Alternatively, we can process credit card payments for you as well – please contact us. Thank you.
*(additional VAT may be added depending on your country of residence. Currently, the US, Canada, Asia have no added VAT. However, most European countries do)
We’re sure you’ll reap the benefits – don’t forget to contact us with any Elliott Wave questions – Peter is always keen to hear you views, queries and comments.
Visit us @ www.wavetrack.com
Comments
One Response to “Currencies and Interest Rates 2019 Video Outlook | PART III/III”
Leave a Reply

Recent Posts
Recent Comments
Archives
- July 2024
- June 2024
- May 2024
- April 2024
- February 2024
- January 2024
- December 2023
- August 2023
- July 2023
- June 2023
- March 2023
- February 2023
- January 2023
- December 2022
- November 2022
- October 2022
- August 2022
- July 2022
- June 2022
- May 2022
- March 2022
- February 2022
- January 2022
- December 2021
- August 2021
- July 2021
- June 2021
- March 2021
- February 2021
- January 2021
- December 2020
- November 2020
- August 2020
- July 2020
- June 2020
- May 2020
- April 2020
- March 2020
- February 2020
- January 2020
- December 2019
- October 2019
- September 2019
- July 2019
- June 2019
- May 2019
- April 2019
- March 2019
- February 2019
- January 2019
- December 2018
- November 2018
- September 2018
- August 2018
- July 2018
- June 2018
- May 2018
- April 2018
- March 2018
- February 2018
- January 2018
- December 2017
- November 2017
- October 2017
- September 2017
- August 2017
- July 2017
- June 2017
- May 2017
- March 2017
- February 2017
- January 2017
- December 2016
- November 2016
- October 2016
- September 2016
- August 2016
- July 2016
- June 2016
- May 2016
- April 2016
- March 2016
- February 2016
- January 2016
- December 2015
- November 2015
- October 2015
- September 2015
- August 2015
- July 2015
- June 2015
- May 2015
- April 2015
- March 2015
- February 2015
- January 2015
- December 2014
- November 2014
- October 2014
- September 2014
- August 2014
- July 2014
- June 2014
- May 2014
- April 2014
- March 2014
- February 2014
- January 2014
- December 2013
- November 2013
- October 2013
- September 2013
- August 2013
- July 2013
- June 2013
- May 2013
- April 2013
- March 2013
- February 2013
- January 2013
- December 2012
- November 2012
- October 2012
- September 2012
- August 2012
Categories
- ADXY Index
- Agnico Eagle Mines
- Alcoa
- Amazon
- AngloGold Ashanti
- APPL
- Apple
- ASX 200
- AUD vs USD
- AUDNZD
- AUDUSD
- Australia ASX 200
- Baltic Dry Index
- Banking
- Base Metals
- Biotechnology
- Bitcoin
- Bovespa
- Catalexit
- central banks
- Christmas
- Commodities
- Commodities Video Outlook 2020
- Conference
- Copper
- Coronavirus Sell-Off
- CRB
- Crude oil
- crude oil price chart
- CryptoCurrency
- Currencies
- Cycles
- Dax 30
- deutsche bank
- Dewey Cycle
- DJ Transportation Average
- DJ Utilities
- Dow Jones 30
- Dow Theory
- ECB
- economy
- Elliott Wave
- Elliott Wave Charts
- Elliott Wave Patterns
- Elliott Wave Principle
- Emerging Markets
- Ending-Diagonal Elliott Wave Pattern
- Equity
- EUR vs CHF
- EUR/USD
- Euro / US$
- Eurostoxx 50
- EuroStoxx50
- EuroStoxxBanks
- EURUSD
- Expanding Flat Pattern
- FAAMG
- FANG+
- fib-price-ratio
- Fibonacci Trading
- Fibonacci-Price-Ratio
- Financial Forecasting
- Fixed Income
- forex
- FTSE 100
- Fund Management
- FX
- FXStreet
- GBP/AUD
- GBP/USD
- GDX
- GDXJ
- Germany 10 year Euro Bund future
- Gilead Sciences
- Global Economy
- Gold
- Gold Mining
- Golden Ratio
- goldman sachs
- Google Inc.
- Greek debt crisis
- Hang Seng
- Harbinger
- Hungarian Forint
- IBEX 35 Index Spain
- Independent Research
- India-CNX Nifty 50
- Interest Rates
- Interview
- IRP Independent Research
- kbw bank index
- Lonmin
- McDonald's
- MID-YEAR VIDEO UPDATE!
- Mifid II
- Mines
- Mining
- MSCI China
- MSCI Emerging Markets
- Nasdaq 100
- Nasdaq Biotechnology Index
- Nasdaq Composite
- Nasdaq100
- Nikkei 225
- NYSE Composite Index
- Palladium
- Platinum
- Precious Metals
- Ralph Nelson Elliott
- Reversal-Signature
- Russell 2000
- Russia RTS
- S&P 500
- Sector
- Secular-Bull
- Sentiment Survey
- Shanghai Composite Index
- Silver
- Slanting Flat Elliott Wave Pattern
- SP100
- SP400 Mid-Cap
- SP500
- SPX 500
- STLG/AUD
- Stlg/US$
- STLG/USD
- STLG/YEN
- STLG/ZAR
- Stock Index
- Stock Index Tracking
- Stock Index Video
- Stock Indices
- Stock Indices Video Outlook 2023
- Sugar
- Summary
- Tesla Inc
- Toyota
- Track Record
- trading
- Trusts
- Tutorial
- Uncategorized
- UniCredit
- US
- US Dollar Index (DXY) (USDX)
- US$ Index
- US-Dollar Index
- US10yrYields
- USD
- USD/ARS
- USD/CNY
- USD/IDR
- USD/INR
- USD/MXN
- USD/SGD
- USD/THB
- USD/YEN
- USD/ZAR
- Value Line Index
- video
- VIDEO OUTLOOK 2018
- VIDEO OUTLOOK 2020
- VIX
- W.D. Gann
- WaveTrack International
- XAU Gold/Silver Index
- Xetra Dax
- XOP
- Yields
- Zig Zag
- Zinc
- ‘INFLATION-POP’
- ‘SHOCK-POP-DROP’
May 31st, 2024 @ 3:10 am
You are so awesome! I don’t think I’ve read anything like this before. So great to find another person with unique thoughts on this subject. Really.. many thanks for starting this up. This site is something that is required on the internet, someone with a little originality!