Currencies and Interest Rates 2020 Video | PART III/III
by WaveTrack International| February 18, 2020 | 1 Comment
PART III – CURRENCIES & INTEREST RATES
US$ Dollar Approaches Completion of Corrective Zig Zag Advance from 2018 Low – Major Reversal-Signature Triggers Next Stage of 7.8-Year Cycle Downtrend – Euro/US$ Forming Major Low Together with Other Dollar Pairs – U.S. Interest Rates Finalising Declines from 2018 Highs but Lower-Lows Come First – European Interest Rates Set to Retest September ’19 Lows – Italian Yields Break to Historical Lows
INCLUDES ANALYSIS ON MAJOR US$ DOLLAR PAIRS/CROSSES – ASIAN/EM CURRENCIES – MEDIUM-TERM CYCLES – LONG-DATED YIELDS US/EUROPE/JAPAN + SPREADS
We’re pleased to announce the publication of WaveTrack’s annual 2020 trilogy video series of medium-term ELLIOTT WAVE price-forecasts.
Today’s release is PART III, CURRENCIES & INTEREST RATES – Parts I & II were released during the last month.
CURRENCIES REVIEW – 2019
In last June ’19’s mid-year EW-Forecast Video, several key CURRENCY & INTEREST RATE events were highlighted –
• The US$ dollar index is set to accelerate higher through the remainder of this year (2019)
• Corresponding declines forecast for G8 currencies
• Asian currencies are expected to stage overall declines during H2 2019 with the Asian Dollar Index (ADXY) is vulnerable to a decline of -4.5%
• All emerging market and commodity-related currencies are forecast weakening against the US$ dollar during H2 2019 but some of the stronger currencies will simply undergo corrective retracements
How did these Elliott Wave price-forecasts pan out?
Actually, pretty well. The main driver that sent the US$ dollar higher across the final 6-month period of 2019 was strong U.S. economic growth and employment. But it also attracted safe-haven dollar buying as anxieties persisted over a potential fall-out from the U.S./China trade war.
The US$ dollar index traded up from the late-June low of 95.85 to 99.66 by October. It did fall back later, ending a corrective downswing into the early-January 2020 low of 96.36. But its back higher again, challenging the October highs.
There were corresponding declines for the major G8 currency pairs. The Euro/US$ declined from the June ’19 high of 1.1414 down to October’s low of 1.0879. Stlg/US$ traded down from 1.2784 into September’s low of 1.1958. Meanwhile, the AUD/US$ traded lower from 0.7083 to October’s low of 0.6671, the US$/CAD from 1.3566 to the end-December low of 1.2952 and US$/Yen from 108.80 to 104.46.
Asian Currencies Performance
Asian currencies staged downswings against the US$ dollar too. Led by the benchmark Asian Dollar Index (ADXY) which declined from 105.40 to 102.00 from June to September. However, it later recovered higher through the last quarter to 105.70 which gave some reprieve for the individual Asian currencies.
Overall, the US$ dollar pairs performed successfully within the forecasts of June ’19. So what next?
Key Drivers/Events for 2020
The currency markets have had to deal with the ongoing U.S./China trade war and more recently, as we begin 2020, the impact of the coronavirus Covid-19. But there’s more. Central Banks are beginning to rethink strategy having seen benign inflationary pressures both in the U.S. and Europe. This could be a major factor for this year.
Federal Reserve Chairman Jerome Powell’s testimony to Congress gave some hints. He said the central bank wanted to update its policy-setting manual to address an economic environment in which falling inflation was potentially a more pressing problem than rising inflation. In earlier statements, there were remarks about allowing inflation to ‘run hot’ should it begin to increase.
Now, this is creating the perfect environment to trigger the next phase of our ‘Inflation-Pop’, where asset prices advance exponentially over the next two, maybe three years.
In Europe, new ECB President Christine Lagarde has openly supported the idea of continuing to pump the financial system with liquidity. The strategic review Lagarde launched last month could be transformational for the ECB. Bringing tweaks to the ‘below but close to 2%’ inflation target and more tolerance for deviation. But what happens if the unexpected actually materialises? Would runaway inflationary pressures have a profound effect on monetary policy?
Central banks could find themselves chasing rising inflation in a repeat of the 1970’s.
Currency Volatility at Historical Lows
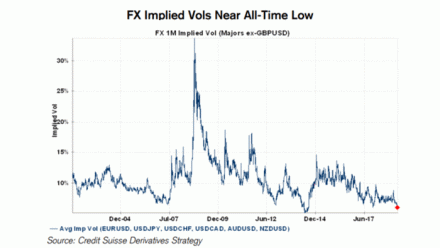
Just recently, the implied volatility of a cross-section of currencies against the US$ dollar has hit a new historical low. The last occasion volatility was this low was back in 2014. Before that, in 2007 and before that, in 1996 – see fig #1.
As you can see from this graph, courtesy of Credit Suisse Derivatives Strategy when volatility reaches towards the 5% per cent area, it doesn’t last long at these levels – it inevitably turns sharply higher. That translates into much higher volatility in the not-too-distant future.
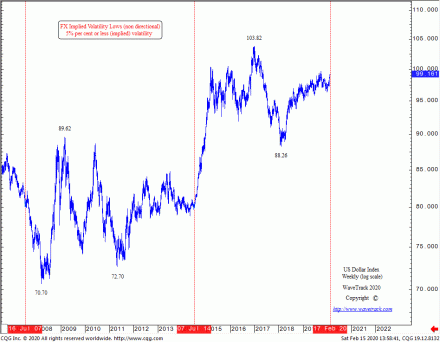
Those previous occasions of low volatility are marked in this next graph of the US$ dollar index – see fig #2. As you can see, low volatility isn’t necessarily linked to the DIRECTIONAL movement of the dollar. Back in July ’07, the US$ dollar index continued to accelerate LOWER – in July ’14, low volatility was accompanied by a surge HIGHER. What happens next may be just an opportunist guess, but not so if we apply the data to an Elliott Wave and Cycle Analysis overlay.
In this next graph – see fig #3, courtesy of Bloomberg and JP Morgan, they’ve concluded that low volatility precedes large 6-month movements in the US$ dollar.
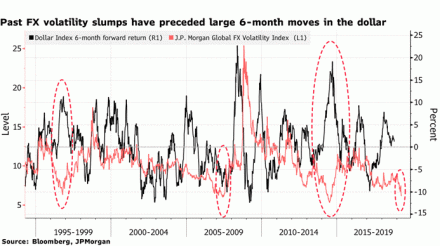
Pas FX volatility slumps have preceded large 6-month moves in the dollar – Source: Bloomberg, JP Morgan
We have to concur! – But in which direction?
Currencies EW-Forecasts for 2020
If you’ve tuned-in to our annual reports before, you’ll already know that the US$ dollar index is engaged in a 7.8-year cycle downtrend that began from the Jan.’17 high of 103.82. This is labelled as primary wave 3 within an Elliott Wave impulse downtrend that began from the July ’01 high of 121.02. You can probably imagine this means the dollar is set to decline rapidly over the next several years.
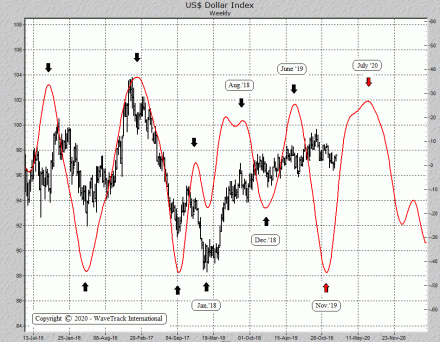
But if low volatility is a prelude to some big moves in the dollar, does that mean it will collapse immediately? Not so, basis the shorter-term EW pattern development which is also being corroborated by the weekly composite cycle of the US$ dollar index – see fig #4.
This composite cycle of the US$ dollar index is but one of several in this PART III Currencies & Interest Rate report. It depicts the US$ dollar bottoming around Nov.’19, then pushing higher until July ’20. Whilst these turning points are not exact, they do provide a useful overlay. Especially, in conjunction with shorter-term daily cycle analysis. What it does tell us is this – the dollar isn’t quite ready to resume its larger 7.8-year cycle downtrend.
Currencies and the Inflation-Pop
One of the key aspects to this year’s analysis revolves around the theme of the ‘Inflation-Pop’, where asset prices advance exponentially over the next two, maybe three years.
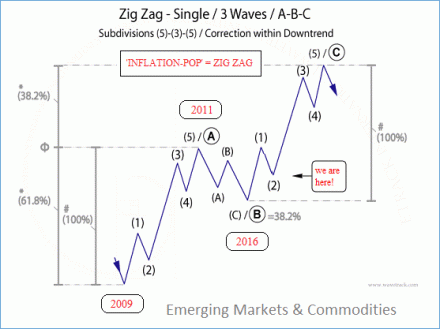
The Inflation-Pop advance is characterised by an Elliott Wave A-B-C zig zag pattern which began lifting prices higher for Stocks, Bonds, Emerging Markets and Commodities from the financial-crisis lows of 2008/09. Specifically, this A-B-C zig zag upswing is depicting the exact pattern of Emerging Market indices and many different Commodities, like benchmark Copper – see fig #5.
US Dollar Timing
But it’s also applicable to the ongoing direction of the US$ dollar. With Commodity prices set to resume wave C of the zig zag this year, in 2020, triggering the next stage of significant price advances, this will undoubtedly signal the TIMING for a declining dollar.
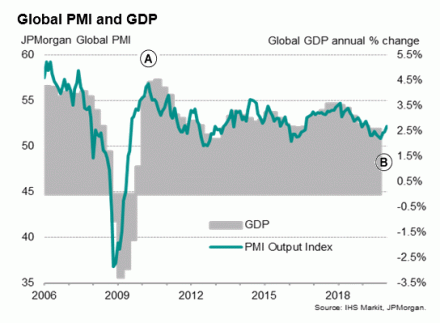
The latest Global Purchasing Managers Index (PMI) and GDP data from IHS Markit/JP Morgan corroborates the ‘Inflation-Pop’ outlook – see fig #6. We’ve annotated primary waves A and B onto the data where a sharp rise occurs for wave A from the financial-crisis lows, peaking in late-2010/early-2011, the same time that commodities and emerging market indices peaked.
Wave B’s corrective downswing has taken far longer than we first imagined. Commodities and EM’s have since ended their corresponding wave B lows in early-2016 in what was termed at the time as the Grand ‘Re-Synchronisation’ lows. But for the Global PMI, wave B is only now approaching downside completion. Just imagine what fundamental, economic conditions will arise as advances unfold as wave C!! Upside targets for wave C are towards the 70-75 point level, a massive advance over the next few years.
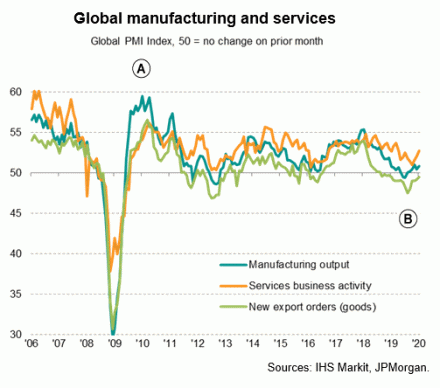
The Global Manufacturing & Services index, again courtesy of IHS Markit/JP Morgan shows exactly the same A-B-C zig zag pattern in upside progress, where wave B is ending now, wave C is set to explode higher – see fig #7.
For sure, 2020 is going to be a spectacular year.
Interest Rates
We already know that interest rates are artificially low. However, not only from a historical mean average but also from the fact that central banks are openly manipulating lower rates in an effort to maintain global economic growth following the financial-crisis collapse. This raises some big questions! Can central banks begin rebalancing rates higher as the economy grows? Or is it still too fragile? Could some exogenous event stymie efforts to support the financial system in the event of a recession? Or worse, another economic meltdown?
The Federal Reserve under Jerome Powell has hinted just recently about misgivings over the increasing national debt. The Treasury Department projected the budget deficit for the first four months of fiscal 2020 as $389.2 billion, a 25% per cent gain over the last year. Over the past 12 months, the gap has been nearly $1.1 trillion as the national debt has swelled past $23 trillion.
Total household debt rose by $193 billion during the last quarter of 2019, continuing a five-year upward trend. It now stands $1.5 trillion higher, in nominal terms, than the pre-recession peak of $12.7 trillion reached in 2008.
Powell added that the central bank wanted to update its policy-setting manual to address an economic environment in which falling inflation was potentially a more pressing problem than rising inflation. That’s ironic because it won’t be long before the natural forces of inflation begin to rise anyway.
Interest Rates and US10yr Breakeven Inflation TIPS rate
Earlier, we looked at global PMI data and could see it matched the ‘Inflation-Pop’ schematic, a rising A-B-C zig zag pattern where wave C is about to surge higher, lasting the next few years. Now look at this next graph – see fig #8. It depicts the US10yr Breakeven Inflation TIPS rate where the advance from the financial-crisis low of 0.077 is advancing into the same inflation-pop zig zag.
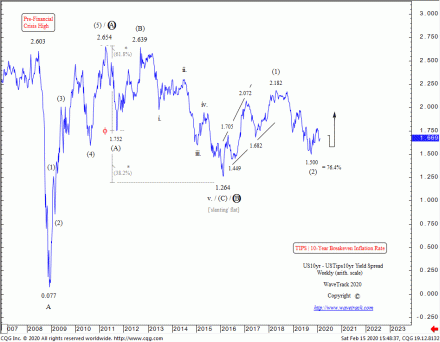
Interest Rates Elliott Wave Forecast by WaveTrack International – US10yr Breakeven Inflation TIPS rate
Primary wave A’s advance completed into the April ’11 peak of 2.654%, around the same time as corresponding peaks in commodities and emerging markets. Wave B then declined, finishing into the Grand ‘Re-Synchronisation’ lows of February ’16 at 1.264%. And since then, primary wave C has begun to trend higher beginning with 1st and 2nd waves within the ongoing (1)-(2)-(3)-(4)-(5) uptrend. Wave (5) has ultimate targets towards 4.247% which means much higher inflationary pressures are about to begin.
Should the TIPS chart be accurate as we believe it will, then the Federal Reserve will end-up being well behind the curve as they hesitate to stem the rising inflationary pressures. As a result, catching them unawares in a similar event to the 1970’s.
Interest Rates and Longer-term Outlook
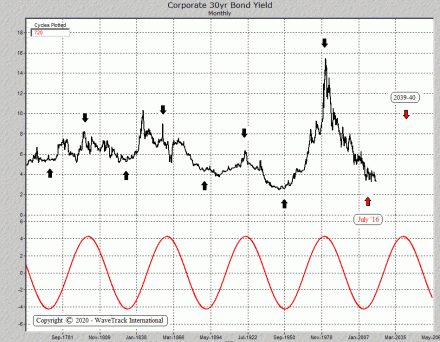
The long-term triple AAA corporate bond yield cycle certainly depicts an artificial prolongation of low interest rates – see fig #9. Whilst rising interest rates will undoubtedly be damaging for the U.S. and global economy further down the road, in its early stage of this next advance, it will simply be interpreted by central banks as a natural shift towards normalisation. And under these conditions, asset prices can explode higher, only to burst the inflation-pop bubble sometime later.
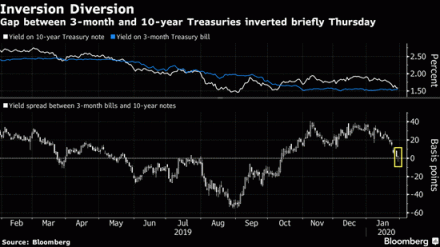
These bullish asset/inflation-pop uptrends are not shared by the consensus analysis. So far this year, two investment banks, UBS and UniCredit have come out with forecasts of three, maybe four consecutive ¼ quarter-point interest rate cuts by the Federal Reserve. That’s a pretty downbeat forecast. But that’s not all – economists are again focusing on the fact that the US dollar yield curve has inverted where US3-month yield/US10yr yield is again trading negatively. Analysis suggests this is the prelude to a recession – see fig #10.
However, that doesn’t stack up against the Elliott Wave analysis – quite the contrary.
New Currencies & Interest Rates 2020 Video – PART III/III
We’ve amassed over 90 charts (a new record!!) from our EW-Forecast database in this year’s Currencies & Interest Rates 2020 video. Each one provides a telling story into the way Elliott Wave price trends are developing in this next INFLATION-POP’ phase of cycle development. Moreover, we’re taking a look at some very specific patterns that span the entire 15.6-year US$ dollar cycle, explaining its current location and why inflation will trigger huge US$ dollar declines but simultaneously appreciating major Emerging Market and Asian Currencies.
Furthermore, we’re updating some amazing Elliott Wave forecasts for U.S. interest rates, US10yr, US10yr, US05yr and even US02yr together with a schematic look at several spread relationships with European rates not forgetting upside targets for the US10yr Inflation Tips – it’s a must-see!
We invite you to take this next step in our financial journey with us – video subscription details are below – just follow the links and we’ll see you soon!
Most sincerely,
Peter Goodburn
Founder and Chief Elliott Wave Analyst
WaveTrack International
Currencies and Interest Rates Video Content
90 charts | 2 hours
The contents of this CURRENCY & INTEREST RATES VIDEO include Elliott Wave analysis for:
Currencies:
• US$ index
• Euro/US$
• Stlg/US$
• US$/Yen
• US$/CHF
• AUD/US$
• NZD/US$
• US$/CAD
• Euro/Stlg
• Euro/Yen
• Euro/CHF
• Euro/NOK
• Stlg/Yen
• Stlg/ZAR
• Stlg/AUD
• Asian ADXY
• US$/KRW
• US$/SGD
• US$/INR
• US$/TWD
• US$/THB
• US$/MYR
• US$/IDR
• US$/PHP
• US$/BRL
• US$/RUB
• US$/CNY
• US$/ZAR
• US$/MXN
• US$/ARS
• US$/TRY
• US$/PLZ
• Bitcoin
Interest Rates:
• U.S. AAA+ 30-Year Corporate Bond Yields
• US30yr Yield
• US10yr Yield
• US05yr Yield
• US02yr Yield
• US10yr TIPS Break-Even Inflation Rate
• US10yr Tips Yield
• Various Spreads
• DE10yr Yield
• ITY10yr Yield
• JPY10yr Yield
CONTACT US NOW VIA EMAIL – SELECT YOUR PACKAGE
Single Video – *$48.00 – PART III CURRENCY and INTEREST RATES Video Outlook 2020 (February 2020)
Triple Package offer – *$96.00 (saving 33%)! – PART I – PART II – PART III (January – March ’20)
*(additional VAT may be added depending on your country – currently US, Canada, Asia have no added VAT but most European countries do)
PART III will be available in a few weeks’ time – we’re working on it!
HOW CAN YOU RECEIVE THE VIDEO FORECAST?
To receive your VIDEO UPDATE please click here to contact us.
– Please state if you wish to purchase the SINGLE VIDEO – Currencies and Interest Rates Video Outlook 2020 for USD *48.00 and send us an email to services@wavetrack.com?
– Or opt for the TRIPLE PACKAGE for USD *96.00 in total?
– Next we will send you a PayPal payment request and provide you with the video link & PDF report once payment is confirmed. Please know the reply can take up to 6 hours due to time zone differences. But rest assured we will give our best to provide you with the information as soon as possible!
*(additional VAT may be added depending on your country of residence. Currently, the US, Canada, Asia have no added VAT but most European countries do)
We’re sure you’ll reap the benefits – don’t forget to contact us with any Elliott Wave questions – Peter is always keen to hear your views, queries, and comments.
Visit us @ www.wavetrack.com
Crude Oil – Elliott Wave Tutorial – When is a diagonal not a diagonal?
by WaveTrack International| February 7, 2020 | 3 Comments
Elliott Wave Tutorial – Example Crude Oil
Read more «Crude Oil – Elliott Wave Tutorial – When is a diagonal not a diagonal?»
Tesla Inc.
by WaveTrack International| January 24, 2020 | 4 Comments
– 3rd Wave Upside Target Towards 662.00-691.00+/- Tesla
SP500 – Symmetry in Motion – Expanding Flat
by WaveTrack International| January 23, 2020 | No Comments
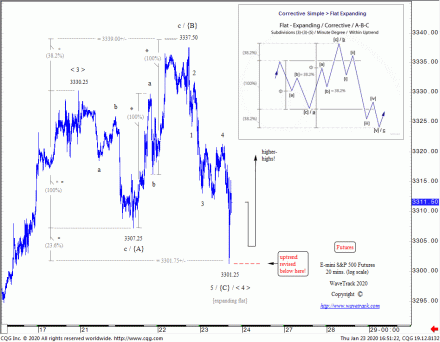
The SP500 has just completed a short-term {A}-{B}-{C}, 3-3-5 Expanding Flat pattern at 3301.25. This confirms a continuation to the upside over the next few trading-days
SP500 – Symmetry in Motion – Expanding Flat
The SP500 is closing-in on reaching upside targets for the completion of October’s five wave impulse uptrend. Activity so far this week is confirming one additional but final push higher following the completion of an {A}-{B}-{C}, 3-3-5 expanding flat pattern that ends a 4th wave correction from last Friday’s high of 3330.25 into today’s low, traded just a moment ago, at 3301.25.
SP500 and Fibonacci Price Ratios
Note the 3-3-5 wave structure of the expanding flat. Wave {A}’s decline unfolded into a typical zig zag ending at 3307.25. Wave {B}’s advance was another zig zag, this time, unfolding where waves a and c measure by a fib. 100% equality ratio into the high at 3337.50. And finally, wave {C}’s decline as a five wave impulse pattern ending at 3301.25.
And now, corroborating the expanding flat, fib-price-ratios can be overlaid to the pattern. For instance, extending wave {A} by a fib. 38.2% ratio projects the upside completion of wave {B} to 3339.00+/-. Also, extending wave {A} by a fib. 23.6% ratio projects wave {C} to 3301.75+/-. Not bad!
Conclusion
The completion of the expanding flat pattern confirms the prevailing uptrend is still engaged to the upside. However, it will be negated should the SP500 break more immediately below 3301.25. Looking ahead, any higher-high will most likely be the concluding sequence to October’s larger five wave uptrend.
Insights to WaveTrack’s SP500 longer-term forecasts you can get by purchasing PART I of our annual video-trilogy of long/medium-term ELLIOTT WAVE price-forecasts:
• PART I – STOCK INDICES Video Outlook 2020 – OUT NOW!
Click here to read more about the video – Part I.: STOCK INDICES
WaveTrack’s Elliott Wave Compass report
Get WaveTrack’s latest SP500 forecasts by subscribing to the Elliott Wave Compass report.
The ELLIOTT WAVE COMPASS report focuses on the shorter-term perspective of price development. The report is comprised of two online updates per week describing and illustrating a cross-section of market trends/counter-trends for stock indices, bonds, currencies and commodities from around the world. This report is ideal for professional and private clients trading a time horizon of just a few days to a few weeks ahead.
The bi-weekly EW-Compass report offer short-term perspective for global markets
· Stock Indices
· Bonds
· Currencies (FX)
· Commodities
If you like to know more details about the Elliott Wave Compass report click here, please click here
Commodities Video 2020 – Q1 Sell-Off – Lift-Off Q2!
by WaveTrack International| January 18, 2020 | No Comments
Commodities – Q1 Sell-Off – ‘Inflation-Pop’ Lift-Off Q2 Onwards!
THIS REPORT INCLUDES ANALYSIS ON MEDIUM-TERM CYCLES & EQUITY MINERS
We’re pleased to announce the publication of WaveTrack’s annual 2020 video updates of medium-term ELLIOTT WAVE price-forecasts. Today’s release is PART II, COMMODITIES – Part I was released last month and Part III will be published in early-February.
• PART I – STOCK INDICES – out now!
• PART II – COMMODITIES – out now!
• PART III – CURRENCIES & INTEREST RATES – coming soon!
Elliott Wave Forecasts for 2020 – Summary
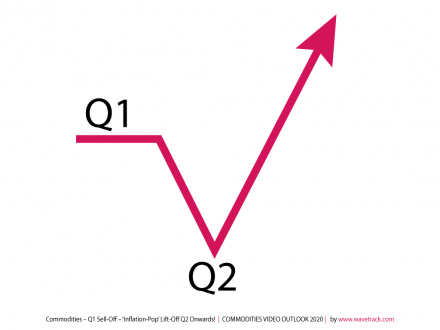
Q1 Sell-Off – ‘Inflation-Pop’ Lift-Off Q2 Onwards!
Secular-bull uptrends in U.S. stock markets that resumed from the financial-crisis lows of 2008/09 are intimately linked to the corresponding price advances in commodity markets. Despite comparable uptrends from those 2008/09 lows, from an Elliott Wave perspective, the definition of an uptrend doesn’t apply to many commodities, whether they’re Base Metals, Precious Metals or Energy contracts like Crude/Brent Oil.
Whereas U.S. stock markets are still engaged in long-term five wave impulse uptrends that began from the Great Depression lows of 1932, Elliott Wave analysis identifies Base Metals and Energy contracts ending their corresponding Commodity Super-Cycle peaks much earlier, in year-2006/08. Everything that has so far followed is part of a multi-decennial corrective pattern, specifically, an A-B-C expanding flat where wave B allows a push to new record highs. Those B wave advances correspond to 5th wave advances in U.S. stock markets.
Back in year-2010, we termed this B wave advance as the ‘Inflation-Pop’ cycle because it was destined to trigger several years of rising inflationary pressures, as asset prices were driven higher by central bank’s monetary policy and quantitative easing measures. Fast-forward to 2020, those rising inflationary pressures are about to get another kick higher.
Commodities and US$ Dollar Outlook
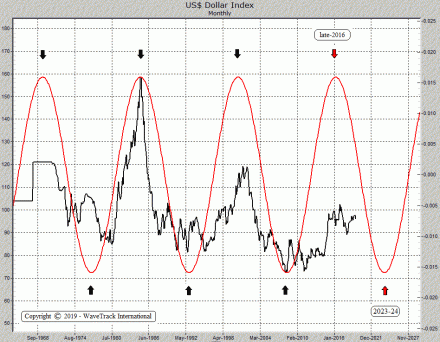
One contributor that’s expected to drive asset values significantly higher over the next few years is a weakening US$ dollar – see fig #1. There’s a distinct 15.6-year cycle recurrence for the US$ dollar index which has signalled the various peaks and troughs over the past several decades.
The last time the cycle peaked was late-2016 when the US$ dollar index traded to a high of 103.82. This is a centrally-translated cycle where peaks and troughs alternate in similar time-intervals of 7.8-years which means the late-2016/early-2017 cycle downturn will last approximately 7.8-years into the next 15.6-year cycle trough due in years 2023/24.
Basis Elliott Wave analysis dating back to the historical peak of 164.72. This puts the dollar on a crash-course for declines below pre-financial-crisis lows!
Commodities and Interest Rate Outlook
Another contributor to rising inflationary pressures will be the triggering of a new uptrend in interest rates.
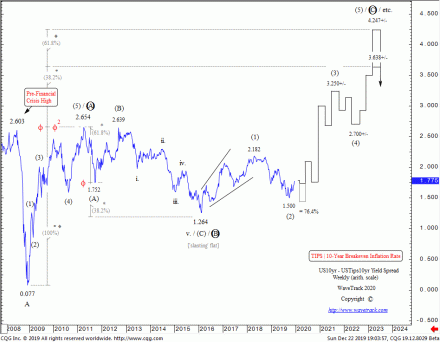
The US10yr Breakeven Inflation Rate (TIPS) yield is nearing the completion of a counter-trend downswing that began in early-2018 – see fig #2. This correction was forecast in the 2018 annual Interest Rate report – ‘The recent break for the US10yr treasury yield above the 2017…indicates further upside potential into the end of Q1 ’18, beginning of Q2 targeting 3.360+/-…Once completed, a multi-month corrective decline would then begin, pulling yields sharply lower…The US10yr TIPS Breakeven Inflation Rate Spread indicates an interim peak forming at the same time as treasury yields…This suggests worries over the re-emergence of inflationary pressures will abate for a while…’. – a while has turned out to be almost 2-years!
Ten-year treasury yields are expected to undergo another downswing into Q1 2020 before forming an historical base, then trending higher to begin a new 30-year cycle. This could pull the US10yr Breakeven Inflation Rate (TIPS) yield slightly below current levels of 1.500 although only marginally, before trending higher too. The outlook over the next few years is amazing! Upside targets are towards 4.247%!! We’ll explain more in PART III of the annual report, but until then, suffice to know that a primary degree A-B-C zig zag pattern has been unfolding since the end of the financial-crisis of 2008/09.
Rising Food & Agriculture Prices
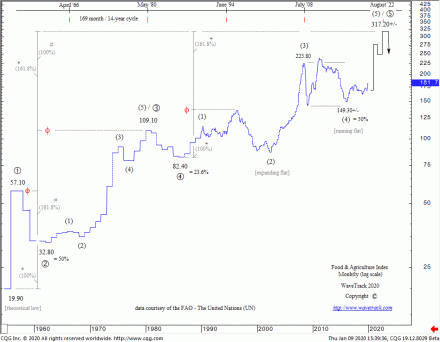
Whilst this annual 2020 Commodities report doesn’t include analysis of grains and soft commodities, we can get an overview of trends from studying the Food and Agriculture Organization (FAO) price index – see fig #3.
The historical data begins from the 1950’s – there’s a clearly defined Elliott Wave impulse pattern, a primary degree five wave impulse sequence, 1-2-3-4-5 engaged to the upside. This multi-decennial uptrend began primary wave 5 from the June ’86 low of 82.40. It has steadily advanced since, subdividing into an intermediate degree uptrend, (1)-(2)-(3)-(4)-(5) where wave (5) began lifting prices higher from the grand ‘Re-Synchronisation’ lows of early-2016, from 149.30.
Food and Agriculture Organization Index
In the last month, the Food and Agriculture Organization (FAO) reported the index, which measures monthly changes for a basket of cereals, oilseeds, dairy products, meat, and sugar jumped to its highest point since Dec.’14, averaging 181.7 points, up 2.5% on the previous month.
The cereal price index rose 1.4% to average 164.3 points, led by higher prices for wheat with stronger demand from China and logistics problems following strikes in France. Rice prices were little changed. Vegetable oil prices were up strongly, with the index rising 9.4% to 164.7 points in December. Palm oil prices rose for the fifth month in a row, lifted by biodiesel demand, while soy, sunflower, and rapeseed oil values also increased.
The dairy price index averaged 198.9 points in December. Precisely, up 3.3% with higher cheese and skim milk powder prices that outweighed lower butter and whole milk powder values. The sugar price index was up 4.8% to 190.3 points, lifted by surging demand for ethanol caused by rising crude oil prices.
By contrast, meat prices were almost unchanged from November with the meat price index at 191.6 points with higher pig and sheep meat prices balanced by falling beef prices.
But what does this tell us? Well, from an Elliott Wave perspective, there’s a long way to go before reaching intermediate wave (5)’s ultimate upside target of 317.20+/-. That can only mean one thing – rising prices = rising inflationary pressures.
Q1 Sell-Off!
Before commodity prices launch higher, we expect Base Metals & Energy to trade lower during the first-quarter Q1-2020 period.
Base metals like Copper etc. haven’t quite finished Elliott Wave corrections that began from the early-2018 peaks. Crude/Brent Oil began a three wave, A-B-C corrective downswing from the Oct.’18 highs of $76.90 and $86.74. However, wave C remains in downside progress. This can only suggest some form of economic deterioration. A possible weakness for the first few months of 2020, pulling commodity prices lower to finalise these 2018 corrections.
Commodities and the Baltic Dry Index
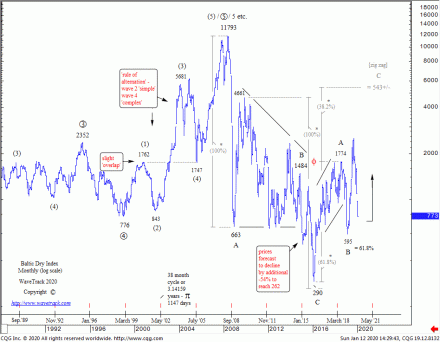
One leading indicator worth tracking for signs of an economic downturn is London’s Baltic Dry Index (BDI) – see fig #4. The historical data begins from the late-1980’s. It tracks rates for capesize, panamax and supramax vessels that ferry dry bulk commodities around the world. The BDI began a new uptrend from the grand ‘Re-Synchronisation’ lows of early-2016, from 290.00. Elliott Wave analysis forecasts this advance beginning a decennial A-B-C zig zag upswing. Wave A ended an initial advance into the July ’18 high of 1774.00 – wave B completed a counter-trend decline into the Feb.’19 low and wave C is now engaged in a multi-year five wave uptrend targeting levels towards 543.00+/-. That’s a huge gain over the next several years, reflecting an increase in shipping goods around the world, ergo, rising inflationary pressures.
But in the last couple of months, a deep 2nd wave correction has unfolded within wave C’s five wave uptrend. It began from the Sep.’19 high of 2442.00 and is still heading lower – so far, a low into early-January of 773.00 reflects a decline of -69% per cent. If this is a leading indicator, then we can certainly expect other hard commodities to fall back during the first-quarter too!
Precious Metals Outlook
The outlook for Gold leads our analysis for 2020. Much has been written about its price direction since 2016 when gold rose by +30% per cent, from $1046.45 to $1375.27. When prices broke above $1375.27 in June (2019) last year, every analyst under the sun turned super-bullish. That’s not entirely unexpected – large institutional investors have been sidelined for several years, since gold peaked at $1921.50 back in 2011 – but now, they’re back in force. Only last week (Jan. 10th), the latest COT net speculative long-positioning was at its highest for over 10-years at 322,200 contracts. That’s a warning that a corrective downswing is due to commence.
The Gold Question
But the more important question is ‘what is the dominant trend for gold and the other precious metals?’.
This year’s going to be make or break for precious metals. Whilst the gold mining stocks look set to explode higher later this year (just not now), bullion gold, silver and platinum may struggle to keep pace. The problem is this: 2011’s declines in both gold and silver can be counted as ending five wave impulse downtrends into the late 2015 lows. If so, it will be impossible for them to break to new record highs during the latter stages of the decennial ‘inflation-pop’ cycle. So everything rests upon whether those 2011-2015 declines are impulsive or corrective.
If gold miners are set for record highs, shouldn’t bullion follow? That seems logical and remains as our preferential bullish counts to this day. But that doesn’t mean we’re complacent either – we’re continuing to track gold’s three price-swing advance from 2015’s low whilst comparting this to silver’s relative underperformance. So far, the pendulum between medium-term bullish versus bearish forecasts has swung a little more to the bearish side basis recent developments. Gold reacted from just below zig zag measurements of 2015’s advance at last week’s high of 1611.37 – meanwhile, silver was still trading far below 2016’s initial high of 21.14 and more importantly, remaining below last September’s high of 19.666.
Together, these aspects suggest significant downside risk over the coming months. Declines may not yet reveal the true path over the medium-term, but they will clarify its intention should prices decline as deep as we expect them to – the secret is to remain open to these varying possibilities – both bullish and bearish Elliott Wave patterns are shown/discussed in this PART II series report/video.
New Commodities 2020 Video – PART II/III
We’ve amassed over 90 commodity charts from our EW-Forecast database in this year’s Commodities 2020 video – A NEW RECORD! Each one provides a telling story into the way Elliott Wave price trends are developing in this next ‘INFLATION-POP’ phase of cycle development. We’re taking a look at some very specific patterns that span the entire SUPER-CYCLE, explaining why the super-cycle began from the GREAT DEPRESSION lows of 1932 and not from the lows of 1999 and how this ended in 2006-2008 and why the multi-decennial corrective downswing that began soon afterwards is taking the form of a very specific, but identifiable Elliott Wave pattern.
We invite you to take this next step in our financial journey with us – video subscription details are below – just follow the links and we’ll see you soon!
Most sincerely,
Peter Goodburn
Founder and Chief Elliott Wave Analyst
WaveTrack International
Commodities Video Part II Contents: 92 charts
• CRB-Cash index + Cycles
• Copper + Cycles
• Aluminium
• Lead + Cycles
• Zinc + Cycles
• Nickel
• Tin
• XME Metals & Mining Index
• BHP-Billiton
• Freeport McMoran
• Antofagasta
• Anglo American
• Kazakhmys Copper
• Glencore
• Rio Tinto
• Teck Resources
• Gold + Cycles
• GDX Gold Miners Index
• Newmont Mining
• Barrick Gold
• Agnico Eagle Mines
• AngloGold Ashanti
• Silver + Cycles
• XAU Gold/Silver Index
• Platinum
• Palladium
• Crude Oil + Cycles
• Brent Oil
• XLE Energy SPDR Index
CONTACT US NOW VIA EMAIL – SELECT YOUR PACKAGE
Single Video – *$48.00 – PART II COMMODITIES Video Outlook 2020 (January 2020)
Triple Package offer – *$96.00 (saving 33%)! – PART I – PART II – PART III (January – March ’20)
*(additional VAT may be added depending on your country – currently US, Canada, Asia have no added VAT but most European countries do)
PART III will be available in a few weeks’ time – we’re working on it!
HOW CAN YOU RECEIVE THE VIDEO FORECAST?
To receive your VIDEO UPDATE please click here to contact us.
– Please state if you wish to purchase the SINGLE VIDEO – Commodities Video Outlook 2020 for USD *48.00 and send us an email to services@wavetrack.com?
– Or opt for the TRIPLE PACKAGE for USD *96.00 in total?
– Next we will send you a PayPal payment request and provide you with the video link & PDF report once payment is confirmed. Please know the reply can take up to 6 hours due to time zone differences. But rest assured we will give our best to provide you with the information as soon as possible!
*(additional VAT may be added depending on your country of residence. Currently, the US, Canada, Asia have no added VAT but most European countries do)
We’re sure you’ll reap the benefits – don’t forget to contact us with any Elliott Wave questions – Peter is always keen to hear your views, queries, and comments.
Visit us @ www.wavetrack.com
‘ Inflation – Pop ’ Lift-Off! – T-Minus 3 Months & Counting…
by WaveTrack International| January 7, 2020 | No Comments
‘ Inflation – Pop ’ Lift-Off! – T-Minus 3 Months & Counting…
Part I of our Annual 2020 Elliott Wave forecasts has been published, outlining Stock Index trends for the coming year and beyond.
This year’s major theme is a resumption of the ‘Inflation-Pop’ cycle.
Following a 2-year pause in inflationary pressures that resumed in early-2016, i.e. lows for developed stock indices, emerging markets, and commodities, trends are about to change direction once again. This time, US10yr Inflation-TIPS are ending their two-year corrections. And are now set to surge higher from around the end of Q1 2020 onwards. Various commodities that have been engaged in two-year corrective downswings are also approaching major lows, timed into the late-March/April period. Take a look a Copper prices and you’ll see what I mean!
This year’s expectation of U.S. GDP remaining around current levels of 2.0% or 2.25% per cent is an underwhelming forecast but the consensus majority. From an Elliott Wave perspective, the US$ dollar is forecast significantly lower, timed to its declining 7.8-year cycle. And this, in turn, is set to ignite various asset prices significantly higher.
Gail Fosler’s Forecast
But this outlook is not just a perspective drawn from our Elliott Wave analysis. It’s corroborated by one of the U.S.’s most prominent economists, Gail Fosler. The Wall Street Journal twice named Fosler America’s most accurate economic forecaster.
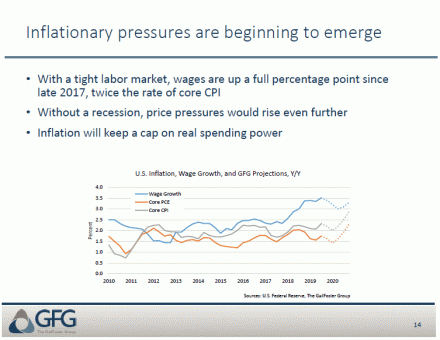
In Gail’s latest research note, she highlights several distinct aspects evolving in the Global and U.S. economy – two of which point towards rising inflationary pressures and a weakening US$ dollar – see fig’s #1 & #2.
With inflationary pressures beginning to emerge, she highlights (fig #1):
Read more «‘ Inflation – Pop ’ Lift-Off! – T-Minus 3 Months & Counting…»
Stock Indices Video Outlook 2020
by WaveTrack International| December 29, 2019 | No Comments
Stock Indices Video Outlook 2020 – ‘Inflation-Pop’ Lift-Off! – T-Minus 3 Months & Counting…
This report combines ELLIOTT WAVE with updated SENTIMENT & ECONOMIC INDICATOR STUDIES
We’re pleased to announce the publication of WaveTrack’s Annual 2020 video updates of medium-term ELLIOTT WAVE price-forecasts. Today’s release is PART I, Stock Indices Video Outlook 2020 – Parts II & III will be published during January/February.
• PART I – STOCK INDICES
• PART II – COMMODITIES
• PART III – CURRENCIES & INTEREST RATES
Elliott Wave Stock Indices Video Outlook 2020 – Summary
Dow Jones On-Course for Long-Term 40,000 Upside Targets
Back in November/December 2014, five years ago, the Dow was trading at 17817.00, approaching original upside targets forecast back in 2010. However, this secular-bull peak wasn’t aligned to the completion of corresponding ‘Inflation-Pop’ upside targets for Emerging Market indices and key Commodities like Copper and Crude Oil.
This was a big hint that the secular-bull uptrend in the Dow Jones (DJIA) and other developed market indices were far from completed. Further analysis revealed some amazing Fibonacci-Price-Ratio (FPR) ‘proportion’ values across the entire history of its major five wave impulse uptrend dating back to the Great Depression lows of 1932 – see fig #1. They coalesced towards Dow 40,000! Read more «Stock Indices Video Outlook 2020»
2020 – Next Stage of the ‘Inflation-Pop’
by WaveTrack International| December 17, 2019 | No Comments
The Next Stage of the ‘Inflation-Pop’ is Getting Underway in 2020!
2020 – the next stage of the ‘Inflation-Pop’ is getting underway!
EuroStoxx 50 – Forecast Mid-Year Triple Video Series!
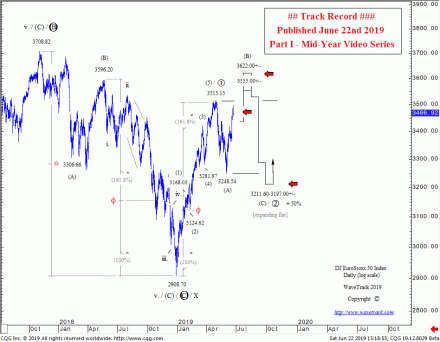
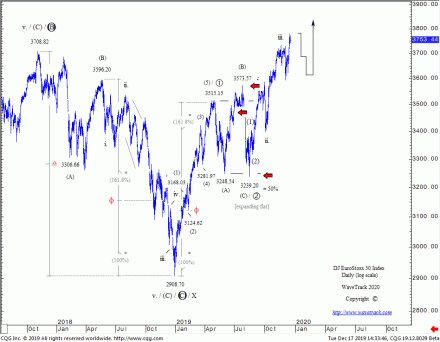
Last June’s Mid-Year 2019 Video Report forecast a 2nd wave corrective downswing for the Eurostoxx 50 unfolding from April’s high of 3515.15 – it had a lot to do to achieve this forecast, but that’s the power of the Elliott Wave Principle!
The 2nd wave correction labelled primary wave 2 was forecast unfolding into an expanding flat pattern, (A)-(B)-(C) subdividing 3-3-5. Wave (B) upside forecasts were towards 3555.00+/- to max. 3622.00+/- which ultimately ended at 3573.57! Next came the forecast for wave (C)’s five wave decline targeting 3211.60, max. 3197.00+/-. However, the actual low formed in early-August at 3239.20!
EuroStoxx 50 – Result! Track Record
The result was phenomenal! – the Eurostoxx 50 then began a huge advance to begin primary wave 3. As a result, since August, there’s been a gain of almost +16% per cent!
It’s been a similar story for the S&P 500 and many other world indices too.
We’re getting ready to publish the Annual 2020 PART I Video Report before month-end (December). If you like this example of applying Elliott Wave forecasting with our proprietary use of Fibonacci-Price-Ratio analysis, then keep a look-out for our announcements within the next couple of weeks!
We hope you’ll join us in tracking some amazing inflation-led forecasts for the coming year!
WaveTrack’s Elliott Wave Compass report
Get WaveTrack’s latest Nasdaq forecasts by subscribing to the Elliott Wave Compass report.
The ELLIOTT WAVE COMPASS report focuses on the shorter-term perspective of price development. The report is comprised of two online updates per week describing and illustrating a cross-section of market trends/counter-trends for stock indices, bonds, currencies, and commodities from around the world. This report is ideal for professional and private clients trading a time horizon of just a few days to a few weeks ahead.
The bi-weekly EW-Compass report offer short-term perspective for global markets
· Stock Indices
· Bonds
· Currencies (FX)
· Commodities
If you like to know more details about the Elliott Wave Compass report click here, please click here
Nasdaq 100 – Downswing Test
by WaveTrack International| December 3, 2019 | No Comments
Nasdaq 100 – Corrective Zig Zag Downswing Test at 8168.25+/-
Read more «Nasdaq 100 – Downswing Test»
SP500 – Approaches Upside Targets!
by WaveTrack International| October 30, 2019 | 22 Comments
SP500 – Leading/Expanding-Diagonal Approaches Upside Targets!
Read more «SP500 – Approaches Upside Targets!»
« go back — keep looking »