Stock Indices Video Outlook 2020
by WaveTrack International| December 29, 2019 | No Comments
Stock Indices Video Outlook 2020 – ‘Inflation-Pop’ Lift-Off! – T-Minus 3 Months & Counting…
This report combines ELLIOTT WAVE with updated SENTIMENT & ECONOMIC INDICATOR STUDIES
We’re pleased to announce the publication of WaveTrack’s Annual 2020 video updates of medium-term ELLIOTT WAVE price-forecasts. Today’s release is PART I, Stock Indices Video Outlook 2020 – Parts II & III will be published during January/February.
• PART I – STOCK INDICES
• PART II – COMMODITIES
• PART III – CURRENCIES & INTEREST RATES
Elliott Wave Stock Indices Video Outlook 2020 – Summary
Dow Jones On-Course for Long-Term 40,000 Upside Targets
Back in November/December 2014, five years ago, the Dow was trading at 17817.00, approaching original upside targets forecast back in 2010. However, this secular-bull peak wasn’t aligned to the completion of corresponding ‘Inflation-Pop’ upside targets for Emerging Market indices and key Commodities like Copper and Crude Oil.
This was a big hint that the secular-bull uptrend in the Dow Jones (DJIA) and other developed market indices were far from completed. Further analysis revealed some amazing Fibonacci-Price-Ratio (FPR) ‘proportion’ values across the entire history of its major five wave impulse uptrend dating back to the Great Depression lows of 1932 – see fig #1. They coalesced towards Dow 40,000!
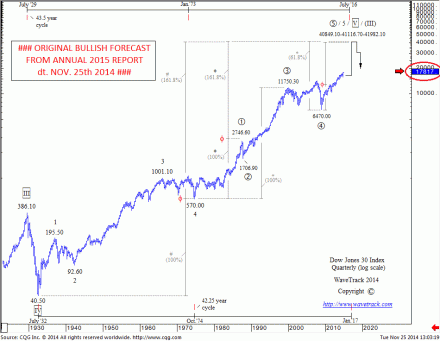
Stock Indices Video Outlook 2020 – Dow Jones 30 – Track Record and Forecast 2014 by WaveTrack International
Secular-Bull Uptrend
The secular-bull uptrend was labelled unfolding into a cycle degree pattern, 1-2-3-4-5. Extending waves 1-4 by a fib. 161.8% ratio projected ultimate upside targets for wave 5 towards 41116.70+/-,
1 (40.50) – 4 (570.00) x 161.8% = 5 @ 41116.70
Furthermore, subdividing cycle wave 5 into primary degree, 1-2-3-4-5, a fib-price-ratio convergence forms at 41982.10+/- where primary wave 5 unfolds by a fib. 61.8% correlative ratio of waves 1-3,
1 (570.00) – 3 (11750.30) x 61.8% = 5 @ 41982.10
Subdividing primary wave 5 into intermediate degree, (1)-(2)-(3)-(4)-(5) also provides ultimate upside targets for wave (5) towards 39207.00+/- derived by extending wave (1) by a fib. 161.8% ratio,
(1) [6470.00-12391.30] x 161.8% = (5) @ 39207.00
These three upside targets average out at 40768.60+/-
As a result, proportionally, symmetrically and harmonically, Dow 40k remains to this day, a very realistic probability of being reached before the secular-bull uptrend is completed.
Timing the ‘Inflation-Pop’ Peak
In order to determine the secular-bull peak in stock markets, we have to switch methodologies, from Elliott Wave Theory (EWT) to Cycle Theory (CT). In previous annual forecasts, we’ve updated two distinct Dow Jones cycles. Specifically, the 80-year war cycle and the 94-year economic cycle.
The 80-year war cycle chart features again in this year’s 2020 annual stock index report. It illustrates the dates where the cycle begins, from year 1701 which was the Queen Anne’s War. The colonial battleground in America between England and Spain/France through the American Revolutionary war, the American Civil war, World War II and into the next date due in year 2021.
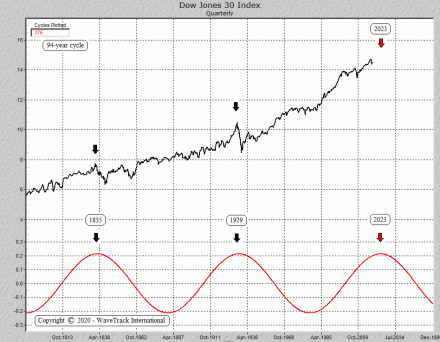
The 94-year cycle connects actual peaks from the historical database that begins from year-1695 – the stock market peaks of 1741-1835-1929 and next to 2023! – see fig #2. That’s a realistic candidate for ending the current secular-bull uptrend!
Stock Indices Video Outlook 2020
From an Elliott Wave perspective, we’ve learned that extremes in sentiment often leads to market peaks and troughs. At these times, a contrarian stance is necessary, despite the allure of herding that captures most into the existing stream of optimism/pessimism.
Over the last 18-months, stock markets have been gripped by the uncertainties surrounding the ongoing trade war between the U.S. and China. Perhaps this will continue, in some limited form for another year or so into 2021. However, a trade war is a better outcome than a military war, conveyed by the 80-year cycle (see above). But a phase-one trade deal now looks likely. Although some skeptics have said this is only a limited trade agreement, it at least shows the two sides are willing to talk and make progress down the line.
Phase-One Trade Deal
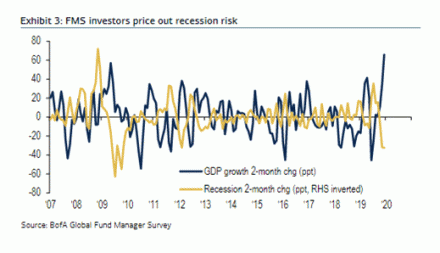
The phase-one trade deal has certainly had an effect over the last month. In December’s (2019’s) latest Fund Manager Survey report, Bank of America/Merrill Lynch have noted that global growth expectations have shot higher by 22 percentage points, reflecting expectations that the world economy will accelerate growth next year (2020) – see fig #3. This was the biggest one-month rise on record. Why did it surge higher? Because up until recently, fund managers had been under-invested, had been in cash and only now are rushing-in to re-allocate. That’s not just over the last month though, this switch began in November but it has had the effect of pushing U.S. indices to record highs in December.
Whenever a surge like this occurs, there’s a heightened risk that a pause will occur soon afterwards. BofA/Merrill Lynch also reports that fund manager’s allocations jumped 10 percentage points to a new 31% per cent overweight in equities during December. This represents the highest level in a year whilst cash levels declined to 4.2% per cent, the lowest since May 2013.
The question this raises is this: will stock markets take a pause into Q1 2020 or will they continue to rocket higher. This year’s annual report lines-up a few answers!
Stock Indices Video Outlook 2020 and SP500 Predictions
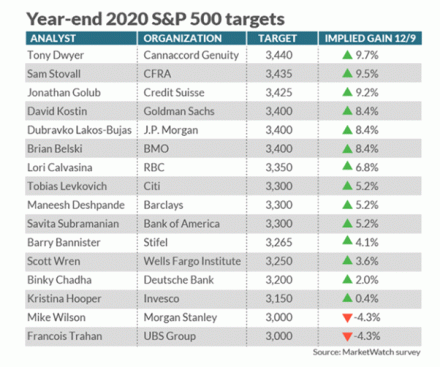
In a survey conducted by MarketWatch, investment-grade analysts were asked for their predictions for the SP500 for 2020. Top strategists on Wall Street unanimously agree that next year’s (2020’s) performance will come nowhere near that of 2019, with only one of those surveyed by MarketWatch predicting the S&P 500 will rise 10% next year while a few are predicting year-over-year declines in the large-cap index. The median was more like 5% per cent gains – see fig #4.
But from an Elliott Wave perspective, gains can be at the top-end of these predictions, if not higher! Our analysis shows that the markets are on the verge of accelerating higher in the next stage of the ‘Inflation-Pop’ cycle. At the very least, given pockets of retracements that consume a month here, a month there, minimum upside targets for the S&P 500 remain at +7.8% per cent gains, and more probably, +22% per cent!
‘Inflation-Pop’ Lift-Off! – T-Minus 3 Months & Counting…
Inflationary pressures were seen as benign basis the last U.S. data figures released earlier this month (December 2019). In the 12 months through November, the PCE price index increased 1.5% after advancing 1.4% in October. Excluding the volatile food and energy components, the PCE price index edged up 0.1% last month, rising by the same margin for the fourth straight month. That lowered the annual increase in the so-called core PCE price index to 1.6% in November from 1.7% in October. The core PCE index is the Fed’s preferred inflation measure and had undershot the U.S. central bank’s 2% target this year.
There’s now widespread expectations that inflationary pressures will remain static over the coming year. Nevertheless, that’s not what Elliott Wave analysis predicts! Rather, inflationary pressures are set to rise dramatically.
US10yr treasury yields
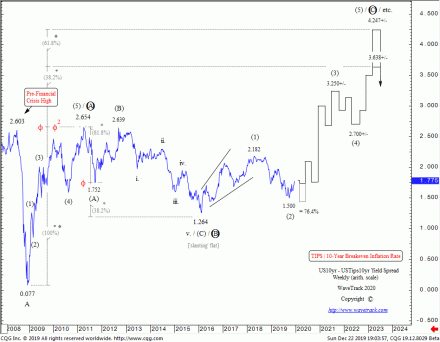
The US10yr Breakeven Inflation Rate (TIPS) yield is nearing the completion of a counter-trend downswing that began in early-2018 – see fig #5. This correction was forecast in the 2018 annual Interest Rate report – ‘The recent break for the US10yr treasury yield above the 2017…indicates further upside potential into the end of Q1 ’18, beginning of Q2 targeting 3.360+/-…Once completed, a multi-month corrective decline would then begin, pulling yields sharply lower…The US10yr TIPS Breakeven Inflation Rate Spread indicates an interim peak forming at the same time as treasury yields…This suggests worries over the re-emergence of inflationary pressures will abate for a while…’. – a while has turned out to be almost 2-years!
Ten-year treasury yields are expected to undergo another downswing into Q1 2020 before forming a historical base, then trending higher to begin a new 30-year cycle. This could pull the US10yr Breakeven Inflation Rate (TIPS) yield slightly below current levels of 1.500 although only marginally, before trending higher too. The outlook over the next few years is amazing! Upside targets are towards 4.247%!! We’ll explain more in PART III of the annual report, but until then, suffice to know that a primary degree A-B-C zig zag pattern has been unfolding since the end of the financial-crisis of 2008/09.
US$ Dollar Outlook
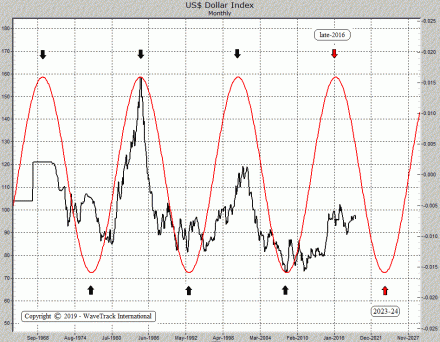
One contributor that’s expected to drive asset values significantly higher over the next year is a weakening US$ dollar – see fig #6. There’s a distinct 15.6-year cycle recurrence for the US$ dollar index which has signaled the various peaks and troughs over the past several decades.
The last time the cycle peaked was late-2016 when the US$ dollar index traded to a high of 103.82. This is a centrally-translated cycle where peaks and troughs alternate in similar time-intervals of 7.8-years which means the late-2016/early-2017 cycle downturn will last approximately 7.8-years into the next 15.6-year cycle trough due in years 2023/24.
Basis Elliott Wave analysis dating back to the historical peak of 164.72. This puts the dollar on a crash-course for declines below pre-financial-crisis lows!
Stock Indices Video Outlook 2020 – Report/Video
Our annual Stock Indices Video Outlook 2020 is PART I of a three-part trilogy series of Elliott Wave analysis and the outlook into the final stages of the ‘Inflation-Pop’ cycle.
We’ll be taking a close introspective look across many U.S. indices. Above all, the large-cap and small-cap trends, but also across many different sectors too including the Banks index, Biotechnology, Technology and many more. Furthermore, we’re also updating some fascinating Elliott Wave counts for several economic data points too. Including Consumer Sentiment, Consumer Confidence, Price to Book Ratio, Price-Sales Ratio and even Robert Shiller’s Cape PE Ratio! It all adds up to one thing – huge gains over the next few years!
European Indices / Emerging Markets + Asia – Australia – Japan
An important aspect related to the next surge higher is the Elliott Wave pattern development of European and Asian indices. These have very different patterns in upside progress from the financial-crisis lows of 20087/09. But they do conform to the ‘Inflation-Pop’ schematic of zig zags or double zig zag advances over multiple decade periods.
If you’re an asset manager located in Europe or Asia, it’s imperative to understand how these benchmark indices fit into the larger U.S. picture!
New Stock Indices Video Outlook 2020 – PART I/III
This ANNUAL STOCK INDICES VIDEO OUTLOOK 2020 is like nothing you’ve seen anywhere else in the world. Tt’s unique to WaveTrack International, how we foresee trends developing through the lens of Elliott Wave Principle (EWP) and how its forecasts correlate with Cycles, Sentiment extremes and Economic data trends.
We invite you to take this next step in our financial journey with us. Video subscription details are below. Just follow the links and we’ll see you soon!
Most sincerely,
Peter Goodburn
Founder and Chief Elliott Wave Analyst
WaveTrack International
Contents Stock Indices Video Outlook 2020
Charts: 71 | Video: 1 hour 52 mins.
CONTACT US NOW VIA EMAIL – SELECT YOUR PACKAGE
Single Video – *$48.00 – PART I Stock Index Video Outlook 2020 (December ’19)
Triple Package offer – *$96.00 (saving 33%)! – PART I – PART II – PART III (January – March ’20)
*(additional VAT may be added depending on your country – currently US, Canada, Asia have no added VAT but most European countries do)
PARTS II & III will be available in a few weeks’ time – we’re working on it!
HOW CAN YOU RECEIVE THE VIDEO FORECAST?
To receive your VIDEO UPDATE please click here to contact us.
– Please state if you wish to purchase the SINGLE VIDEO – Stock Index Video Outlook 2020 for USD *48.00 and send us an email to services@wavetrack.com?
– Or opt for the TRIPLE PACKAGE for USD *96.00 in total?
– Next we will send you a PayPal payment request and provide you with the video link & PDF report once payment is confirmed. Please know the reply can take up to 6 hours. But rest assured we will give our best to provide you with the information as soon as possible!
*(additional VAT may be added depending on your country of residence. Currently, the US, Canada, Asia have no added VAT but most European countries do)
We’re sure you’ll reap the benefits – don’t forget to contact us with any Elliott Wave questions – Peter is always keen to hear your views, queries, and comments.
Visit us @ www.wavetrack.com
Comments
Leave a Reply
