Elliott Wave – Crude Oil – Are Price Trends Predictable?
by WaveTrack International| April 15, 2019 | 3 Comments
Is Crude Oil predictable?
Anyone connected to the financial markets industry knows just how difficult it is to accurately predict price changes, duration and the amplitude of trends. Billions of dollars are spent annually on research derived from varying models, economic, fundamental analysis, mathematical algorithms and even artificial intelligence programmes. But is there efficiency? Has market analysis really improved over the last several decades since the computer revolution?
It seems that more complex ways are being experimented in order to predict price trends but that hasn’t revolutionised the industry. Most large asset managers employ huge teams to outperform major indices which provide the benchmark for performance. However, most active managers are left either underperforming or are marginally ahead of the game. Consider to add all the twists and turns in a market trend together over a year. This would account to a far greater percentage swing than just a trend that measures its starting point in January and its completion in December. Which means there’s a lot of wastage – inefficiency.
Crude Oil or Forecasting Nightmare?
So, it was no surprise to read a recent report from CNBC which ran its story around a senior research analyst working for a major Oil brokerage company based in London, U.K. The analyst commented in its latest research note that ‘There are so many uncertainties surrounding the oil market that it makes it virtually impossible to predict developments for the rest of the week let alone for months or a year ahead’. The report went on ‘There are economic and geopolitical developments to deal with and these can change almost on a daily basis’. The analyst described oil market conditions as a ‘forecasting nightmare’.
Elliott Wave vs. Fundamental Forecasting
Now I’m the first to be sympathetic. I know just how difficult it can be to predict future price development several months in advance. Many analysts have climbed to fame over one maybe two historic calls. A few names, unmentioned here rose to notoriety during the financial-crisis collapse of 2007-09 but have since faded from view. Yes, because it’s difficult.
Most analysts pick their way through short-term calls which are about 3-5% per cent away from current levels, erratic as that performance may be. It’s a bit like two fleas playing ping-pong (table-tennis) on the back of a dog. Yes, they have some idea of the limits of the balls movement. But absolutely no idea about the direction of the dog.
But there’s a methodology that moves away from the ‘incrementalist’ idea of ‘linear-thinking’ which is better tuned into the concept that markets are non-linear progressions of action/reaction processes – and that’s the Elliott Wave (EW) methodology.
Can Elliott Wave predict Crude Oil?
Our specialisation in the EW model has produced some uncanny market calls over the last 25+ years, across all asset classes. Many cannot be scrutinised as random forecasts because of the sheer complexity of pattern, form, price amplitude and duration employed in that analysis. If you’re a mathematician and understand the probability of forecasting such trends, then you’ll know that to predict something so arcuate would be hundreds-of-thousands against – and if repeated, is so mathematically improbable that the only reasoning would be to confirm that there is an underlying law that is being applied in the process.
So when it comes to Crude Oil analysis, let’s see whether the Elliott Wave model has merits.
The next six charts represent a Track Record of EW price forecasts published in WaveTrack International’s bi-weekly and/or monthly analysis covering the last 3-year period.
WaveTrack’s Crude Oil Track Record
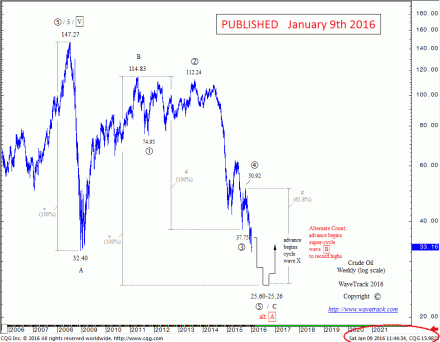
Crude Oil Exhibit 1 – January 9th 2016
Crude Oil is engaged in a three price-swing zig zag decline that began from the July ’08 all-time-record high of $147.27, labelled A-B-C. Basis Elliott Wave and Fib-Price-Ratio analysis, wave C downside targets were measured towards $25.60-25.26+/-. The price at the time of this analysis was at 33.16 which means it was forecasting a decline of approx. $7.50 dollars but then ending the entire zig zag pattern/decline from $147.27, then staging a reversal to begin a new uptrend.
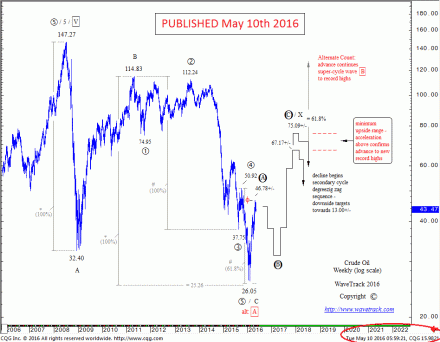
Crude Oil Exhibit 2 – May 10th 2016
Crude Oil ended the three price-swing zig zag decline at 26.05, just $0.45 cents from the projected low. Coincidence? Hardly! The price responded not by any fundamental news at the time – sentiment was very bearish then – but it instead responded to the Laws that define price development as seen through the Elliott Wave Principle. Crude Oil was already trading up to $43.47, a recovery of +66% per cent. And not only that, the updated analysis then projected prices unfolding higher but within specific parameters, or conditions – the advance must unfold higher into a three price-swing formation, labelled A-B-C, and amplitude analysis using Fib-Price-Ratios predicted the advance would end towards $75.09+/-, then turn down dramatically afterwards.
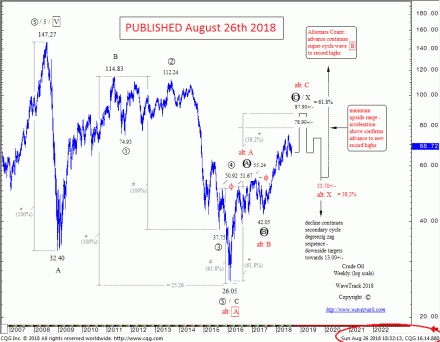
Crude Oil Exhibit 3 – August 26th 2018
It’s taken over 2½ years for the A-B-C zig zag upswing to develop and only in Aug.’18 is it approaching original upside targets of $75.09+/-, now revised to $78.90+/-. But the pattern isn’t quite finished – a little more upside was forecast from current levels of $68.72 to $78.90+/-. Afterwards, a big downswing would begin with initial targets towards 55.70+/-.
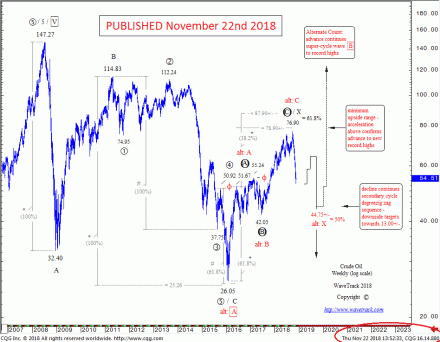
Crude Oil Exhibit 4 – November 22nd 2018
Crude Oil traded up to $76.90 in late-October, ending the A-B-C zig zag pattern that was forecast almost 3-years earlier to $75.09-78.90+/-! The next forecast predicted a decline towards min. $55.70+/-, revised here towards $44.75+/-.
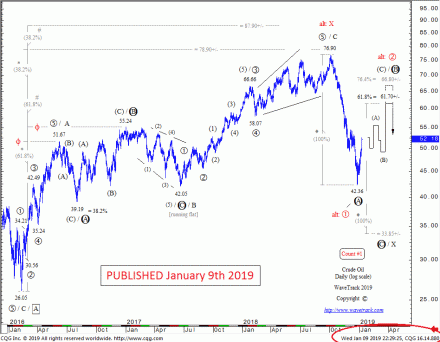
Crude Oil Exhibit 5 – January 9th 2019
Price declines continued down to a final low at $42.36, a massive drop of $34.54 dollars or a -44.9% per cent decline. Elliott Wave analysis then forecast a three price-swing zig zag pattern developing to the upside over several months, labelled (A)-(B)-(C) – upside projections were to min. $61.70+/-, max. $66.80+/-.
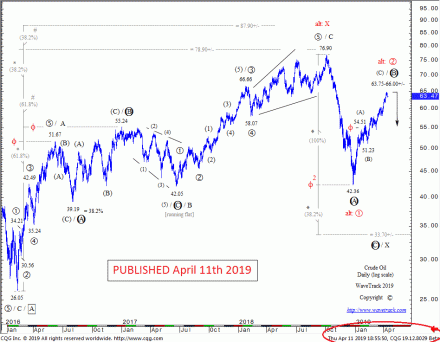
Crude Oil Exhibit 6 – April 11th 2019
Crude Oil ran higher, exactly as predicted, unfolding into a three price-swing zig zag pattern, (A)-(B)-(C) with price targets being reached at 64.79 (April 8th). Analysis now predicts a sharp downswing over the next several months, towards $33.70+/-.
Conclusion
The overall form and price-forecasts presented in these six charts over a 3-year period developed almost perfectly according to the Universal Laws governing the Elliott Wave Principle. Even a casual eye will notice the predictability in price development and its accuracy can only result in one conclusion – an inherent, mysterious law is governing the price development of all financial/commodity/currency markets – if those laws are known, understood, then accurate price prediction is certainly possible
Peter Goodburn is the senior Elliott Wave analyst at WaveTrack International and is the author of the monthly institutional Elliott Wave-Navigator report and the bi-weekly individual investor Elliott Wave-Compass report. For information to subscribe to the annual 2019 VIDEO REPORTS – please click these links: alternatively, details at www.wavetrack.com
PART I – Stock Index Video January 2019
PART II – Commodities Video February 2019
PART I – Currencies and Interest Rates 2019 Video
Comments
3 Responses to “Elliott Wave – Crude Oil – Are Price Trends Predictable?”
Leave a Reply

April 15th, 2019 @ 4:31 pm
It looks like crude put in a 10 year cycle low in December so I wouldn’t expect it to break that low any time soon. Crude should trade back over $ 100 in the next few years before this cycle up move is completed. I can’t argue with your successful forecasting so far but will see if cycles or waves prevail.
April 15th, 2019 @ 5:03 pm
Thanks for the 10yr cycle and your comment. We use a 88+/- month (7.3yr) cycle which picks up the lows in late’78, mid’86, early ’94, late ’01, late ’08 and early ’16 – our long-term outlook is for $183+/- but if last year’s decline from October is 5-waves into December, then it must break this low before trending higher again. Very best wishes.
April 16th, 2019 @ 9:23 am
This time the Wavetrack guy is right.
Why is the 10 year cycle important?
My opinion – crude oil do not have a cycle repeating with regularity so for example Hurst cycles do not work good, but look at Benner cycles repeating sequence 11-10-7 years consisting of 2 or 3 x three and a half years cycle.
That is why you see 10 years cycle(10 and 11 years above) and Wavetrack 7.3 years (2×3.5) the sub-cycle.
Important highs – 1980-(10)-1990-(7)-1997-(11)-2008-(10)-2018-(7)-2025-(11)-2036
2018 like a clock and the next one 2025 around the major USD 16 year cycle low(inflation pop:)
Important lows – 1986-(11)-1998-(10)-2009-(7)-2016-(11)-2027-(10)-2037
P.S I do not have long term charts just used the years at this one – https://4.bp.blogspot.com/-8bexklGplrU/V71ZgZqjuUI/AAAAAAAAWeA/dXAa6raNkNcM7ojfDE_Bmtc74KqzxC3-wCEw/s1600/crude.png