FOREX and BONDS Video PART III/III
by WaveTrack International| August 11, 2020 | No Comments

FOREX and BONDS – Currencies and Interest Rates Video WaveTrack
FOREX and BONDS Mid-Year Video Update PART III/III
US$ Dollar Completed 2nd Wave Peak Last March during COVID-19 Panic. 7.8-Year Cycle Downtrend has Resumed. Shorter-Term Rally in Dollar Over Next Few Months. Commodity Currencies Signalling Major Reversal Last March & Now Heading Higher. Asian Currencies Formed Major Lows. U.S. Long-Dated Interest Rates ended Deflationary Cycle Last March. Rising Trends Although Curve Control Expected. European Interest Rates Trending Higher From COVID-19 Lows
INCLUDES ANALYSIS ON MAJOR US$ DOLLAR PAIRS/CROSSES – ASIAN/EM CURRENCIES – MEDIUM-TERM CYCLES – LONG-DATED YIELDS US/EUROPE/JAPAN + SPREADS
We’re pleased to announce the publication of WaveTrack’s annual 2020 trilogy video series of medium-term ELLIOTT WAVE price-forecasts. Today’s release is PART III, FOREX & BONDS – Parts I & II were released during the last month – please contact us for information.
• PART I – STOCK INDICES – OUT NOW!
• PART II – COMMODITIES – OUT NOW!
• PART III – FOREX & BONDS – OUT NOW!
Forex Review – H1 2020
If you remember our January/February’s annual PART III EW-Forecast Report/Video began by forecasting the US$ dollar index approaching a major corrective high. Trading up from 98.69 finalising at 100.54+-/-, max. 102.79+/-. This was the finalising sequence of a 2-year counter-trend a-b-c zig zag rally that originated from the Feb.’18 low of 88.26. It was expected to be a landmark event. Mainly, because it had consumed an unusually long period of time within the more dominant 7.8-year downtrending cycle that began dollar descent from the higher Jan.’17 peak of 103.82.
The coronavirus pandemic was at its peak in China. However, it hadn’t yet crossed over into the consciousness of the West. But as the weeks passed, the COVID-19 pandemic spread across continental Europe and later the U.S. with devastating effect with global stock markets collapsing and their economies with it. The US$ dollar index staged a sharp decline into an early-March low of 94.65. Initially, this triggered thoughts that upside targets have been slightly short, with the dominant downtrend already in progress. Nevertheless, this was a prelude to a sudden and sharp dollar advance to 102.99 as investors sought safe-havens amidst short-term dollar funding shortages.
Ironically, the March high at 102.99 was only 20 pips above January/February’s original upside targets. But this test came and went in the most unexpected way.
The dollar’s subsequent decline from the March high has since triggered the beginning of a new multi-year downtrend. This is evident across most dollar currency pairs. With many Commodity Currencies bottoming in March, the stage is set for some impressive renaissance gains over the next several years.
Forex and Bonds – Key Drivers & Sentiment for H2 2020
The key drivers for the remainder of this year are much the same, the influence from Chinese technology firms and its growing geopolitical influence, Eurozone debt, growing populism, trade wars, a second-wave of COVID-19 and the failure of global fiscal stimulus. But there’s also a risk in the West of a push-back against mandatory vaccination, tracking/travel restrictions and all coming ahead of November’s U.S. Presidential elections. Despite lowered expectations of rising inflationary pressures since COVID-19, there’s a growing concern of a repeat of the 1970’s ‘Inflation-Pop’.
Any one of these events could send investors rushing to buy safe-haven dollars. However, from an Elliott Wave perspective, the medium and longer-term trends remain firmly downward, looking ahead over the next several years.
Global Fund Manger Surveys
In its latest Global Fund Manager Survey, analysts at Bank of America/Merrill-Lynch have reported from its survey of investors that 44% per cent expect a U-shaped recovery following the economic fallout from COVID-19 – 30% per cent expect it to be a W-shaped recovery whilst only 14% per cent expect a V-shaped recovery – see fig #1. Obviously, 12% per cent didn’t respond, but there are clearly differences in the way economies are heading over the rest of this year.
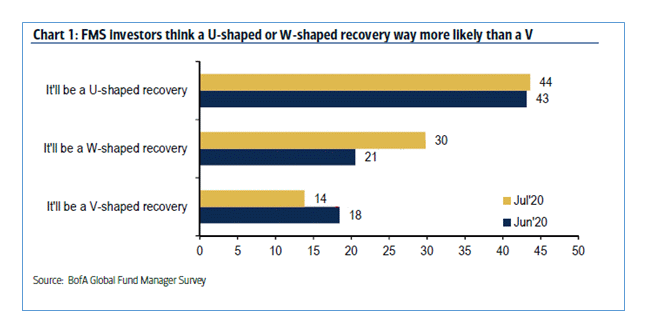
Fig #1 – FMS Investors think a U-shaped or W-shaped recovery way more likely than a V
In the same survey, when asked how the economy is expected to develop over the next twelve months, the response showed 72% expected stronger growth. This is the highest level since January 2014. Whilst 36% expected economies to get a lot stronger which was the highest figure recorded in the data that began in Oct.’94 – see fig #2.
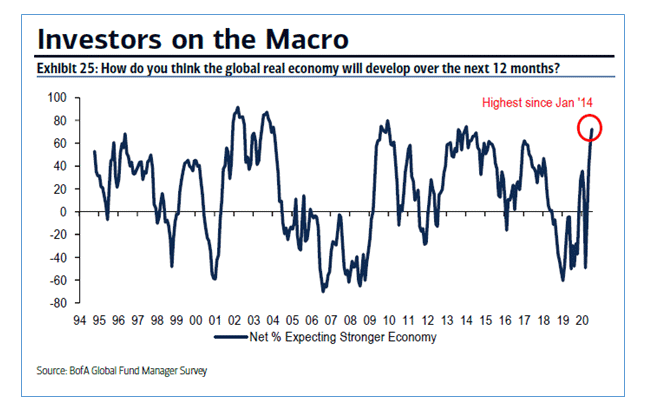
Fig #2 – Investors on the Macro
Our Elliott Wave interpretation of this suggests the post-COVID-19 economic recovery is now reaching an interim peak. And will likely take a rest period, undergoing a counter-trend correction during the coming months. That translates into a correction in the stock market. Mainly, an upside correction for the dollar, and a period of risk-off/safe-haven strategies.
Forex EW-Forecasts H2 2020
Whilst the US$ dollar remains on a downward trajectory over the medium-term, that is, over the next several years, the outlook is becoming more bullish over the shorter-term, spanning the next few months.
A five wave impulse downswing is visible in the US$ dollar index’s decline from that March spike-high of 102.99 which heightens the probability of a counter-trend upswing unfolding thorough August to October/November.
Morgan Stanley’s US Dollar Position
In a recent research note, investment bank Morgan Stanley said it had now shifted from its dollar-bearish stance and turned ‘tactically neutral’ on the U.S. currency, citing the dollar is at its most oversold level in over 40-years. The bank has exited its short position on the dollar index whilst also closing long positions on the euro and Australian dollar.
WaveTrack’s Elliott Wave US Dollar Forecast
That certainly seems to concur with our Elliott Wave count! The latest aggregated US$ dollar positioning basis COT data also supports the idea that the dollar has entered an oversold condition – see fig #3. Whilst this doesn’t necessarily ensure a dollar rally is ahead because an oversold reading can remain that way in a strong downtrend, it does hint of one especially if supported by an Elliott Wave count. The COT data shows the dollar’s net speculative positioning has been declining since May ’19 and is now negative at minus -$19.1bn dollars. That’s approaching levels not seen since May ’18, shortly after the dollar ended is intermediate wave (1) downtrend at 88.26 that began from the Jan.’17 peak of 103.82.
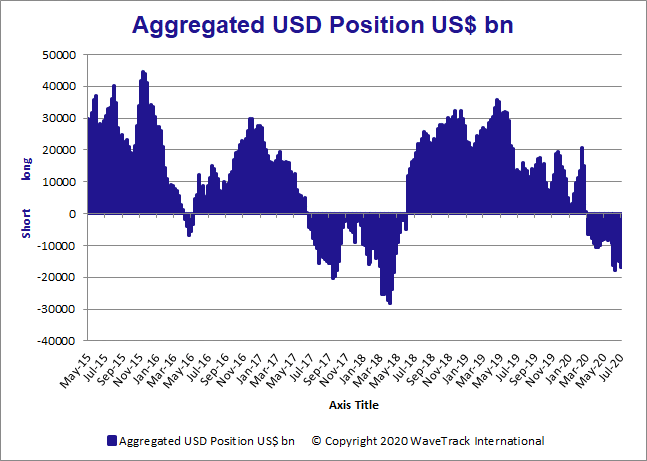
Fig #3 – Aggregated USD Position USD
In this next graphic, we see the same oversold signal basis a ‘relative strength index’, or RSI – see fig #4. The current reading at the beginning of August is 26.2998 registering one of the most oversold levels of the past decade.
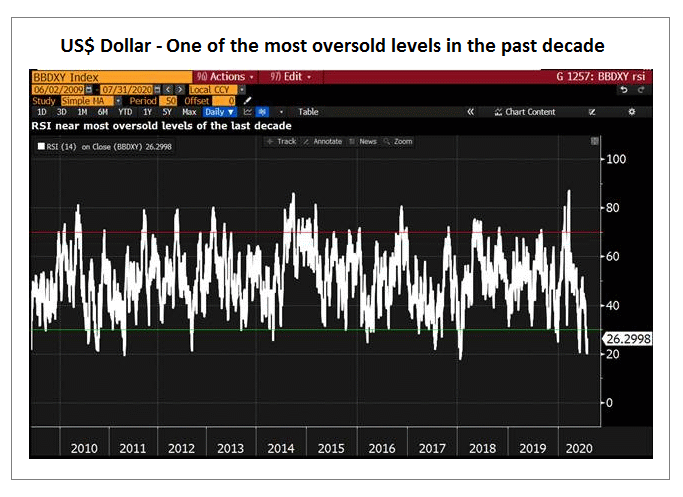
USD – One of the most oversold levels in the past decade
EUR Component
Of course, the US$ dollar index weighting of its basket of currencies shows the EURO currency as the largest component at 57.6%. So it’s not surprising the EURO is correspondingly at an overbought condition right now. The latest COT net speculative positioning is at plus +180,600 contracts, historically very high, even higher than the previous peak of April ’18 when it was at 151,500 contracts and trading at 1.2556 (now at 1.1785) – see fig #5. The equivalent dollar positioning value is at plus +16.016bn dollars, extremely high and from an Elliott Wave count, is approaching the completion of a corresponding five wave impulse uptrend that began last March from 1.0635.
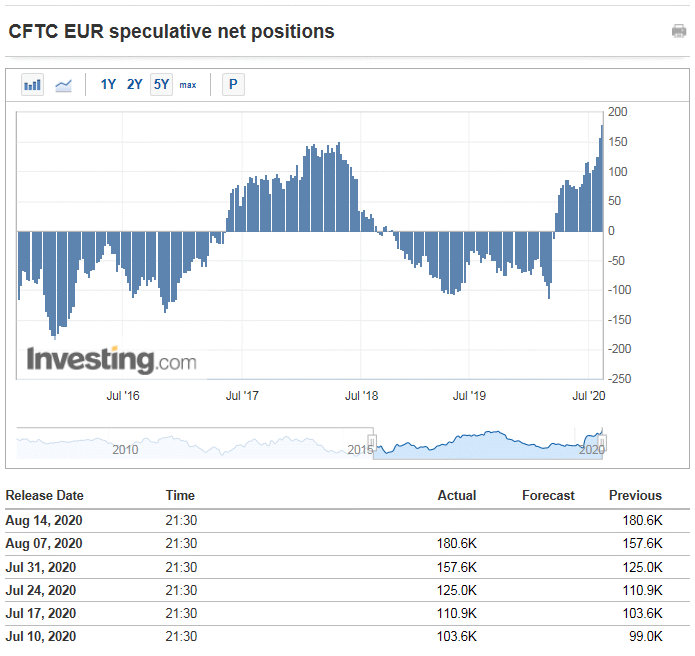
Fig #5 – CFTC EUR speculative net positions
G8 Currencies
When taking a comparative look across all of the G8 currencies, the medium-term and shorter-term outlooks suggest a similar story. Certainly, where the US$ dollar is firmly engaged in a downtrend for the next several years but positioning for a shorter-term counter-trend rally.
Sterling vs. US Dollar
This is definitely the case for Stlg/US$, although we expect some level of short-term outperformance. US$/Yen is set to trend higher over the coming year or two although this contradicts the idea of a weaker dollar. This is more to do with its positive-correlation with the Nikkei 225’s stock index uptrend, and its correlation to the US10yr yield, both of which reflect risk-on strategies over the period, thus weakening the Yen more than the dollar.
US Dollar vs. CHF/NOK/CAD
The US$/CHF Swiss Franc is poised to benefit by a weaker US$ dollar downtrend with Elliott Wave projections below the Aug.’11 low of 0.7064. The US$/NOK is forecast to trend significantly lower over the next several years reflecting Norwegian Krona strength as a commodity-based currency, linked to a major ‘Inflation-Pop’ recovery in Crude/Brent oil prices. Another commodity currency is the Australian dollar – the AUD/US$ is also tipped to strengthen dramatically, trending higher through the final stages of the ‘Inflation-Pop’ cycle, ultimately breaking above its previous year-2011 high of 1.1083. This is also true for another petro currency, the Canadian dollar where the US$/CAD ended its pre-financial-crisis counter-trend advance only recently, into the March ’20 COVID-19 high of 1.4669 and now in the early stages of a multi-year downtrend.
Currency Crosses – Euro/GBP/AUD/NOK/CAD
The latest Elliott Wave analysis of currency crosses has extended our portfolio to include AUD/NOK, CAD/NOK and AUD/CAD – these suggest AUD strength over NOK and CAD through the final stage of the ‘Inflation-Pop’ cycle – the CAD/NOK cross is trending lower. See report for full details.
Asian & Global Currency Pairs
Something very special occurred last March when many Asian currencies continued to weaken against the US$ dollar. The Asian Dollar Index (ADXY) sold-off sharply during the COVID-19 panic but trading down into long-awaited targets of 99.80+/- to only a fraction above, at 100.30. This low coincided with a major high in the dollar index (DXY) at 102.99 but confirming the ADXY ending a 12-year corrective expanding flat pattern from the Feb.’08 high of 116.40.
See Forex report for full details.
US$/BRL/RUB/ZAR/MXN/ARS/TRY/PLZ
See Forex and Bonds report for full details.
Bitcoin
A recent survey from a U.S. investment bank noted that baby-boomers were inclined to buy gold as a safe-haven investment but millennials prefer to invest in Bitcoin.
As for Bitcoin, our Elliott Wave analysis continues the same theme outlined earlier this year – the multi-year outlook remains very bullish, with the prospect of outperforming gold by a huge margin over the next decade.
Interest Rates – Review
Last January/February’s Elliott Wave analysis forecasted long-dated treasury yields declining to new record lows during the 1st quarter 2020 period. But little did we know just how far those yields would decline!
U.S. Treasury Yields Cycles and Elliott Wave Forecasts
The triple AAA rated corporate bond yield has a 60-year cycle dating back to the early 1700’s – see fig #6. Its last peak was the ‘inflationary’ high traded back in year-1981 at 15.84%. The subsequent ‘deflationary’ era has so far, extended beyond the half-60yr cycle of 30 years which was due to end in mid-2016 to this year, 2020. This is most probably a result of central bank intervention. Specifically, its quantitative easing and accommodative monetary policies. However, the further the yield passes beyond this date, the more risk of a springboard effect higher later.
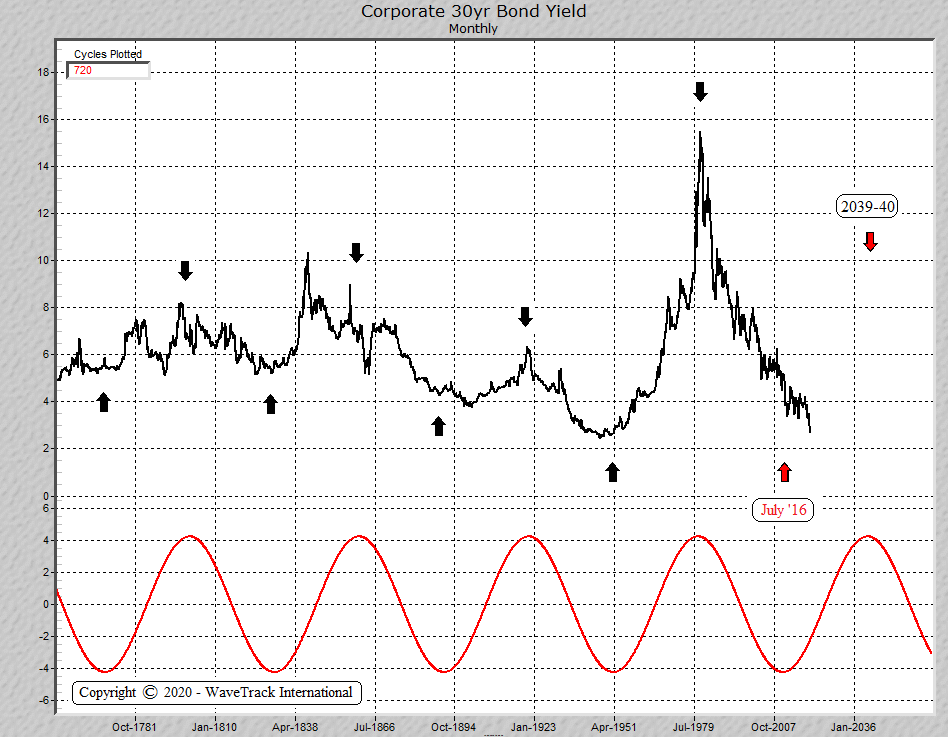
Fig #6 – Corporate 30yr Bond Yield – Monthly – Composite Cycle
US10yr yield
The US10yr yield hit a low last March at 0.377% before responding immediately higher to begin a new longer-term uptrend. Like the thirty-year yield, once primary wave 3 begins, its pace and trajectory could be slow, at least in its early stages of development.
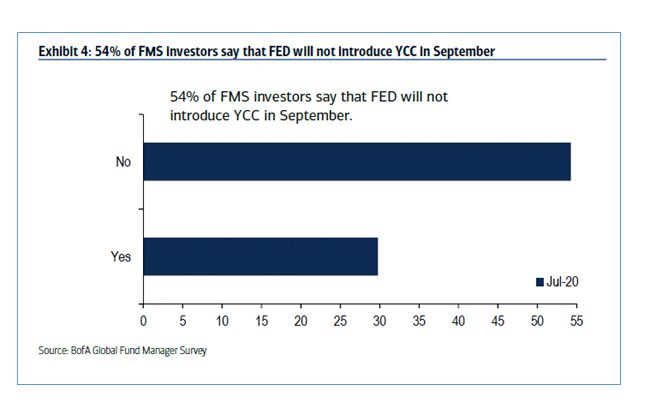
Fig #7 – 54% of FMS Investors say that FED will not Introduce YCC in September
The Bank of America/Merrill-Lynch’s recent Global Fund Manager Survey reported that 54% of investors said the Fed would not introduce Yield Curve Control at its next meeting in September. About 30% did say they expected it. However, in this case, we’re interested in what the majority think and expect – see fig #7.
Basis our weekly composite cycle of the US10yr yield, the yield forms an important low in August/September. It should then turn higher. Consequently, this would start a primary wave 3’s advance. Yet, it may not necessarily accelerate higher, at least in the beginning, basis the cycle – see fig #8. Note how the cycle turns higher. However, not to any significant trajectory. Rather, it trends higher gradually until October ’21. Could that suggest the Federal Reserve will implement yield curve control soon?

Fig #8 – US10 Year Yield – Weekly – Composite Cycle
Dollar Spreads
See Forex report for full details.
Dollar/Euro Spread
See Forex report for full details.
Inflation TIPS
The US10yr Breakeven Inflation Rate hit a low last March at 0.727, extending primary wave B’s corrective downswing that began from year-2011’s high of 2.654. But importantly, the spread remained above the financial-crisis low of 0.077 which defined the beginning of the ‘Inflation-Pop’ cycle. The TIPS has since traded up to 1.571% which is perfectly in-line with upside progress as primary wave C. Inflationary pressures are on the rise!
European Yields
The benchmark DE10yr yield edged slightly below the Aug.’19 low of -0.743% during the COVID-19 panic last March. Touching a new historical low at -0.910%. It immediately traded higher later in the month to -0.146 confirming its multi-decennial corrective downswing from the year-1981 inflation-pop high of 11.500% had completed whilst opening the way for a new era of rising interest rates to begin. Over the next few years, we expect the yield to trend higher. Possibly, attempting targets towards 2.085+/- as primary wave 1.
Spreads
See Forex and Bond report for full details.
Italy
See Forex and Bond report for full details.
Japan
See Forex and Bond report for full details.
New Forex & Interest Rates mid-year 2020 Video – PART III/III
We’ve amassed over 100 charts (a new record!!) from our EW-Forecast database in this mid-year Forex and Interest Rates 2020 video. Each one provides a telling story into the way Elliott Wave price trends are developing in this next INFLATION-POP’ phase of cycle development. We’re taking a look at some very specific patterns that span the entire 15.6-year US$ dollar cycle. And explaining their current location and why inflation will trigger huge US$ dollar declines. Yet, simultaneously appreciating major Emerging Market and Asian Currencies.
We’re updating some amazing Elliott Wave forecasts for U.S. interest rates, US10yr, US10yr, US05yr, and even US02yr together with a schematic look at several spread relationships with European rates not forgetting upside targets for the US10yr Inflation Tips. It’s a must-see!
We invite you to take this next step in our financial journey with us – video subscription details are below – just follow the links and we’ll see you soon!
Most sincerely,
Peter Goodburn
Founder and Chief Elliott Wave Analyst
WaveTrack International
What you get
Contents: 100 charts | Video duration: 2 hours 15 mins.
The contents of this FOREX & BONDS VIDEO include Elliott Wave analysis for:
• US$ Index + Cycles
• Euro/US$ + Cycles
• Stlg/US$
• US$/Yen
• US$/CHF
• US$/NOK
• AUD/US$
• NZD/US$
• US$/CAD
• Euro/Stlg
• Euro/CHF
• Euro/NOK
• Euro/Yen
• Euro/AUD
• Stlg/YEN
• Stlg/CHF
• Stlg/NOK
• Stlg/ZAR
• Stlg/AUD
• AUD/NOK
• CAD/NOK
• AUD/CAD
• Asian ADXY
• US$/Renminbi
• US$/KRW
• US$/SGD
• US$/INR
• US$/TWD
• USD/THB
• US$/MYR
• US$/IDR
• US$/PHP
• USD/BRL
• USD/RUB
• US$/ZAR
• US$/MXN
• US$/ARS
• US$/TRY
• US$/PLZ
• Bitcoin
Interest Rates (30 charts):
• US30yr Yield + Cycles
• US10yr Yield + Cycles
• US5yr Yield
• US2yr Yield
• US2yr-10yr Yield Spread
• US10yr-30yr Yield Spread
• 3mth EuroDollar-US10yr Yield Spread
• Comparison US10-DE10yr vs S&P 500
• US10yr TIPS Break Even Inflation Rate
• US10-DE10yr Yield Spread
• DE10yr Yield
• ITY10yr Yield
• JPY10yr Yield
BUY NOW on WaveTrack’s VIMEO Video On Demand Page
Click here to buy the CURRENCIES and INTEREST RATES Mid-Year Video Update 2020
*(additional VAT may be added depending on your country – currently US, Canada, Asia have no added VAT but most European countries do)
We’re sure you’ll reap the benefits – don’t forget to contact us with any Elliott Wave questions – Peter is always keen to hear you views, queries and comments.
Visit us @ www.wavetrack.com
Commodities 2020 Mid-Year Video Series
by WaveTrack International| July 15, 2020 | No Comments

Commodities Hit Major Lows –‘Inflation-Pop’ Lift-Off – Next 2-3 Year Uptrends Underway
We’re pleased to announce today’s release is PART II, COMMODITIES – Part I was released last month and Part III will be published in late-July
• PART I – STOCK INDICES – out now!
• PART II – COMMODITIES – out now!
• PART III – CURRENCIES & INTEREST RATES – coming soon!
Elliott Wave Forecasts – Mid-Year 2020 – Summary
EW-Forecast Review – H1 2020
The Annual 2020 report published last January (2020) highlighted first-quarter Q1 ’20 downside risk across the commodities sector – ‘…This specifically applies to base metals like Copper, Aluminium and Lead’…’Commodities like Crude/Brent oil are still some way from ending corrective X wave declines that began from the Oct.’18 highs. So far, downside targets are still -32% per cent below current levels…’. It continued…’ The probability of a Q1 dip in prices is evident across other asset classes – the US10yr treasury yield downtrend that began from the Oct.’18 peak of 3.262% remains incomplete, requiring another but final decline to lower-lows, below last September’s low of 1.429%. Also, U.S. stock markets are set to end last October’s uptrend – those gains of +16% per cent must be corrected to the downside…Various Base Metal Mining stocks are set to trade lower over the next few months too. The US$ dollar could flip higher for a few months, indicating the same risk-off event…’.
Commodities and Coronavirus Aftermath
These forecasts were realised as the coronavirus pandemic spread from China, across continental Europe and later to the United States. There was no contemplation at the time that the COVID-19 pandemic would be the catalyst for the expected declines across commodity markets. However, Elliott Wave patterns were already warning of a significant sell-off.
Fig #1 – Track Record – CRB Cash Index – 2nd January 2020 by WaveTrack International
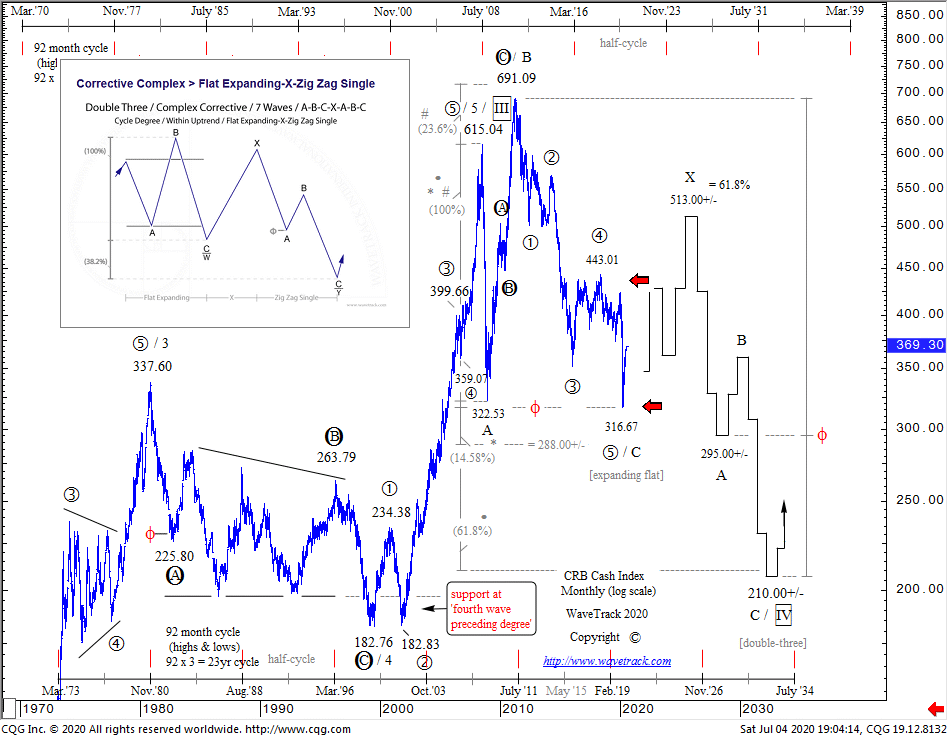
Fig #2 – Result! – CRB Cash Index – 2nd January 2020 by WaveTrack International
Price declines were even more severe that these bearish forecasts. Copper declined by -30% per cent. Crude/Brent oil collapsed by an unprecedented -90% per cent whilst industrial precious metal fell by -40% per cent. Even gold wobbled! And traded down -15% per cent into March’s low. Stock markets declined by -35% per cent whilst the US10yr yield traded down to historical lows of 0.378% per cent.

Fig #3 – Track Record – MSCI EM and Copper Correlation Study – 4th January 2020 by WaveTrack International
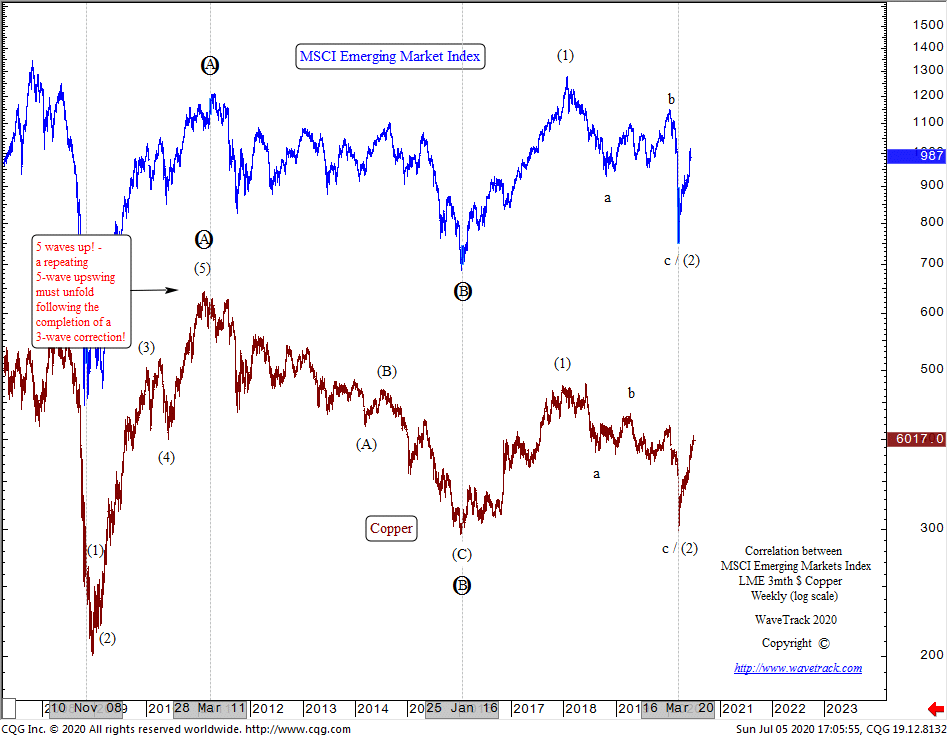
Fig #4 – Result! – MSCI EM and Copper Correlation Study by WaveTrack International
Commodities and V-Shaped Recovery
Commodities have certainly undergone a V-shaped recovery since forming important lows last March. Despite warnings of a second-wave of coronavirus infections spreading across the U.S. and South America, this is unlikely to lead to prices trending below last March’s lows. Base metals ended major corrective lows as did industrial precious metals together with Crude/Brent oil.
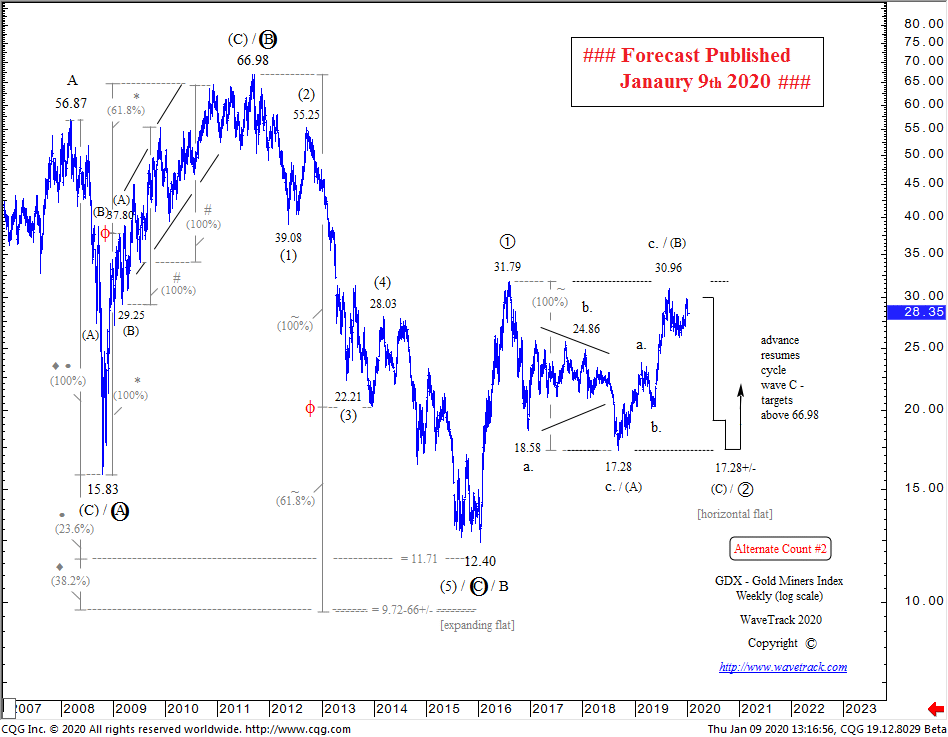
Fig #5 – Track Record – GDX – Gold Miners Index – 9th January 2020 by WaveTrack International

Fig #6 – Track Record – Crude Oil – Count #2 – 9th January 2020 by WaveTrack International
Aftermath of Coronavirus Sell-Off
V-shaped recoveries have begun from March’s lows and these are sustainable uptrends that are forecast unfolding over the next 2-3 years. But commodity trends don’t head higher in straight lines but are instead punctuated by intervals of corrective declines. Price advances are reaching interim upside targets right now.
New Commodities Mid-Year 2020 Video – PART II/III
We’ve amassed over 75 commodity charts from our EW-Forecast database in this mid-year 2020 video. Each one provides a telling story into the way Elliott Wave price trends are developing in this next INFLATION-POP’ phase of cycle development. We’re taking a look at some very specific patterns that span the entire SUPER-CYCLE, explaining why the super-cycle began from the GREAT DEPRESSION lows of 1932 and not from the lows of 1999 and how this ended in 2006-2008 and why the multi-decennial corrective downswing that began soon afterwards has taken the form of a very specific, but identifiable Elliott Wave pattern into the COVID-19 lows.
We invite you to take this next step in our financial journey with us. Video subscription details are below. Just follow the links and we’ll see you soon!
Most sincerely,
Peter Goodburn
Founder and Chief Elliott Wave Analyst
WaveTrack International
Commodities Video Part II
Contents: 78 charts
Time: 2 hours 10 mins.
• CRB-Cash index
• US Dollar index + Cycles
• Copper + Cycles
• Aluminium
• Lead
• Zinc
• Nickel
• Tin
• XME Metals & Mining Index
• BHP-Billiton
• Freeport McMoran
• Antofagasta
• Anglo American
• Kazakhmys Copper
• Glencore
• Rio Tinto
• Teck Resources
• Vale
• Gold + Cycles
• GDX Gold Miners Index
• Newmont Mining
• Amer Barrick Gold
• Agnico Eagle Mines
• AngloGold Ashanti
• Silver + Cycles
• XAU Gold/Silver Index
• Platinum
• Palladium
• Crude Oil + Cycles
• Brent Oil
• XOP Oil and Gas Index
BUY NOW on WaveTrack’s VIMEO Video On Demand Page
Click here to buy the COMMODITIES Mid-Year Video Update 2020
*(additional VAT may be added depending on your country – currently US, Canada, Asia have no added VAT but most European countries do)
We’re sure you’ll reap the benefits – don’t forget to contact us with any Elliott Wave questions – Peter is always keen to hear you views, queries and comments.
Visit us @ www.wavetrack.com
We’re sure you’ll reap the benefits. Don’t forget to contact us with any Elliott Wave questions. Our EW-team is always keen to hear your views, queries, and comments.
Visit us @ www.wavetrack.com
Stock Index Mid-Year Video Series – 2020 | PART I/III
by WaveTrack International| June 24, 2020 | No Comments

COVID-19 Aftermath II – Secular-Bull Market Uptrend Resumes!
This report combines ELLIOTT WAVE with updated SENTIMENT & ECONOMIC INDICATOR STUDIES
We’re pleased to announce the publication of WaveTrack’s mid-year 2020 video updates of medium-term ELLIOTT WAVE price-forecasts. Today’s release is PART I, STOCK INDICES – Parts II & III will be published during the next month.
• PART I – STOCK INDEX
• PART II – COMMODITIES
• PART III – CURRENCIES & INTEREST RATES
EW-Forecast Review – H1 2020
The Annual 2020 report published last December (2019) highlighted several main points, including –
Well, a lot’s happened since then! The coronavirus pandemic has decimated global economies with a collapse in almost all areas of manufacturing and services. Only online sales survived the downturn. But even Amazon’s shares traded sharply lower during the worst of the stock market rout in February/March with declines of -25% per cent compared to the benchmark SP500’s decline of -36% per cent.
International Monetary Fund (IMF)
The International Monetary Fund (IMF) has recently made a statement saying the current COVID-19 crisis is ‘unlike anything the world has seen before’. The organisation forecast in April a contraction of -3% for the global economy in 2020. However, the IMF has since said it could be even worse. It noted that the services industry had been more severely impacted than manufacturing. This represents a change from previous crises, where a lack of investment hit manufacturing activity hardest.
The IMF added ‘For the first time since the Great Depression, both advanced and emerging market economies will be in recession in 2020. The forthcoming June World Economic Outlook Update is likely to show negative growth rates even worse than previously estimated’.
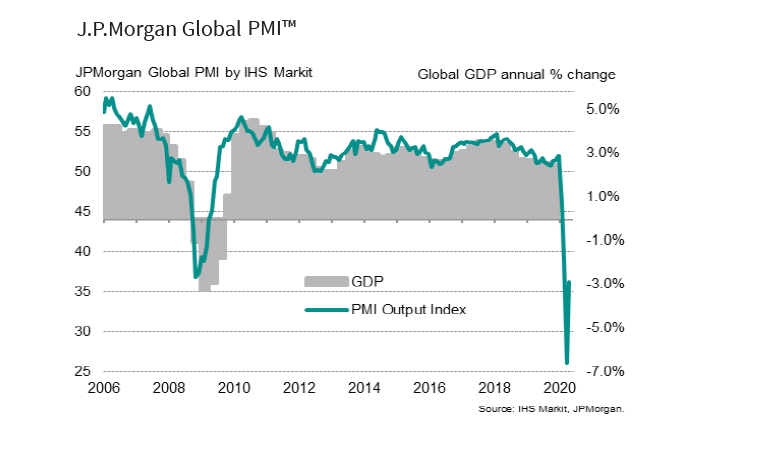
fig #1 – Global PMI – Source: JP Morgan
This downbeat assessment has been echoed in the data. The IHS Markit/JP Morgan Global PMI Output Index shows a massive slide lower during the height of the coronavirus pandemic. As a result, the index kept falling from 52.0 down to 26.0 before staging a V-shaped rally from the March/April low – see fig #1. The less sensitive quarterly GDP figures haven’t yet reflected that extreme downturn, but they will do once compiled, but lagging behind.
Enter the Central Banks
In response to the effects of COVID-19 and the lockdowns, central banks and governments have begun an estimated $15 trillion dollars of stimulus in order to protect their economies from systemic collapse. These are record sums that will explode balance sheets and deficits to peacetime highs and to levels that equate to about 17% per cent of an $87 trillion dollar global economy. It’s a massive undertaking.
Stimulus so far – $15 trillion and counting
In a Reuters report from Ritvik Carvalho, it states that central banks have so far unveiled as much as $15 trillion dollars of funding into the financial system in an attempt to reverse the economic slump – see fig #2. It’s caused an exponential rise in the balance sheets. And in reaching that number, Reuters has included the increase in central bank balance sheets since the crisis erupted, new government cash injections and spending pledges, as well as about $7 trillion worth of quasi-fiscal loans and credit guarantees. Much of the latter may never be drawn upon, which would reduce the size of the fiscal stimulus. Central banks will also buy more bonds. Some are even saying there is no cap on purchases, inflating the $15 trillion number between now and end-2020.
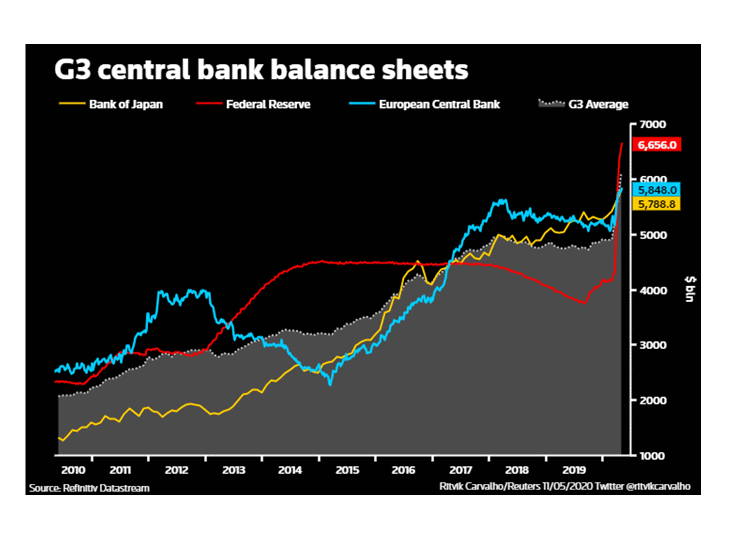
fig #2 – G3 Central Bank Balance Sheets Sources: Ritvik Carvalho Reuters
Earlier this month (June), the European Central Bank (ECB) announced that it will increase its Pandemic Emergency Purchase Programme (PEPP) by €600 billion euros as it attempts to bolster the region’s economy following the coronavirus crisis. The amount is in addition to the existing €750 billion euros of government bond purchases that the ECB announced in March, taking to total to €1.35 trillion euros.
Meanwhile, the Federal Reserve announced its expanding its current stimulus programme to include the purchasing of corporate bonds as a function of its Secondary Market Corporate Credit Facility (SMCCF). The Fed’s stimulus has already exceeded $2.3 trillion dollars and together with various fiscal stimulus by the U.S. government, is expected to be as high as $5.0 trillion dollars.
Coronavirus – 2nd Wave?
Just as lockdowns have been relaxed and economies begin to reopen, so warnings have emerged over a 2nd wave of COVID-19 infections.
‘The second wave has begun’ said William Schaffner of the Vanderbilt University School of Medicine following reports of a spike in infection rates in Arizona, Florida and California. White House health advisor Dr. Anthony Fauci said in a recent announcement that a second wave of the coronavirus outbreak in the United States ‘could happen’ but is ‘not inevitable’.
Mike Ryan, executive director of the World Health Organisation’s (WHO’s) Health Emergencies Programme, said ‘calling instances like these a second wave isn’t quite accurate – most of the world right now is still very much in the first wave of this pandemic’ – it’s not surprising at all that any country coming out of this so-called lockdown can have clusters of disease, reemergence of disease’.
Investors are confused and you can understand why!
Sentiment
In the late-May Global Fund Manager survey conducted by Bank of America/Merrill Lynch, it reported that just 10% of fund managers expected a V-shaped recovery, only 25% a new bull market. In contrast 75% expect a U or W-shaped recovery with 68% believing a bear market rally began from the March lows – see fig #3.

fig #3 – FMS Investors Are Still More Bearish Than Bullish – Source: BofA Global Fund Manager Survey
Around the same time, Reuters conducted a similar sentiment poll of more than 250 economists highlighting recessions in most major economies would be deeper this year than previously predicted. Almost three-quarters of economists said the recovery would be either U-shaped, with a prolonged trough, or like a tick mark where the speed of the recovery is not as quick as the drop-off. Only 15 respondents predicted a strong, V-shaped recovery. The others said it would be W-shaped, where a vigorous rebound results in another sharp slump, or L-shaped where the economy flat-lines after the downturn – see fig #4.
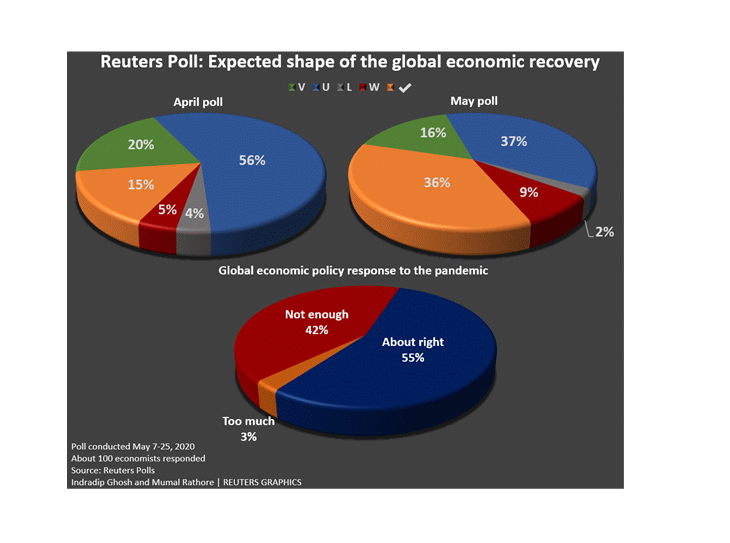
fig #4 – Reuters Poll: Expected shape of the global economic recovery – Source: Reuters Polls
From this we can discern that fund managers and economists have been very cautious since the COVID-19 pandemic hit financial markets during February/March’s sell-off – and they haven’t changed their opinions into late-May despite stock markets gaining back most of those -36% per cent losses since March’s lows.
What Next? Elliott Wave Perspective
COVID-19 Aftermath II – Secular-Bull Market Uptrend Resumes!
Despite all the conflicting news stories, COVID-19 vs. Central Banks, the outlook for global stock markets are clearly bullish, at least from an Elliott Wave perspective.
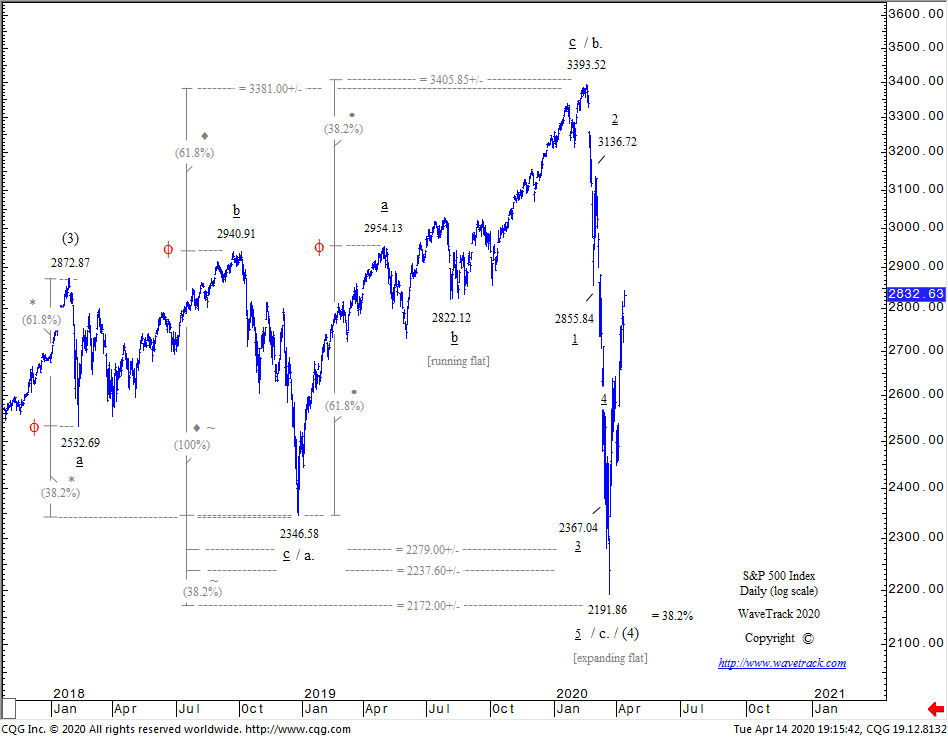
The benchmark SP500 completed a 4th wave correction into March’s low of 2191.86 with a new 5th wave uptrend getting underway since – this explains the V-shaped recovery into the mid-June high – see fig #5. The 4th wave, intermediate wave (4) completed a clearly-defined expanding flat pattern, labelled a-b-c subdividing 3-3-5 from the Jan.’18 high of 2872.87 – all criteria in correctly identifying this pattern were fulfilled, including its overall ‘form’ where wave minor wave a. establishes its initial trading-range ending in Dec.’18 at 2346.58 which is later exceeded slightly as waves b. and c., the former at 3393.52 and the latter into March’s low of 2191.86.

fig #5 – SP500 – Track Record – dated 25th March 2020 – WaveTrack International Financial Forecasting
Importance of Keeping it all in the Right Ratio and Proportion
Another criteria is ratio and proportion. Ratio is fulfilled where the initial downswing within minor wave a. at 2532.69 is extended by a fib. 61.8% ratio in projecting its low at 2346.58. Also, extending the initial upswing of wave b. to 2954.13 by a fib. 61.8% ratio projects the exact high at 3393.52. The final criteria is overall proportionality where minor wave a. is extended by a fib. 38.2% ratio in projecting the terminal low for minor wave c. to 2172.00+/-, the actual low being just 20 points higher at 2191.86.
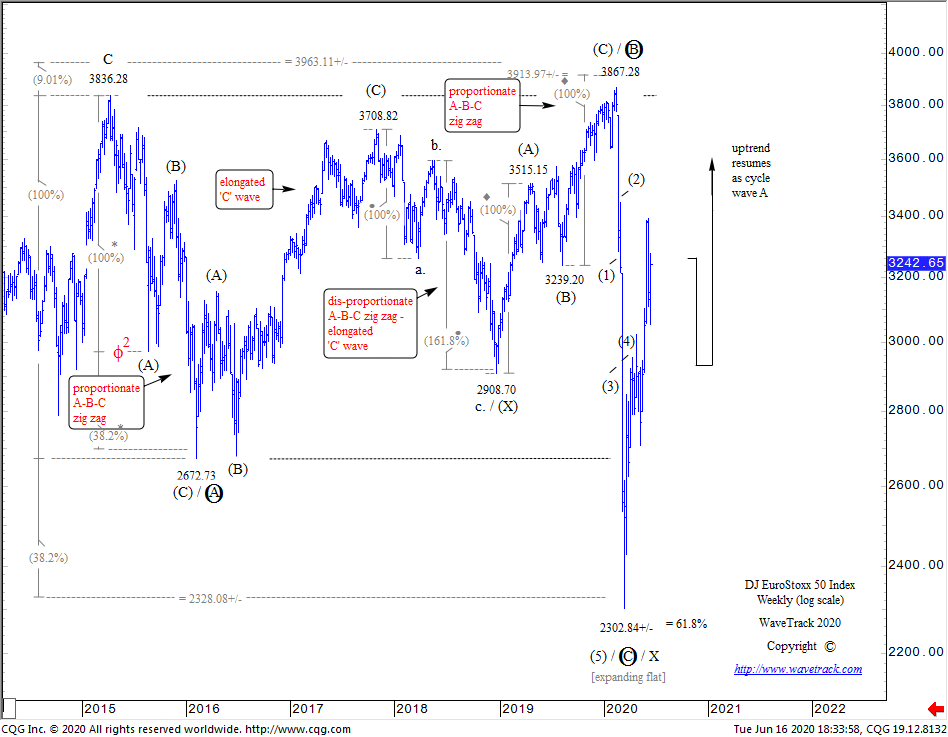
fig #6 – EuroStoxx 50 – Weekly – by WaveTrack International
The completion of the SP500’s expanding flat pattern is not a one-off coincidence. This same pattern is replicated in many other indices. Larger expanding flat patterns also completed last March for European indices too, the Eurostoxx 50 and the Xetra Dax. The Eurostoxx 50’s expanding flat is clearly defined because its second sequence, primary wave B has definitively unfolded into a double zig zag pattern, (A)-(B)-(C)-(X)-(A)-(B)-(C) from the Feb.’16 low of 2672.73 nudging to a momentary higher-high last February ending at 3867.28 – see fig #6. The coronavirus sell-off completed primary wave C into the exact fib. 38.2% extension level of primary wave A’s low of 2672.73 at 2302.84, just 26 points from the idealised measurement!
Emerging Markets + Asia – Australia – Japan
Emerging markets tell the same bullish story. They’re all signalling major coronavirus lows last March. The next two charts echo the same bullish outlook across Asian and the rest of the world’s indices – see fig’s #7 + fig #8.
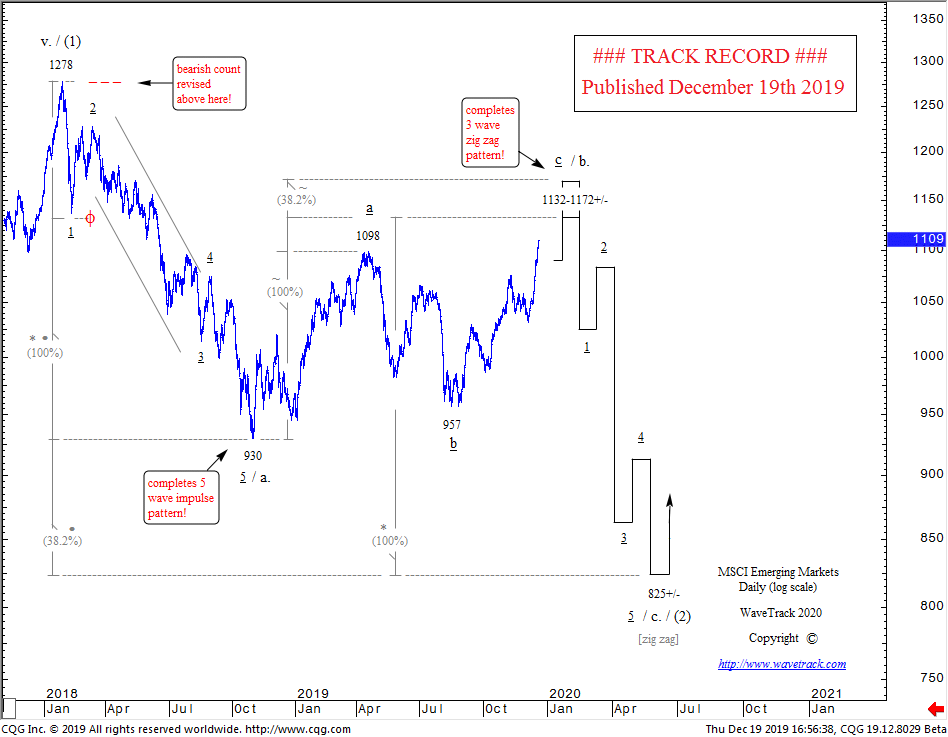
fig #7 – MSCI Emerging Markets – Track Record dated 19th December 2019 – by WaveTrack International
This shows last December’s MSCI Emerging Market index forecast in preparation for the 2020 annual video report. It forecast a collapse lower as minor wave c. from a price-expectancy high of 1132-1172+/- towards a low of 825+/- that completes a counter-trend zig zag pattern from the Jan.’18 high.
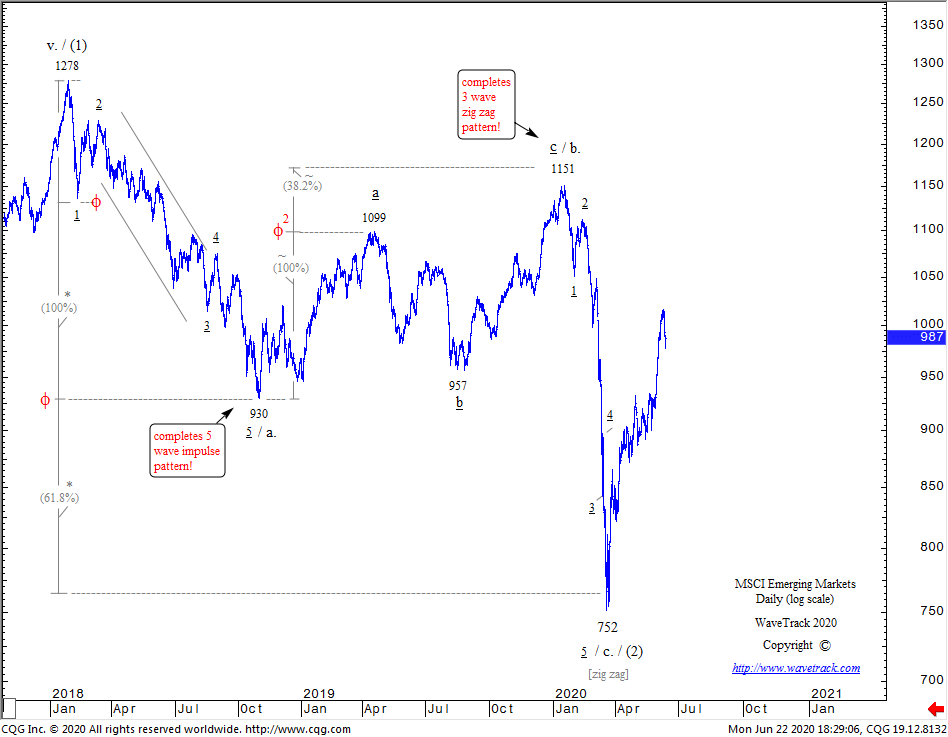
fig #8 – MSCI Emerging Markets – Daily – by WaveTrack International
As you can see, the decline began from 1151 then declined to a major low of 752 before staging a reversal-signature upswing. This is confirming a resumption of its much larger uptrend.
Conclusion
Despite all the conflicting news surrounding COVID-19, financial stock markets are giving clearly bullish signs going forward. We’re excited to see these developments and hope you’ll join us in looking through over 70 charts supporting this outlook in our latest mid-year update.
New Stock Index H2-2020 Video – PART I/III
This MID-YEAR 2020 VIDEO UPDATE for STOCK INDICES is like nothing you’ve seen anywhere else in the world – it’s unique to WaveTrack International, how we foresee trends developing through the lens of Elliott Wave Principle (EWP) and how its forecasts correlate with Cycles, Sentiment extremes and Economic data trends.
We invite you to take this next step in our financial journey with us – video subscription details are below – just follow the links and we’ll see you soon!
Most sincerely,
Peter Goodburn
Founder and Chief Elliott Wave Analyst
WaveTrack International
What you get!
Contents: 73 charts – 1 hour 55 mins.
• Economic Sentiment Indicators (9 charts)
• AAII Bullish Sentiment
• Cape P/E Ratio
• Dow Jones 30 + Cycles
• S&P 500 + Cycles
• Russell 2000
• Nasdaq 100
• Dow Jones Transport
• Dow Jones Utilities
• KBW Banking Index
• XLF Financial
• XLK Technology
• NASDAQ Biotechnology
• XLP Consumer Staples
• XLY Consumer Discretionary
• XOP Oil + Gas Index
• EuroStoxx 50
• Xetra Dax 30
• FTSE-100
• FTSE-30
• EuroStoxx Banks
• Deutsche Bank
• UniCredit
• MSCI Emerging Market
• MSCI BRIC
• MSCI China
• China Enterprises
• MSCI Hong Kong
• Hang Seng
• Shanghai Composite
• Bovespa
• Russia RTS
• Sensex
• Nifty 50
• Taiwan SE Weighted
• Singapore Straits
• ASX 200
• Nikkei 225
BUY NOW on WaveTrack’s VIMEO Video On Demand Page
Click here to buy the STOCK INDEX Mid-Year Video Update 2020
*(additional VAT may be added depending on your country – currently US, Canada, Asia have no added VAT but most European countries do)
We’re sure you’ll reap the benefits – don’t forget to contact us with any Elliott Wave questions – Peter is always keen to hear you views, queries and comments.
Visit us @ www.wavetrack.com
SP500 – Counter-Trend in Progress to 3213.75+/-
by WaveTrack International| June 22, 2020 | No Comments
SP500 – Counter-Trend Zig Zag Rally in Progress from 2923.75 to 3213.75+/-
For more details, see last Friday’s Elliott Wave Compass Report
The SP500 began a corrective 2nd wave downswing from the June high of 3231.25 (futures). Labelled as minor wave ii. two, this unfolding into a minute degree a-b-c zig zag pattern, subdividing 5-3-5. It is the correction of minor wave i. one’s five wave impulse advance that began from the March low of 2174.00.
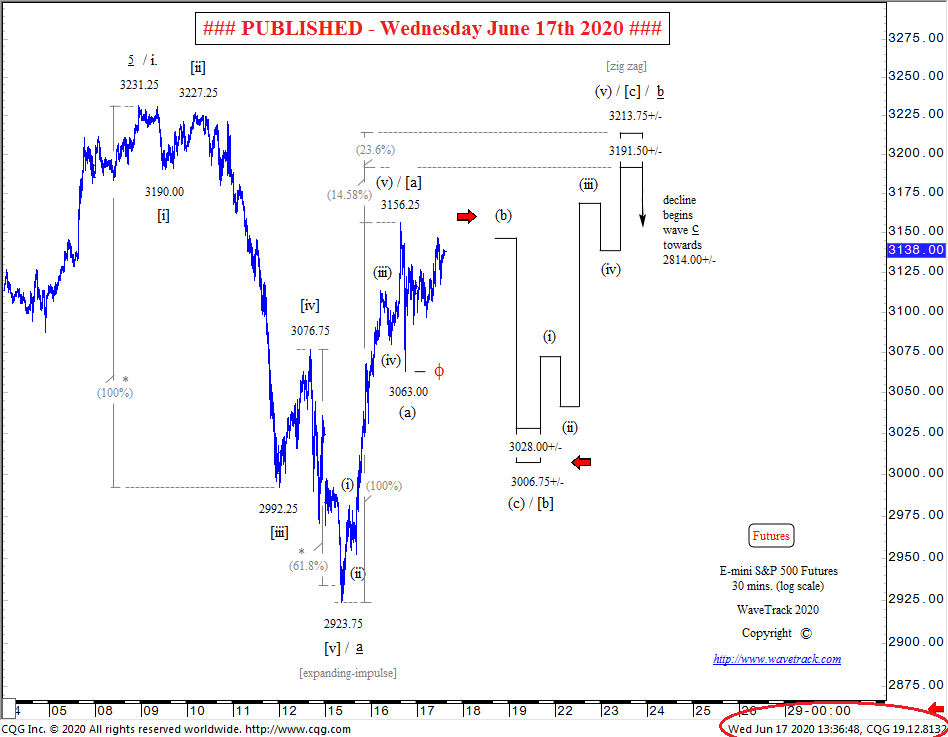
SP500 Futures – 30 mins. – Track Record 17th June 2020
Minute wave a of this corrective zig zag downswing completed already, into the mid-June low of 2923.75. Note its five wave structure, labelled [i]-[ii]-[iii-]-[iv]-[v]. This is being followed by a counter-trend zig zag rally as minute wave b. However, this minute wave b is still incomplete. Labelled [a]-[b]-[c], this must subdivide into a 5-3-5 sequence. Note, wave [a] satisfactorily unfolded into a five wave upswing ending at 3156.25. Although this time last week, wave [b] remained incomplete to the downside where targets were towards 3028.00+/-, max. 3006.75+/-. See fig #1.
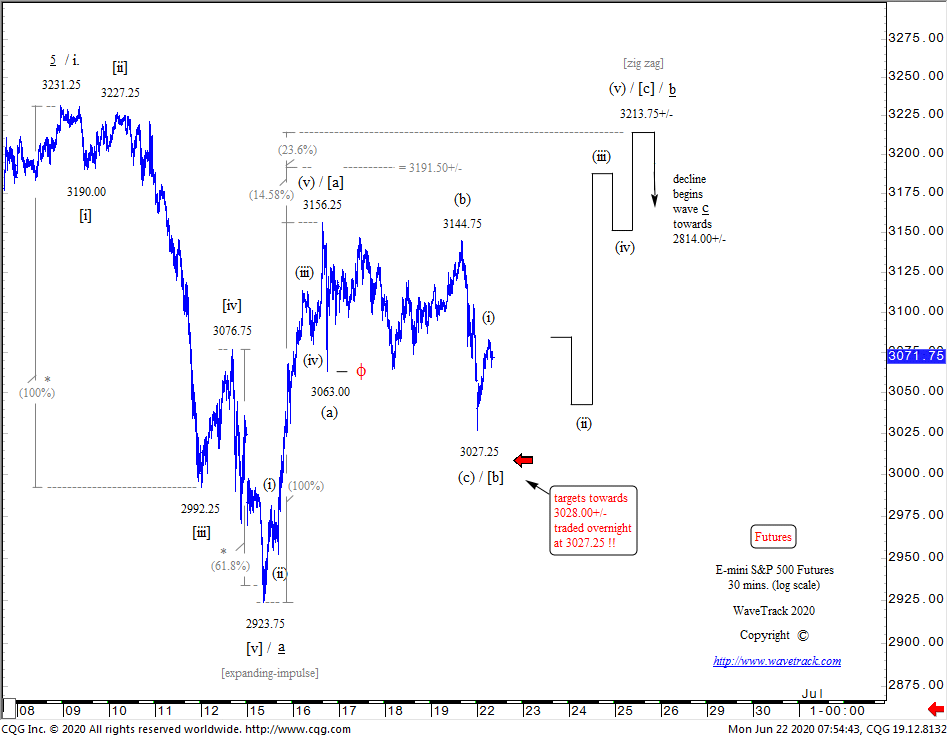
SP500 – 30 mins. – Forecast by WaveTrack International
But overnight selling has now pulled the SP500 down to the 3028.00+/- target level, trading at 3027.25 in completing wave [b] – see fig #2. The immediate response higher is a good indication of its intention to now push higher as wave [c] targeting 3213.75+/- over the next several trading days.
Once this [a]-[b]-[c] zig zag rally has ended minute wave b, then wave c declines can resume the larger zig zag downswing as minor wave ii. two.
The Elliott Wave Compass Report
Get WaveTrack’s latest SP500 forecasts by subscribing to the Elliott Wave Compass report.
The ELLIOTT WAVE COMPASS report focuses on the shorter-term perspective of price development. Firstly, the report is comprised of two online updates per week. Secondly, it is describing and illustrating a cross-section of market trends/counter-trends for stock indices, bonds, currencies, and commodities from around the world. And above all, this report is ideal for professional and private clients trading a time horizon of just a few days to a few weeks ahead.
The bi-weekly EW-Compass report offers a short-term perspective for global markets
· Stock Indices
· Bonds
· Currencies (FX)
· Commodities
If you like to know more details about the Elliott Wave Compass report click here, please click here
Italian ITY10yr Yield
by WaveTrack International| June 5, 2020 | No Comments
The Italian ITY10yr yield has just broken below key support levels traded last week at 1.417% as the ECB commit to more funding – existing downside targets towards 0.993% remain on-track
ECB and Yields
The European Central Bank met earlier this afternoon, deciding on an extension of the Pandemic Purchase Programme (PPP) to at least June 2021. The ECB will buy bonds up to €20bn month plus €120bn this year in a total programme rising from €600bn to €1.35 trillion Euros. The central bank leaves the main refinancing rate unchanged at 0.00% per cent.
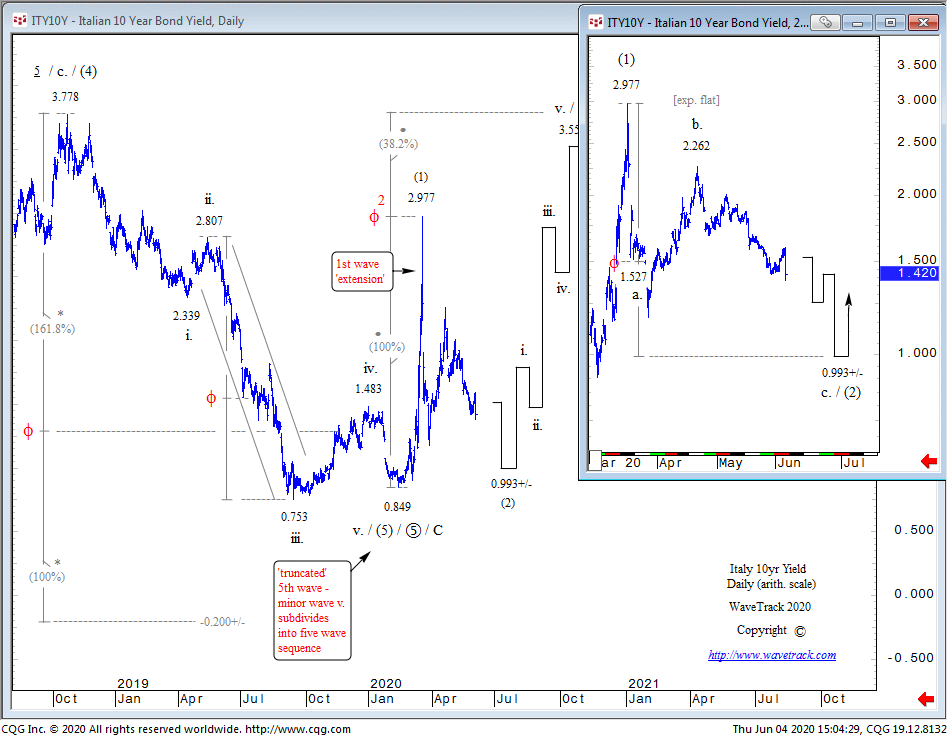
fig #1 – Italy 10yt Yield – Daily – Elliott Wave Forecast by WaveTrack International
The news of more funding into the financial system was a commitment that sends the ITY10yr yield tumbling lower from 1.592% just before the announcement to 1.373% before closing the session at 1.408%. The break below last week’s support at 1.417% is confirming original downside targets towards 0.993% remain on-track – see fig #1.
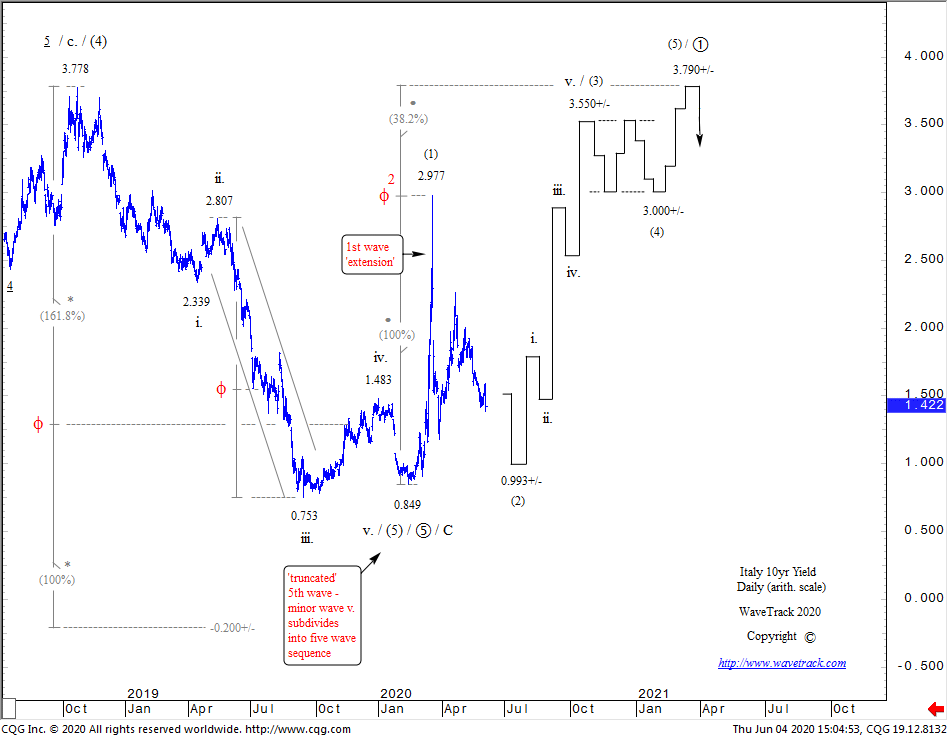
fig #2 – Italy 10yr Yield – Daily – Elliott Wave Forecast by WaveTrack International
Once completed at 0.993, this decline ends a zig zag pattern for intermediate wave (2) from 2.977 opening the way for a continuation of the larger five wave impulse uptrend as wave (3) towards 3.550+/- and ultimately wave (5) to 3.790+/- sometime next year – see fig #2 & fig #3.
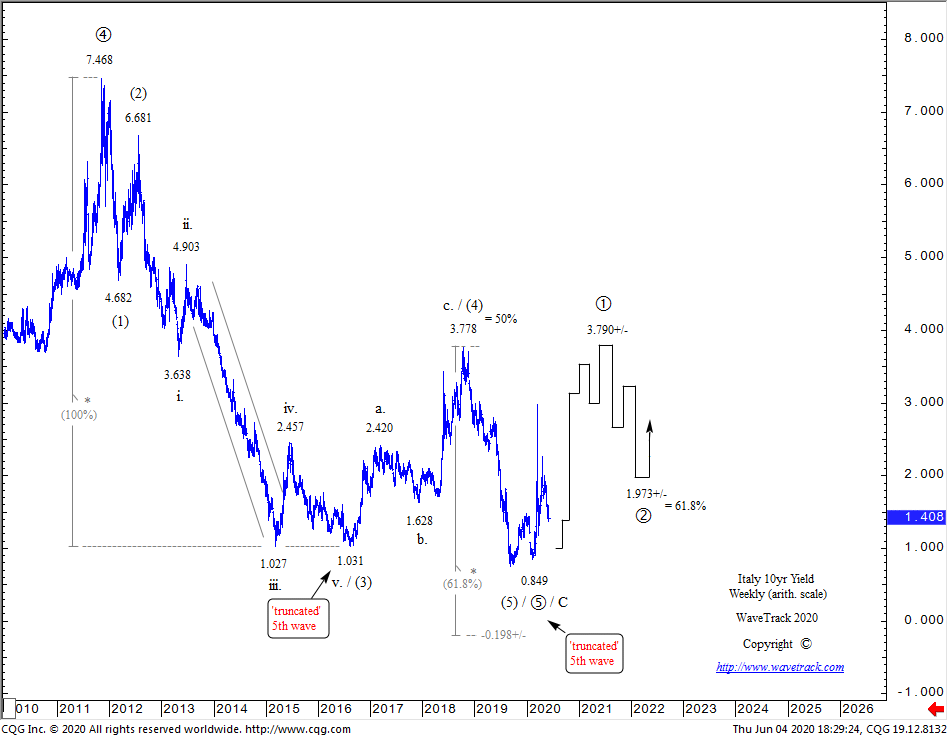
fig #3 – Italy 10yr Yield – Weekly – Elliott Wave Forecast by WaveTrack International
The long-term picture remains unchanged. Cycle wave A’s five wave impulse uptrend is forecast towards 8.820+/- during the next several years – see fig #4.
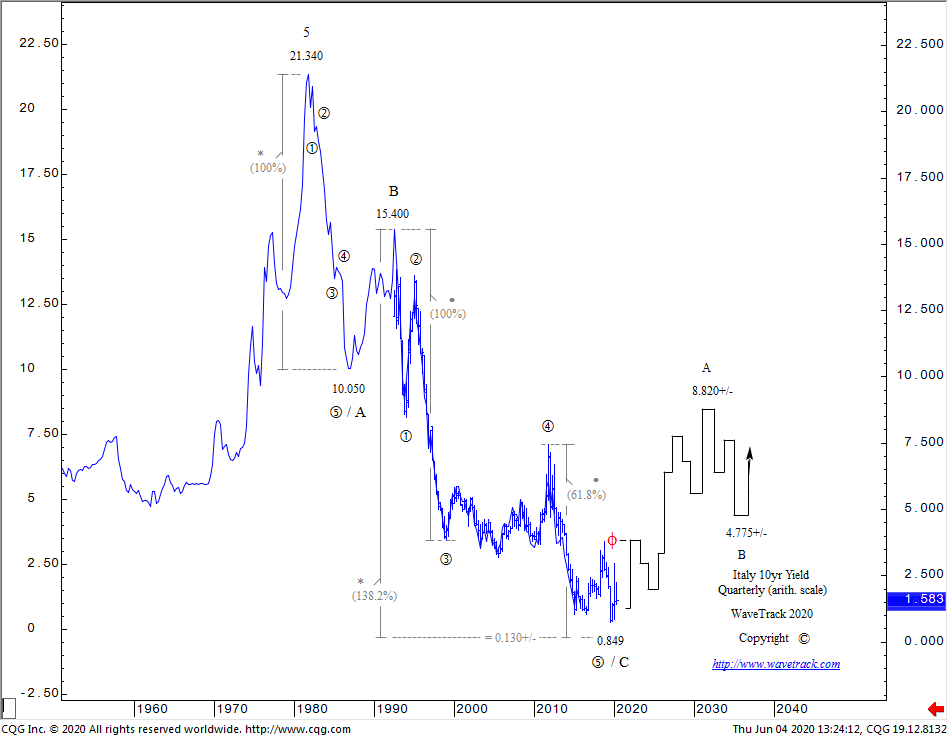
fig #4 – Italy 10yr Yield – Quarterly – Elliott Wave Forecast by WaveTrack International
Italian and German 10yr Yield
The ITY10yr-DE10yr yield spread is clearly narrowing over the medium term over the next several years. However, the intermediate-term picture suggests some narrowing in the short-term. With shorter-term targets towards 1.500+/- as minor wave b. within an a-b-c widening counter-trend upswing of wave (2) that began from the Feb.’20 low of 1.263 (weekly closing chart) – see fig #5. Minor wave c. upside targets over the coming year are towards 3.018+/-.
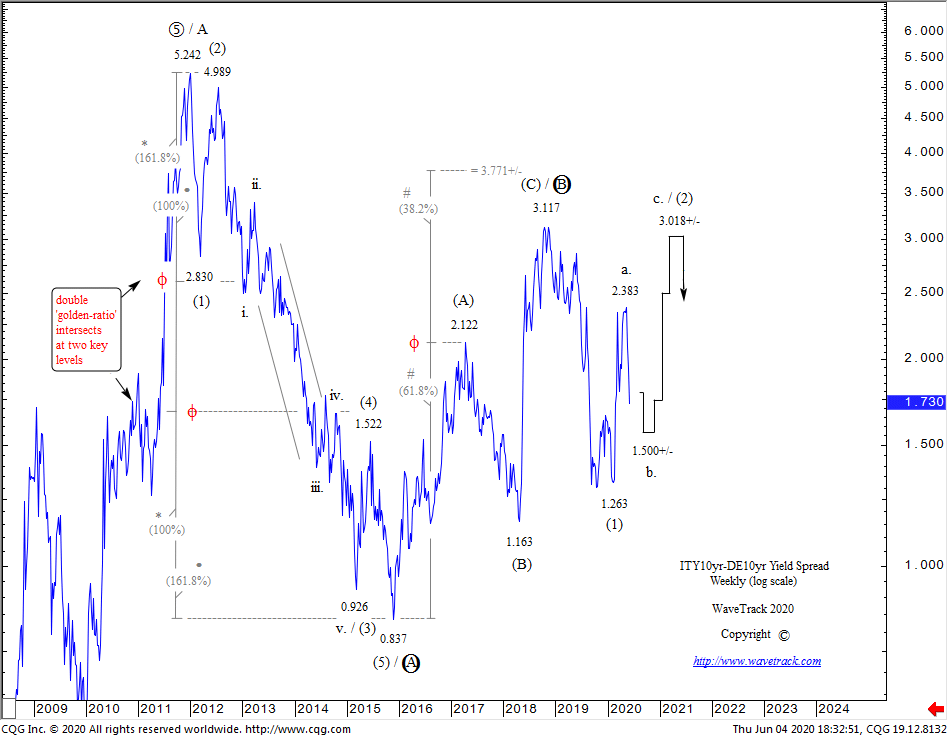
fig #5 – Italy 10yr-DE 10yr Yield – Weekly – Elliott Wave Forecast by WaveTrack International
Conclusion
The ECB is obviously ready to go to any lengths to support the Eurozone economy. For the time being, that is triggering lower Italian yields. However, slightly higher DE10yr bund yields as the burden of payment lies with Germany.
XOP Oil and Gas Index/ETF – Advance
by WaveTrack International| May 12, 2020 | 2 Comments
Mid-March $29.48 Low Begins 2½ Year Advance to 1180.00+/-
Read more «XOP Oil and Gas Index/ETF – Advance»
SP500 – Heading Lower
by WaveTrack International| April 28, 2020 | No Comments
SP500 – Expanding Flat – Heading Lower Towards 2655.75+/-
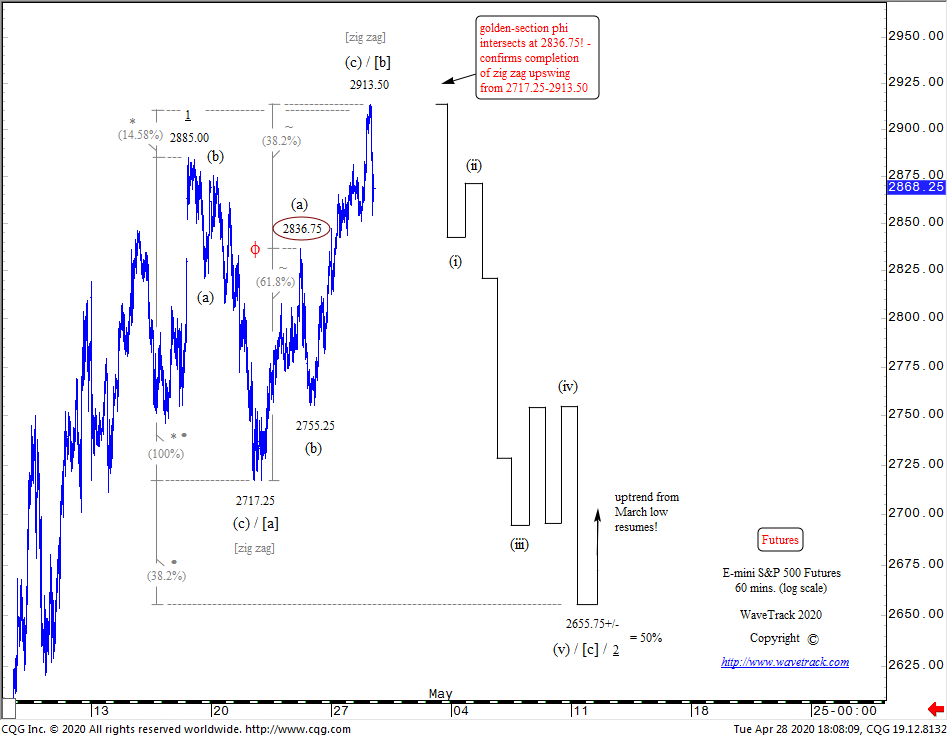
SP500 E-mini Futures – 60 mins. – Elliott Wave Forecast by www.wavetrack.com – WaveTrack International
The SP500 has just completed a three wave zig zag rally from last week’s low of 2717.25 into today’s high of 2913.50. This pattern is labelled in sub-minuette degree, (a)-(b)-(c). Note how extending wave (a) by a fib. 61.8% ratio projects the terminal high for wave (c) smack into the actual high of 2913.50, validating its completion.
The 2913.50 high ends a larger degree [b] wave advance within a declining [a]-[b]-[c] expanding flat pattern. By extending wave [a]’s initial decline to 2717.25 by a fib. 14.58% ratio projects a terminal high towards 2910.25, just a slither away from the high.
Wave [a] can also be extended to the downside by fib-price-ratios in determining the terminal low for wave [c]’s five wave impulse downswing. We’ve selected a fib. 38.2% ratio because this converges with the fib. 50% retracement level of the preceding impulse advance of minute wave 1 that began from the April 2nd low of 2424.75 (log scale). This projects wave [c] towards 2655.75+/-.
Conclusion
Identifying this expanding flat pattern verifies the larger advance from the March 23rd low of 2174.00 is a bullish 1-2-1 sequence with another 2nd wave correction underway towards 2655.75+/-.
This disproves the theory that March’s advance is a corrective zig zag within a secular-bear downtrend. Rather, it proofs the bullish outlook of the secular-bull uptrend of intermediate wave (5).
If you’d like to see more charts like this, please subscribe to our latest video update – more information here:
SPECIAL VIDEO – Aftermath of the Coronavirus Sell-off – Inflation-Pop Diluted but Still On-Track
Get WaveTrack’s latest SP500 forecasts by subscribing to the Elliott Wave Compass report.
The ELLIOTT WAVE COMPASS report focuses on the shorter-term perspective of price development. Firstly, the report is comprised of two online updates per week. Secondly, it is describing and illustrating a cross-section of market trends/counter-trends for stock indices, bonds, currencies, and commodities from around the world. And above all, this report is ideal for professional and private clients trading a time horizon of just a few days to a few weeks ahead.
The bi-weekly EW-Compass report offers a short-term perspective for global markets
· Stock Indices
· Bonds
· Currencies (FX)
· Commodities
If you like to know more details about the Elliott Wave Compass report click here, please click here
Gilead Sciences – Stock Pops +16% Overnight!
by WaveTrack International| April 17, 2020 | 2 Comments
Gilead Science’s stock pops +16% per cent in the pre-market following its announcement that its coronavirus drug trial shows encouraging early results. However, in the past it has been shown that vaccines need longer testing to be deemed safe.
Gilead Sciences has been on our stock-watch list since the beginning of the coronavirus pandemic began to spread outside of China in early February. Overnight news that it’s made progress in clinical testing of a new drug that combats the symptoms of the coronavirus has sent its stock price up +16% per cent in the pre-market.
Trading overnight has been as high as 89.38. Although it’s drifted lower in the last hour from that high to 84.20. But could this leap higher have been predicted? Any number of companies engaged in the rush to find a cure for coronavirus could be watched. However, this stock did get our interest early on because of its pattern development.
Back in December ‘18, Gilead Sciences had completed a multi-year corrective downswing that began from the Oct.’14 high of 116.83 at 60.32 – see fig #1. This correction unfolded into a typical Elliott Wave expanding flat pattern as primary wave 4 whilst labelled in intermediate degree, (A)-(B)-(C).

Gilead Sciences – Weekly – Financial Forecast by WaveTrack International
Gilead and Fibonacci Ratio Analysis
Wave (A) ended an initial three wave zig zag downswing to 85.95 which was followed by another zig zag upswing to 123.37. Wave (C)’s decline would normally extend below wave (A) by a fib. 38.2% ratio (or sometimes 23.6%. 14.58%). But in this case, it extended by a fib. 100% ratio. This rather uncommon fib-price-ratio measurement was required in order to fully balance the preceding uptrend of primary wave 3’s advance so that wave 4’s percentage correction was at least similar to wave 2’s decline.
Nevertheless, extending wave (A) by a fib. 100% ratio projected a terminal low for wave (C) to 59.88+/-. The actual low was in close proximity, at 60.32.
It then spent another year doing absolutely nothing until prices shot higher towards the end of February this year and now overnight to 89.38. As you can see from the chart, upside targets to complete wave (1) were towards 90.70+/-. And in answer to the original question, could this pop higher have been predicted, the answer is clearly yes.
What Next?
The long-term uptrend of Gilead Sciences shows an incomplete five wave impulse uptrend in development from the June ’94 low of 0.20 – see fig #2.

Gilead Sciences – Monthly – Financial Forecast by WaveTrack International
The December ’18 low ended primary wave 4 with a percentage decline of -48.3% per cent. Very similar to primary wave 2’s decline of -57.5% per cent.
Primary wave 5 now seems well established to the upside, notwithstanding a potential wave (2) correction at some stage soon. Other than that, primary wave 5 upside targets remain unchanged towards 235.75+/-. This measurement is derived by extending the initial 1-2-1 sequence from 0.20 to 2.98 by a fib. 161.8% ratio.
Subscribe!
Institutions –
Private Investors –
SP500 – Crisis! What Crisis!
by WaveTrack International| April 15, 2020 | No Comments
The SP500 advance is only three waves up from the March 23rd low – so does this qualify as a corrective a-b-c zig zag within a secular-bear downtrend, or a bullish 1-2-1 sequence within the continuation of the secular-bull uptrend?
The Big Question
Given the amount of correspondence received recently, we’d like to address the one big question that rests upon everyone’s lips. Has February/March’s coronavirus sell-off begun a secular-bear downtrend? Or has the March 23rd low ended a counter-trend correction within the continuation of a secular-bull uptrend?
Our Elliott Wave analysis suggests the March 23rd low ended a correction within the continuation of the secular-bull uptrend. But let’s see if this can really be objectively substantiated.
Mainstream Elliott Wave analysts are saying we’re entering the beginning of a secular-bear downtrend. However, this seems fanciful and not substantiated basis introspective analysis across varying stock indices. Why not take a look at equities or other asset classes?
SP500 – Up or Down?
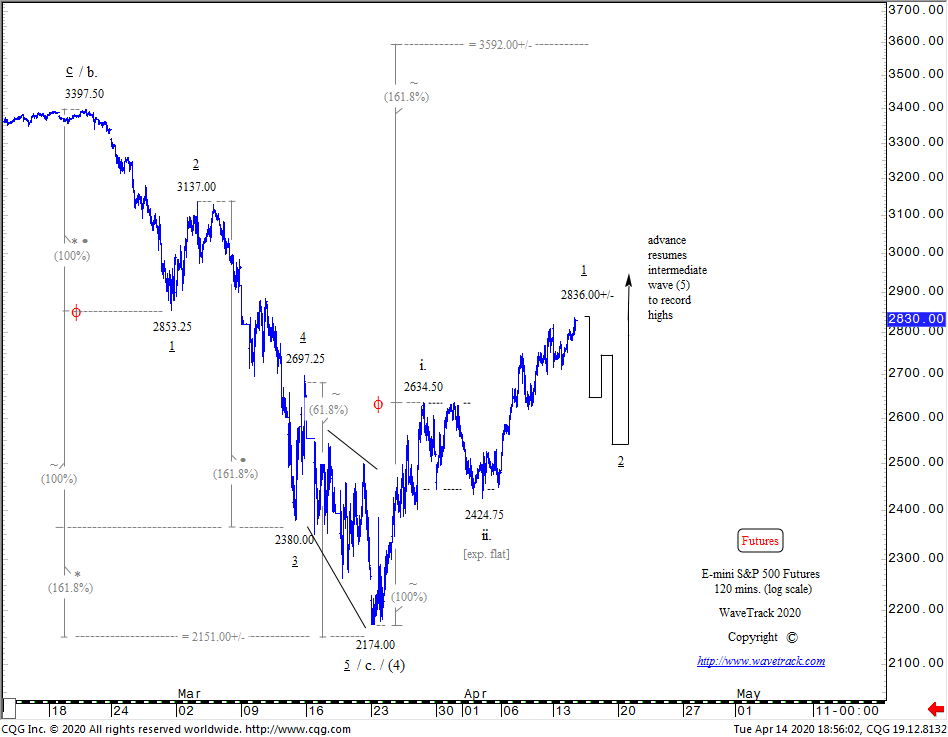
E-Mini SP500 Futures – 120 mins. by WaveTrack International
This first chart of the SP500 depicts a five wave impulse downswing from February’s high of 3397.50 ending into the March 23rd low of 2174.00 – see fig #1. This actual low of 2174.00 was forecast on the very day it occurred (see WaveTrack social media updates, twitter and FaceBook dt. March 23rd). See here:
#SP500 – End of Coronavirus Sell-Off – #ElliottWave – https://t.co/GF8fEbEiAq pic.twitter.com/NcBccuHhdU
— Elliott WaveTrack (@ElliottWave_WTI) March 23, 2020
This decline has excited the bears! Mainly, because the next rally has unfolded into a three wave sequence to current levels of 2836.00+/-. But is this an a-b-c corrective zig zag? Or as we suggest, a bullish 1-2-1 sequence?
SP500 and The Larger Picture
Viewed in isolation, both can be equally true! But to answer this truthfully, we must first take a look at how these two sequences, the five wave decline and the three wave rally fit into the larger picture.
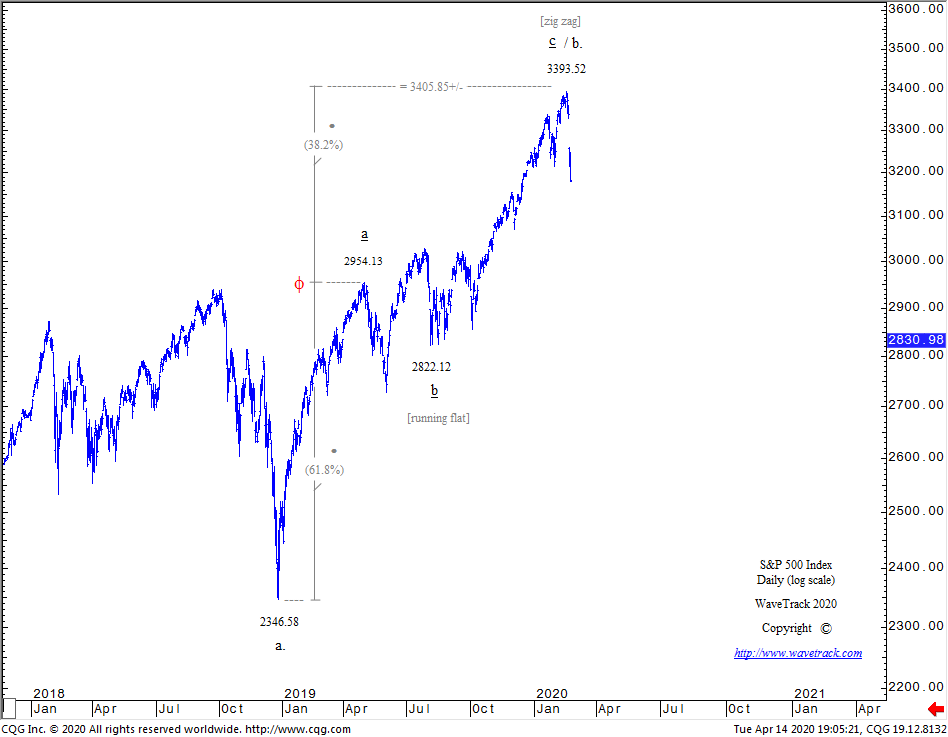
SP500 Index – Daily mins. by WaveTrack International www.wavetrack.com
What must be considered is the way the SP500’s advance from the Dec.’18 low of 2346.58 (cash) unfolded into the Feb.’20 high of 3393.52 – see fig #2. In this chart, we can ‘proof’ that it unfolded into an a-b-c zig zag pattern – from a qualitative perspective, both waves a and c subdivide into a necessary five wave impulse sequence – from a quantitative perspective, this advance fits perfectly into the criteria of unfolding into a zig zag, where wave a is extended by a fib. 61.8% ratio in projecting the terminal high for wave c at 3405.85+/- (small deviation).
We already know that secular-bull uptrends don’t finish major highs as zig zags but as five wave impulse patterns. The only time a zig zag can end a secular-bull uptrend in this way is if it were the 5th wave within an ending-diagonal, but this is clearly not the case here.
SP500 Index – Daily mins. by WaveTrack International www.wavetrack.com
This a-b-c zig zag is in fact, the second sequence, i.e. minor wave b. within a larger a-b-c 3-3-5 expanding flat pattern that began unfolding lower as intermediate wave (4) from the Jan.’18 high of 2872.87 – see fig #3. This explains why February/March’s sell-off to 2196.86 unfolded into a five wave impulse pattern, ending at 21941.86 (cash), 2174.00+/- (futures).
Putting these aspects together, the outlook turns bullish over the next couple of years, not bearish.
But what about the three wave upswing from the March 23rd low? Well, this must be a bullish 1-2-1 sequence – another 2nd wave correction is due, but that should, must end above the secondary low of 2424.75 (futures).
Corroboration – Deutsche Bank – UniCredit Bank
There are many other global indices that support this bullish development – Europe’s Eurostoxx 50 and Xetra Dax, the U.K.’s FTSE-100 are all showing major corrective downswings ended last month. But we’ve also taken a look at the underperforming European Banking Sector to get some idea of which direction the larger trends are developing.
Deutsche Bank
Deutsche Bank – Weekly by WaveTrack International
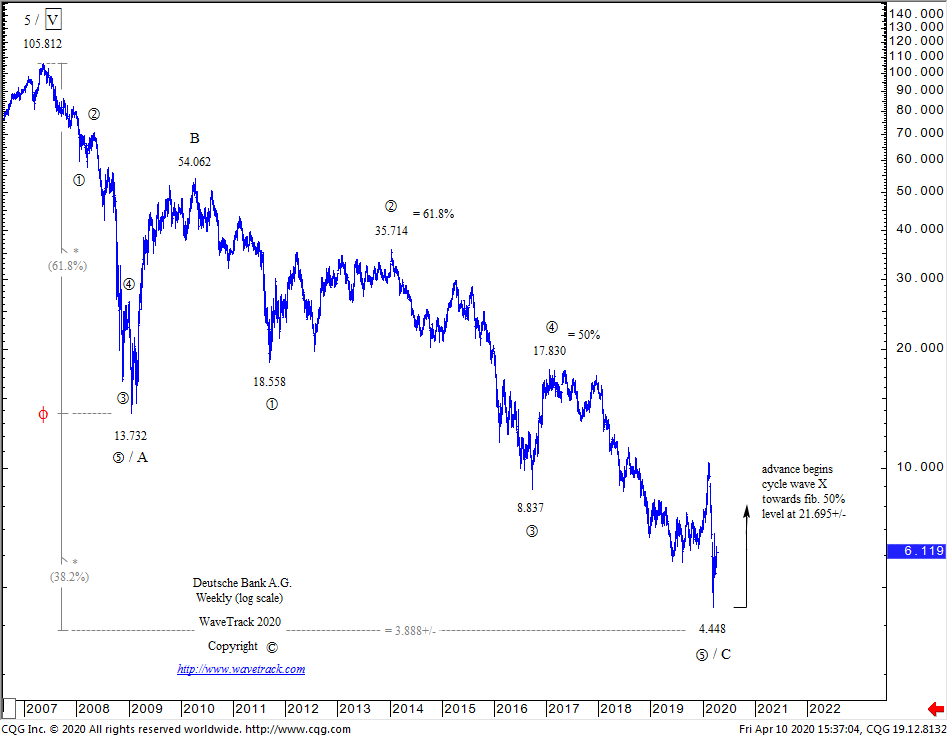
First up is Deutsche Bank. This equity has been underperforming for so long, it’s guaranteed that it will look super-bearish if the SP500 were beginning a secular-bear downtrend. But it’s not! See fig #4. Deutsche Bank is just finishing a major A-B-C zig zag downswing from its all-time high of 105.812 into the March ’20 low of 4.448. We can ‘proof’ this where cycle waves A and C both subdivide into a five wave impulse sequence whilst wave C approaches a terminal low at the fib. 61.8% extension below cycle wave A. Now that’s really bullish. A multi-year rally can begin now. You wouldn’t see that if the SP500 were about to collapse lower!
UniCredit

UniCredit – Weekly – Financial Forecast by WaveTrack International
Second, up is UniCredit Bank. It has also declined into a huge A-B-C zig zag corrective pattern from its all-time high of 256.290 ending into the March ’20 low of 6.420! See fig #5. Even more interesting is how cycle wave C’s decline has unfolded, into a five wave ending/contracting-diagonal pattern. Unlike expanding-impulse patterns, the completion of an ending-diagonal pattern has certain finite limits. It can’t ‘extend’ like an expanding-impulse, instead is confined to its narrowing boundary lines. In all probability, it has already ended its concluding 5th wave at 6.420. Now that’s very bullish going forward, and like Deutsche Bank, has the opportunity to begin a multi-year recovery advance – that wouldn’t be the case if the SP500 were about to collapse lower.
Conclusion
There’s no doubt that global economies have been hard hit due to the coronavirus pandemic. Will they recover? Yes, we think they will. It may take longer for Main-Street to pick itself off the ground than Wall-Street. But the omens look good – Crisis! What Crisis!? [Supertramp – circa. 1975].
If you’d like to see more charts like this, please subscribe to our latest video update – more information here:
SPECIAL VIDEO – Aftermath of the Coronavirus Sell-off – Inflation-Pop Diluted but Still On-Track
Get WaveTrack’s latest SP500 forecasts by subscribing to the Elliott Wave Compass report.
The ELLIOTT WAVE COMPASS report focuses on the shorter-term perspective of price development. Firstly, the report is comprised of two online updates per week. Secondly, it is describing and illustrating a cross-section of market trends/counter-trends for stock indices, bonds, currencies, and commodities from around the world. And above all, this report is ideal for professional and private clients trading a time horizon of just a few days to a few weeks ahead.
The bi-weekly EW-Compass report offers a short-term perspective for global markets
· Stock Indices
· Bonds
· Currencies (FX)
· Commodities
If you like to know more details about the Elliott Wave Compass report click here, please click here
Aftermath of the Coronavirus Sell-off Video Update
by WaveTrack International| March 27, 2020 | No Comments
Aftermath of the Coronavirus Sell-off – Inflation-Pop Diluted but Still On-Track
The coronavirus sell-off in global stock indices has been described by Goldman Sachs as a ‘Black Swan’, a term for an improbable or unforeseen event. Economist Burton Malkiel who authored the 1973 book ‘A Random Walk Down Wall Street’ said he could not spot a recession on the horizon – he also qualified his remarks by saying that predicting a recession is a very difficult task. So was the coronavirus sell-off really an unpredictable, exogenous event or could the downturn have been foreseen?
Coronavirus – Could it have been predicted?
From an Elliott Wave perspective, yes, the downturn and even its amplitude could have been predicted. Our own analysis was blinded by the fact that various positive-correlation studies indicated a limited risk to a sell-off because of the extent of gains in technology stocks combined with a maturing counter-trend downswing in key commodities like Copper from 2018 highs. But there was evidence that heightened the downside risk which means it was certainly plausible to predict the downturn (see ‘Update Alert!’ e-mail dt. February 25th – ‘Increasing Risk of -20% Decline’). Almost all U.S. and European indices completed A-B-C zig zag advances from their Dec.’18 lows into the mid-February highs – and that was the clue to the coronavirus sell-off. See fig #1.
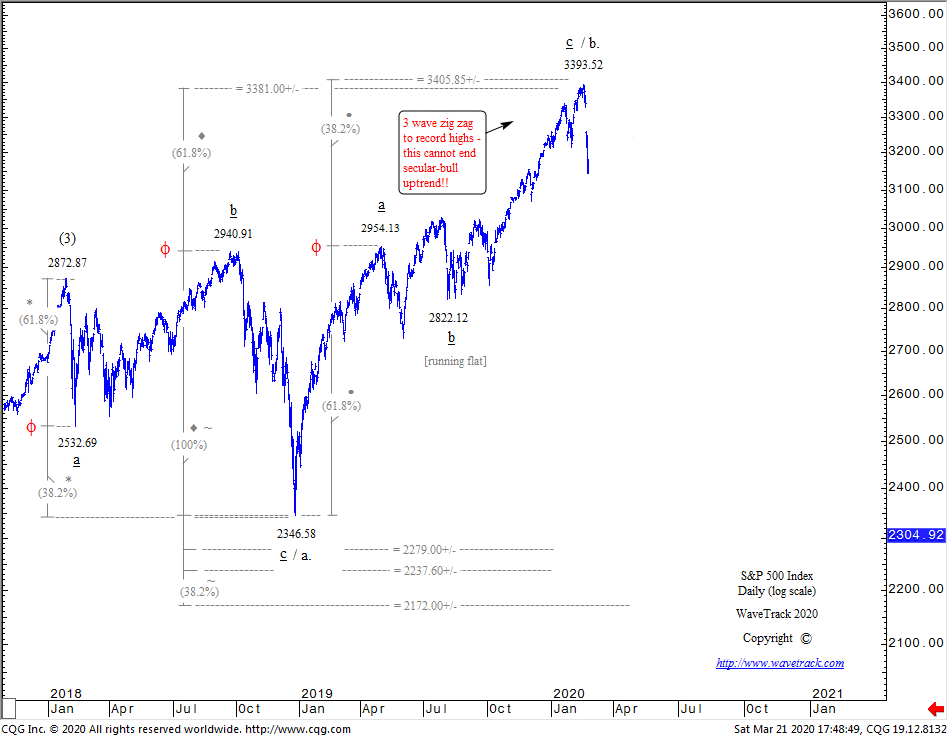
SP500 – Daily – WaveTrack International
This report updates the S&P 500 and Nasdaq 100 indices which are used as benchmarks for pretty much everything else. The DJ Transportation Average and KBW Banking indices are also updated, giving relevance to the ongoing secular-bull uptrend.
We also update benchmark commodities that are all-so-important in triggering this next but final phase of inflationary pressures – Copper remains on track, heading for record highs as are many other Base Metals – but the coronavirus sell-off in Silver, Platinum and Crude Oil has diluted their participation – but they’ll still have massive gains over the next few years, they just won’t trade to record highs anymore.
Dilution of Inflation-Pop
One of the big ‘take-home’ effects from the coronavirus sell-off is its impact on commodities like Precious Metals and Crude oil. With Silver breaking below its Dec.’15 low of 13.64, that really negates any notion that prices could launch into new record highs during this next but last stage of the ‘Inflation-Pop’ – it’s a similar condition for Platinum too. They will still push dramatically higher over the next few years, but they won’t break to new record highs. Crude oil is similar. Its recent break below the Feb.’16 low of 26.05 to 20.52 has just about negated any chance of it trading to new record highs during the next few years – but it can still test levels towards 99.25+/-.
What this means is the coronavirus sell-off has in some cases, diluted the up-coming advances for several key commodities during this next but last stage of the ‘Inflation-Pop.
That’s not the case for many of the mining stocks though – gold and base metal miners are still forecast to new record highs.
Currencies & Interest Rates
This report also updates the US$ dollar index and several other major currency pairs. In the annual PART III Currencies & Interest Rate report, over 90 charts of different currency pairs/crosses were updated. Many of those forecasts remain unchanged, especially those US$ Dollar/Asian currency pairs which already depicted dollar strength.
There are only modest changes to the US$ dollar index and Euro/US$, more for Stlg/US$ and US$/Yen but this report updates others which have seen severe weakness against the US$ dollar including the Aussie Dollar, Canadian Dollar, Norwegian Krona and Brazilian Real.
Long-dated government bond yields collapsed at the beginning of March. Even though Elliott Wave analysis depicted declines through most of 2019 and into the first quarter of 2020, we didn’t expect the US10yr yield to collapse down to 0.378% per cent! But ‘Update-Alerts’ quickly identified that low as the end of its long-term downtrend, and since, yields have sprung higher to 1.269%. This report examines the trends across varying maturities alongside the latest forecasts for the European DE10yr yield, Italian ITY10yr yield and related spreads.
S&P 500 – End of the Coronavirus Sell-Off
On Friday 20th March, the EW-Compass report commented –
‘The S&P’s rally from last Wednesday’s low of 2262.00 has so far unfolded higher into only a three wave sequence to Friday’s high of 2497.25… could stretch lower towards 2151.00+/- early Monday/Tuesday this coming week…It now seems inevitable that Monday’s opening will test lower levels before reversal-signatures get triggered. European indices alongside several Asian indices were already completing idealised targets last Thursday – which means the U.S. indices require one additional pull lower before re-synchronising’.
Sure enough, come Monday 23rd March, the S&P 500 put in a major low at 2174.00 which has since triggered a major ‘reversal-signature’. The S&P’s gain since has rallied by +21% per cent, setting some new records.
The outlook now turns very bullish despite many analysts crowding around the idea that the secular-bull uptrend has ended with the beginning of an Armageddon collapse on its way – THINK AGAIN! – the evidence suggests otherwise!
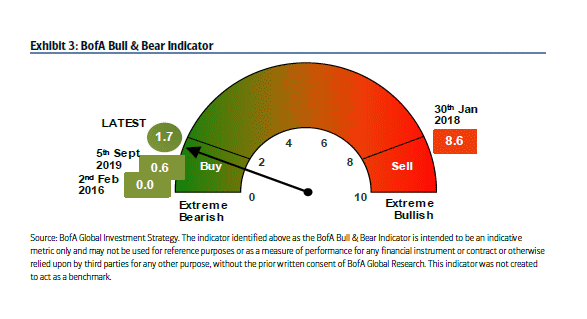
Bank of America – Bull and Bear Indicator – Souce BofA Global Investment Strategy
One contributing aspect that supports the idea the coronavirus panic has abated comes from the latest Bank of America/Merrill Lynch sentiment Bull & Bear Indicator – see fig #2. It shows extreme measures of bearishness at a reading of 1.7 – by comparison, the Feb. 2nd 2016 low in major indices produced a reading of 0.0 which as we know, produced a sustainable uptrend afterwards. We all know the risks of interpreting this type of data too literally, but accompanied by Elliott Wave analysis, it offers an insight to what’s ahead.
Update of 2020 Elliott Wave Forecasts
In this latest video/report, we amassed 54 charts updating the major changes from our 2020 annual trilogy series across each asset class, Stock Indices, Commodities, Currencies & Interest Rates together with key Equities from the Mining Sector. These corroborate the next but final stage of the ‘Inflation-Pop’ asset price surge!
We invite you to take this next step in our financial journey with us – video subscription details are below – just follow the links and we’ll see you soon!
Most sincerely,
Peter Goodburn
Founder and Chief Elliott Wave Analyst
WaveTrack International
How to Subscribe:
Contents: 54 charts Time: 1 h 27 mins.
SP500
Nasdaq 100
DJ Transportation Average
KBW Banking Index
EuroStoxx 50
Xetra Dax
Ftse 100
Hang Seng
MSCI Emerging Markets
Nikkei 225
BHP Billiton
Antofagasta
Freeport McMoran
Rio Tinto
Vale
Copper
Zinc
Gold
Silver
Platinum
Newmont Mining
Amer Barrick
Anglo Gold Ashanti
Crude Oil
USD Dollar Index
EUR/USD
STLG/USD
USD/YEN
AUD/USD
USD/CAD
USD/NOK
USD/BRL
US 10yr Yield
USD 5yr Yield
USD 2yr Yield
Germany 10yr Yield
Italy 10yr Yield
HOW CAN YOU RECEIVE THE VIDEO FORECAST?
To receive your VIDEO UPDATE please click here to contact us.
– Please state if you wish to purchase the Aftermath of the Coronavirus Sell-off Video Update March 2020 for USD *48.00 and send us an email to services@wavetrack.com?
– Next we will send you a PayPal payment request and provide you with the video link & PDF report once payment is confirmed. Please know the reply can take up to 6 hours due to time zone differences. But rest assured we will give our best to provide you with the information as soon as possible!
*(additional VAT may be added depending on your country of residence. Currently, the US, Canada, Asia have no added VAT but most European countries do)
We’re sure you’ll reap the benefits – don’t forget to contact us with any Elliott Wave questions – Peter is always keen to hear your views, queries, and comments.
Visit us @ www.wavetrack.com

Recent Posts
Recent Comments
Archives
- February 2026
- December 2025
- August 2025
- July 2025
- June 2025
- March 2025
- February 2025
- January 2025
- December 2024
- August 2024
- July 2024
- June 2024
- May 2024
- April 2024
- February 2024
- January 2024
- December 2023
- August 2023
- July 2023
- June 2023
- March 2023
- February 2023
- January 2023
- December 2022
- November 2022
- October 2022
- August 2022
- July 2022
- June 2022
- May 2022
- March 2022
- February 2022
- January 2022
- December 2021
- August 2021
- July 2021
- June 2021
- March 2021
- February 2021
- January 2021
- December 2020
- November 2020
- August 2020
- July 2020
- June 2020
- May 2020
- April 2020
- March 2020
- February 2020
- January 2020
- December 2019
- October 2019
- September 2019
- July 2019
- June 2019
- May 2019
- April 2019
- March 2019
- February 2019
- January 2019
- December 2018
- November 2018
- September 2018
- August 2018
- July 2018
- June 2018
- May 2018
- April 2018
- March 2018
- February 2018
- January 2018
- December 2017
- November 2017
- October 2017
- September 2017
- August 2017
- July 2017
- June 2017
- May 2017
- March 2017
- February 2017
- January 2017
- December 2016
- November 2016
- October 2016
- September 2016
- August 2016
- July 2016
- June 2016
- May 2016
- April 2016
- March 2016
- February 2016
- January 2016
- December 2015
- November 2015
- October 2015
- September 2015
- August 2015
- July 2015
- June 2015
- May 2015
- April 2015
- March 2015
- February 2015
- January 2015
- December 2014
- November 2014
- October 2014
- September 2014
- August 2014
- July 2014
- June 2014
- May 2014
- April 2014
- March 2014
- February 2014
- January 2014
- December 2013
- November 2013
- October 2013
- September 2013
- August 2013
- July 2013
- June 2013
- May 2013
- April 2013
- March 2013
- February 2013
- January 2013
- December 2012
- November 2012
- October 2012
- September 2012
- August 2012
Categories
- ADXY Index
- Agnico Eagle Mines
- AI Artificial Intelligence
- Alcoa
- Amazon
- AngloGold Ashanti
- Antofagasta
- APPL
- Apple
- ASX 200
- AUD vs USD
- AUDNZD
- AUDUSD
- Australia ASX 200
- Baltic Dry Index
- Banking
- Base Metals
- Biotechnology
- Bitcoin
- Bovespa
- Broadcom
- Catalexit
- central banks
- Christmas
- Commodities
- Commodities Video Outlook 2020
- Conference
- Copper
- Coronavirus Sell-Off
- CRB
- Crude oil
- crude oil price chart
- CryptoCurrency
- Currencies
- Currencies + Interest Rates Video Outlook
- Cycles
- Dax 30
- deutsche bank
- Dewey Cycle
- DJ Transportation Average
- DJ Utilities
- Dow Jones 30
- Dow Theory
- ECB
- economy
- Elliott Wave
- Elliott Wave Charts
- Elliott Wave Patterns
- Elliott Wave Principle
- Emerging Markets
- Ending-Diagonal Elliott Wave Pattern
- Equity
- EUR vs CHF
- EUR/USD
- Euro / US$
- Eurostoxx 50
- EuroStoxx50
- EuroStoxxBanks
- EURUSD
- Expanding Flat Pattern
- FAAMG
- FANG+
- fib-price-ratio
- Fibonacci Trading
- Fibonacci-Price-Ratio
- Financial Forecasting
- Fixed Income
- forex
- Freeport McMoran
- FTSE 100
- Fund Management
- FX
- FXStreet
- GBP/AUD
- GBP/USD
- GDX
- GDXJ
- Germany 10 year Euro Bund future
- Gilead Sciences
- Glencore
- Global Economy
- Gold
- Gold Mining
- Golden Ratio
- goldman sachs
- Google Inc.
- Google/Alphabeth
- Greek debt crisis
- Hang Seng
- Harbinger
- Hungarian Forint
- IBEX 35 Index Spain
- Independent Research
- India-CNX Nifty 50
- Interest Rates
- Interview
- IRP Independent Research
- kbw bank index
- Lonmin
- MAG-7
- McDonald's
- MID-YEAR VIDEO UPDATE!
- Mifid II
- Mines
- Mining
- MSCI China
- MSCI Emerging Markets
- Nasdaq 100
- Nasdaq Biotechnology Index
- Nasdaq Composite
- Nasdaq100
- Netflix
- Newmont Mining
- Nikkei 225
- NVIDIA
- NYSE Composite Index
- Palladium
- Platinum
- Precious Metals
- Ralph Nelson Elliott
- Reversal-Signature
- Russell 2000
- Russia RTS
- S&P 500
- Sector
- Secular-Bull
- Sentiment Survey
- Shanghai Composite Index
- Silver
- Slanting Flat Elliott Wave Pattern
- SP100
- SP400 Mid-Cap
- SP500
- SPX 500
- STLG/AUD
- Stlg/US$
- STLG/USD
- STLG/YEN
- STLG/ZAR
- Stock Index
- Stock Index Tracking
- Stock Index Video
- Stock Indices
- Stock Indices Video Outlook 2023
- Stock Indices Video Outlook 2025
- Sugar
- Summary
- Tesla
- Tesla Inc
- Toyota
- Track Record
- trading
- Trusts
- Tutorial
- Uncategorized
- UniCredit
- US
- US Dollar Index (DXY) (USDX)
- US$ Index
- US-Dollar Index
- US10yrYields
- USD
- USD/ARS
- USD/CNY
- USD/IDR
- USD/INR
- USD/MXN
- USD/SGD
- USD/THB
- USD/YEN
- USD/ZAR
- Vale
- Value Line Index
- video
- VIDEO OUTLOOK 2018
- VIDEO OUTLOOK 2020
- VIX
- W.D. Gann
- WaveTrack International
- XAU Gold/Silver Index
- Xetra Dax
- XOP
- Yields
- Zig Zag
- Zinc
- ‘INFLATION-POP’
- ‘SHOCK-POP-DROP’