Global Opportunities, US Risks and the Grand ‘Re-Synchronisation’
by WaveTrack International| August 17, 2017 | No Comments

Global Opportunities, US Risk – Global Outlook Report by Gail Fosler in collaboration with Peter Goodburn
Global Financial Opportunities, US Risks
Elliott Wave Indicators
It was in early-January 2010 that we caught the first glimpse of how the US asset price recovery was developing. Even if contrived by central bank intervention following the end of the financial-crisis just 9-months earlier. It became apparent as major US stock prices continued higher along with commodity prices that Elliott Wave ‘impulse’ patterns were emerging. This was confirming the continued upside progress which has lasted another 7-years to this day.
The definition of an uptrend, in layman terms, is a price chart which depicts the progress of higher-highs and higher-lows. In Elliott Wave Theory (EWT), this is somewhat more explicit. Elliott Wave defines an uptrend as a five wave pattern development, an ‘impulse’ pattern, 1-2-3-4-5 but with very specific parameters. Why does this provide such a huge advantage over other methods? Because it also adds price ‘dimension’ and often some degree of ‘timing’ in the assessment for completion. In this way, EWT is classified in scientific terms as a ‘deterministic’ or predictive system. As by the means of this ‘string’ of patterned price data it can be ‘nonlinearly’ extrapolated to project the future course of price activity.
The ‘Inflation-Pop’
Evidence of a five wave impulse pattern development from the financial-crisis lows of end-2008, early-2009 led to an amazing financial discovery. It projected a continuation of the asset price recovery to new record highs! Even though this event was many years into the future. The continuation of gains in Commodity prices and Emerging Markets was projected to new all-time-highs. Actually, several years into the end of the current decade and perhaps early into the next! This event is termed as the ‘INFLATION-POP’ because its specific Elliott Wave pattern development was identified as a three wave zig zag sequence – see fig #1. This meant it would ultimately test new record highs in a relatively short period of time prior to the asset bubble getting ‘popped’.
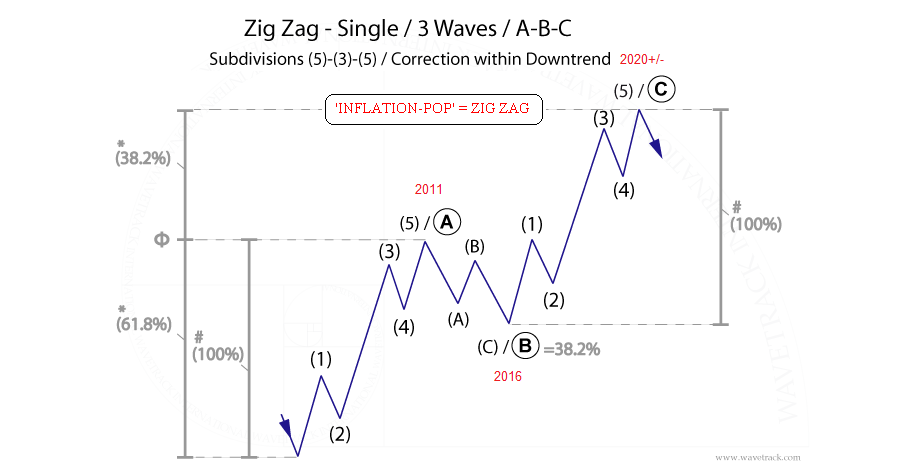
Zig Zag Single – Elliott Wave Pattern ©WaveSearch
Grand ‘Re-Synchronisation’
The fixed positive-correlation between US stock indices and commodities continued until late-2012 when peaks were broken above in the benchmark S&P 500 whilst commodities continued to trade lower. This dislocation ended in Jan/Feb.’16 when both asset classes formed major lows. Representing a corrective decline in the S&P 500 from the May ’15 high but a far larger corrective decline in commodities that began from the peaks of 2011. When these formed major lows together, we termed this event as the Grand ‘RE-SYNCHRONISATION’ process. It triggered a simultaneous ‘BUY’ signal for both asset classes but it also brought PATTERN RE-ALIGNMENT together. See fig #2.
SP500 | Hang Seng | MSCI Emerging Markets | Singapore Straits Times – Correlation Study by WaveTrack International
Since then, prices have surged higher as the next phase of the ‘inflation-pop’ gets underway. Price trends like this do not head directly higher in a straight-line. Instead, they are dynamic in their progress unfolding with alternating corrective declining sequences along the way. The Elliott Wave methodology is equipped to identify those occasions when pockets of corrective price declines are about to begin. But overall, the major uptrends are set to continue in the years ahead.
Gail Fosler Group LLC – Oil Prices, the US Dollar, and Emerging Markets
Much of our analysis has overlapped with the findings of one of our closest allies, the Gail Fosler Group LLC. Gail is a formidable economist, twice awarded the nomination of America’s most accurate economic forecaster by the Wall Street Journal. She is the former president and trustee of The Conference Board, and is a member of The Conference Board’s Global Advisory Council.
Gail’s team of economists have recently updated their outlook in their latest ‘Global Opportunities, US Risks’ report. An excerpt ‘Oil Prices, the US Dollar, and Emerging Markets‘ is posted on their website. You can read an extract in these links. The full report is available too – just contact Gail’s team.
You’ll be amazed at how one of America’s most acclaimed economists looks at the world’s financial developments and how it dovetails into our own ‘inflation-pop’ hypothesis.
Gail’s report is ‘Vitally Important for Traders in Securities, Commodities, Investors, Bankers, Business Managers (CEO’s) and Trusts’. And with recent geopolitical risks being heightened, I think we all agree how important it is to understand how the current financial landscape is unfolding.
Yours faithfully,
Peter Goodburn, CFTe, MSTA
Managing Director & Chief Elliott Wave Strategist
WaveTrack International
Comments
Leave a Reply

Recent Posts
Recent Comments
Archives
- June 2026
- February 2026
- December 2025
- August 2025
- July 2025
- June 2025
- March 2025
- February 2025
- January 2025
- December 2024
- August 2024
- July 2024
- June 2024
- May 2024
- April 2024
- February 2024
- January 2024
- December 2023
- August 2023
- July 2023
- June 2023
- March 2023
- February 2023
- January 2023
- December 2022
- November 2022
- October 2022
- August 2022
- July 2022
- June 2022
- May 2022
- March 2022
- February 2022
- January 2022
- December 2021
- August 2021
- July 2021
- June 2021
- March 2021
- February 2021
- January 2021
- December 2020
- November 2020
- August 2020
- July 2020
- June 2020
- May 2020
- April 2020
- March 2020
- February 2020
- January 2020
- December 2019
- October 2019
- September 2019
- July 2019
- June 2019
- May 2019
- April 2019
- March 2019
- February 2019
- January 2019
- December 2018
- November 2018
- September 2018
- August 2018
- July 2018
- June 2018
- May 2018
- April 2018
- March 2018
- February 2018
- January 2018
- December 2017
- November 2017
- October 2017
- September 2017
- August 2017
- July 2017
- June 2017
- May 2017
- March 2017
- February 2017
- January 2017
- December 2016
- November 2016
- October 2016
- September 2016
- August 2016
- July 2016
- June 2016
- May 2016
- April 2016
- March 2016
- February 2016
- January 2016
- December 2015
- November 2015
- October 2015
- September 2015
- August 2015
- July 2015
- June 2015
- May 2015
- April 2015
- March 2015
- February 2015
- January 2015
- December 2014
- November 2014
- October 2014
- September 2014
- August 2014
- July 2014
- June 2014
- May 2014
- April 2014
- March 2014
- February 2014
- January 2014
- December 2013
- November 2013
- October 2013
- September 2013
- August 2013
- July 2013
- June 2013
- May 2013
- April 2013
- March 2013
- February 2013
- January 2013
- December 2012
- November 2012
- October 2012
- September 2012
- August 2012
Categories
- ADXY Index
- Agnico Eagle Mines
- AI Artificial Intelligence
- Alcoa
- Amazon
- AngloGold Ashanti
- Antofagasta
- APPL
- Apple
- ASX 200
- AUD vs USD
- AUDNZD
- AUDUSD
- Australia ASX 200
- Baltic Dry Index
- Banking
- Base Metals
- Biotechnology
- Bitcoin
- Bovespa
- Broadcom
- Catalexit
- central banks
- Christmas
- Commodities
- Commodities Video Outlook 2020
- Conference
- Copper
- Coronavirus Sell-Off
- CRB
- Crude oil
- crude oil price chart
- CryptoCurrency
- Currencies
- Currencies + Interest Rates Video Outlook
- Cycles
- Dax 30
- deutsche bank
- Dewey Cycle
- DJ Transportation Average
- DJ Utilities
- Dow Jones 30
- Dow Theory
- ECB
- economy
- Elliott Wave
- Elliott Wave Charts
- Elliott Wave Patterns
- Elliott Wave Principle
- Emerging Markets
- Ending-Diagonal Elliott Wave Pattern
- Equity
- EUR vs CHF
- EUR/USD
- Euro / US$
- Eurostoxx 50
- EuroStoxx50
- EuroStoxxBanks
- EURUSD
- Expanding Flat Pattern
- FAAMG
- FANG+
- fib-price-ratio
- Fibonacci Trading
- Fibonacci-Price-Ratio
- Financial Forecasting
- Fixed Income
- forex
- Freeport McMoran
- FTSE 100
- Fund Management
- FX
- FXStreet
- GBP/AUD
- GBP/USD
- GDX
- GDXJ
- Germany 10 year Euro Bund future
- Gilead Sciences
- Glencore
- Global Economy
- Gold
- Gold Mining
- Golden Ratio
- goldman sachs
- Google Inc.
- Google/Alphabeth
- Greek debt crisis
- Hang Seng
- Harbinger
- Hungarian Forint
- IBEX 35 Index Spain
- Independent Research
- India-CNX Nifty 50
- Interest Rates
- Interview
- IRP Independent Research
- kbw bank index
- Lonmin
- MAG-7
- McDonald's
- MID-YEAR VIDEO UPDATE!
- Mifid II
- Mines
- Mining
- MSCI China
- MSCI Emerging Markets
- Nasdaq 100
- Nasdaq Biotechnology Index
- Nasdaq Composite
- Nasdaq100
- Netflix
- Newmont Mining
- Nikkei 225
- NVIDIA
- NYSE Composite Index
- Palladium
- Platinum
- Precious Metals
- Ralph Nelson Elliott
- Reversal-Signature
- Russell 2000
- Russia RTS
- S&P 500
- Sector
- Secular-Bull
- Sentiment Survey
- Shanghai Composite Index
- Silver
- Slanting Flat Elliott Wave Pattern
- SP100
- SP400 Mid-Cap
- SP500
- SPX 500
- STLG/AUD
- Stlg/US$
- STLG/USD
- STLG/YEN
- STLG/ZAR
- Stock Index
- Stock Index Tracking
- Stock Index Video
- Stock Indices
- Stock Indices Video Outlook 2023
- Stock Indices Video Outlook 2025
- Sugar
- Summary
- Tesla
- Tesla Inc
- Toyota
- Track Record
- trading
- Trusts
- Tutorial
- Uncategorized
- UniCredit
- US
- US Dollar Index (DXY) (USDX)
- US$ Index
- US-Dollar Index
- US10yrYields
- USD
- USD/ARS
- USD/CNY
- USD/IDR
- USD/INR
- USD/MXN
- USD/SGD
- USD/THB
- USD/YEN
- USD/ZAR
- Vale
- Value Line Index
- video
- VIDEO OUTLOOK 2018
- VIDEO OUTLOOK 2020
- VIX
- W.D. Gann
- WaveTrack International
- XAU Gold/Silver Index
- Xetra Dax
- XOP
- Yields
- Zig Zag
- Zinc
- ‘INFLATION-POP’
- ‘SHOCK-POP-DROP’