USD/JPY – Hits Corrective Downside Target within 3 Pips!
by WaveTrack International| March 2, 2017 | No Comments

US$/JPY – Hits USD/JPY – Corrective Downside Target within 3 Pips! – How was this Possible?
USD/JPY – FOREX SPOTLIGHT
How is this possible?
Click here to Watch WaveTrack’s latest FIBONACCI PRICE RATIO TUTORIAL
1) US$/JPY – Hits Corrective Downside Target within 3 Pips! – How was this Possible?
ANSWER – USD/JPY Fibonacci Perfection!
3 Wave Zig Zag 114.95-111.69 – Resumes Uptrend
Answer – Fibonacci USD/JPY – Perfection! 3 Wave Zig Zag 114.95-111.69 – Resumes Uptrend
Click here to Watch WaveTrack’s latest FIBONACCI PRICE RATIO TUTORIAL
Ensure you’re tracking our forecasts – subscribe online for the EW-COMPASS REPORT.
Visit us @ www.wavetrack.com
SP500 – Successful Cycle Forecasts
by WaveTrack International| February 21, 2017 | No Comments
SP500 – Cycle forecast and Result!
S&P 500 – Happy Anniversary
S&P 500 Forecast from last year’s reports! January/February 2016
This exact time last year, our analysis for the benchmark SP500 forecast January 2016 to begin with a significant decline that was due to extend a multi-month, double-digit percentage correction (that began from the May ’15 high). Our proprietary daily composite cycle seemed to confirm this indicating a sharp decline ahead, lasting throughout January and into an important low due in February ’16 – see fig #1.
As we now know, that proved correct with the S&P 500 declining from 2038.00 down to the Feb. 11th low at 1810.10. Soon afterwards, we issued a major buy signal dt. February 17th ’16 that forecast the beginning of a new uptrend that would ultimately break levels into new record highs – see fig #2.
S&P 500 – Forecast 2016 and Result Now!
Original upside targets for intermediate wave (3) were towards 2239.02+/- but basis EW-Pattern development, current upside targets are much higher now!
The composite cycle looked like this last November (2016) ahead of the U.S. Presidential election – see fig #3. It successfully indicated the S&P 500 was again forming the completion of a corrective decline with trend preparing to resume its upward trend again.
SP500 – Composite Cycle in November 2016 ahead fo Trump Election Win!
Composite Cycle Update for the SP500 to be published in the EW-Compass Report – late Feb./early March 2017
We’ll be updating this composite cycle in this week’s report as we expect more important changes coming through into late-February/early March!
In the meantime, watch/listen to Peter Goodburn’s forecasts from this period last year. In his interview with Dale J. Pinkert of FXStreet.com, Peter expands on his forecasts for the S&P 500 approaching a major low plus some other insights on currencies and commodities.
FX STREET INTERVIEW – with Dale Pinkert – 14th January 2016
Ensure you’re tracking our forecasts – subscribe online or contact our ‘help-desk’ located at the top of wavetrack.com for institutional products and services.
Visit us @ www.wavetrack.com
S&P500 – Don’t Get Distracted! Uptrend Intact!
by WaveTrack International| January 26, 2017 | No Comments
Elliott Wave Confirms Continued Gains
S&P500 – Forecast 4th January – RESULT! 25th January 2017
Don’t Get Distracted! Uptrend Intact!
Despite negative press over the weekend with commentators and analysts warning the ‘Trump-trade’ had ended with stock markets heading for sizable declines, Elliott Wave analysis has again cut through the preconception ‘noise’ with a very bullish ‘call’ earlier this month.
December’s decline was always expected to unfold as a ‘counter-trend’ sequence within the more dominant uptrend as the S&P500 proved when the sell-off unfolded into a double zig zag pattern ending year-end at 2228.00 (futures). Yesterday’s activity (Tuesday Jan.24th) confirmed the prevailing uptrend with a break into new record highs.
We expect much more from this in the weeks ahead!
MORE ELLIOTT WAVE INSIGHTS – to STOCK INDICES, COMMODITIES and CURRENCIES are published in WaveTrack’s latest VIDEO SERIES
CONTACT US NOW VIA EMAIL – SELECT YOUR PACKAGE
Single Video – $48.00 – PART III CURRENCIES (FX) with 52 charts (1 hour 50 mins)(Jan. ’17)
Triple Package offer – $96.00 (saving 33%)! – PART I – PART II – PART III (Dec. ’16 – Feb. ’17)
HOW CAN YOU RECEIVE THE VIDEO FORECAST?
To receive your STOCK INDICES VIDEO UPDATE please click here to contact us. more information here
– Please state if you wish to purchase the SINGLE VIDEO for COMMODITIES for USD 48.00 (67 charts)? more information here
– Single Video – $48.00 – PART III CURRENCIES (FX) with 52 charts (1 hour 50 mins)(Jan. ’17)
– Or opt for the www.wavetrack.com
Currencies (FX) and Interest Rates Video Update!
by WaveTrack International| January 25, 2017 | No Comments
Currencies (FX) ‘8-YEAR US$ DOLLAR CYLCLE’ 2017
‘8-YEAR US$ DOLLAR CYLCLE’ completion in 2017!
During the last year, we’ve highlighted the fact that a 15.6-year US$ dollar cycle is approaching completion. Cycles measure peak-to-peak, trough-to-trough with the mid-point creating a 7.8-year trough-to-peak rise for the dollar since early-2008. This next major cycle-peak is a little overdue, but one thing is clear, it’s closing in on completion right now!
Elliott Wave analysis of this 8-year dollar upswing is confirming the advance as ending a counter-trend pattern. Furthermore, the typical Fibonacci-Price-Ratio measurements for this corrective pattern fit perfectly into the current price levels. Together, these three aspects offer a compelling case for the US$ dollar’s reversal anytime into Q1’17.
Over the last few years, upside targets to complete the dollar’s counter-trend advance haven’t changed at all, and looking that far ahead, we often wondered what catalyst or trigger would eventually turn the tide. Now we know! – U.S. President D. Trump is manoeuvring to reverse the previous administration’s strong dollar policy.
This came as quite a surprise for mainstream investment bank economists. Their 2017 annual forecasts had already opined a strong US$ dollar outlook for most of the year and even beyond on the premise that inflation was returning and this would propel U.S. interest rates higher. Even Federal Reserve Chairwoman Janet Yellen is hinting about incremental Fed Funds increases this year, so why not (linearly) extrapolate a stronger U.S. dollar?
The problem comes if Trump manages to reverse the dollar policy because analysts place the dollar and interest rates into a positive correlation. But the market often forgets history! In the early-1970’s, the de-pegging of the US$/gold relationship brought an end to the Bretton woods currency (fix) system and with it, a declining US$ dollar over the next decade whilst interest rates ran exponentially higher. That same era or cycle is about to emerge again, as illustrated from analysing both the US$ dollar and U.S. interest rates in this latest Elliott Wave & Cycle analysis.
This latest installment of WaveTrack International’s three part VIDEO SERIES takes an in-depth look at how these Elliott Wave patterns and cycles translate across most of the major currencies & interest rates of the world – PART III, CURRENCIES & INTEREST RATES – 2017 & BEYOND.
Our latest Video/Report analyses over 52 charts and cycles highlighting major trends, reversal levels together with Fibonacci-Price-Ratio projection levels of the major currency pairs/crosses and interest rates of the U.S., Europe and Japan. Don’t hesitate – this is the most thoroughly researched, accurate ELLIOTT WAVE ANALYSIS on the planet. We’ll be taking a look at currency trends over a 50+ year period and projecting these trends into the future – and if you want to see what U.S. interest rates look like over a period of 250+ years, then this latest ANNUAL 2017 ELLIOTT WAVE PRICE-FORECASTS & CYCLE PROJECTIONS will tell you.
• US$ index
• Euro/US$
• Stlg/US$
• US$/Yen
• US$/CHF
• AUD/US$
• US$/CAD
• Euro/Stlg
• Euro/Yen
• Asian ADXY
• US$/IDR
• US$/ZAR
• US$/BRL
• US$/RUB
• US$/CNY
• U.S. AAA+ Corporate Bond Yield
• US 30yr Yield
• US 10yr Yield
• US 10yr TIPS Break Even Inflation Rate
• DE 10yr Yield
• JPY 10yr Yield
CONTACT US NOW VIA EMAIL – SELECT YOUR PACKAGE
Single Video – $48.00 – PART III CURRENCIES (FX) with 52 charts (1 hour 50 mins)(Jan. ’17)
Triple Package offer – $96.00 (saving 33%)! – PART I – PART II – PART III (Dec. ’16 – Feb. ’17)
HOW CAN YOU RECEIVE THE VIDEO FORECAST?
To receive your STOCK INDICES VIDEO UPDATE please click here to contact us. more information here
– Please state if you wish to purchase the SINGLE VIDEO for COMMODITIES for USD 48.00 (67 charts)? more information here
– Single Video – $48.00 – PART III CURRENCIES (FX) with 52 charts (1 hour 50 mins)(Jan. ’17)
– Or opt for the www.wavetrack.com
Tags: USD/BRL > USD/RUB
Dow Jones Completes Correction
by WaveTrack International| January 20, 2017 | No Comments
Stock Market Bullish Ahead of Trump’s Presidential Inauguration
The Dow Jones’ short-term corrective decline that began from December’s high of 19911 (futures) originally unfolded into an expanding flat pattern, ending at 19661 (see previous reports). This has now extended into the next support level measured to 19606+/- prolonging the pattern into a ‘double-three’, i.e. expanding flat-x-zig zag ending into yesterday’s session at 19607 – just 1 point from the fib-price-ratio level.
Dow Jones – 13th January Forecast and 20th January 2017
The Dow Jones is now expected to resume its larger uptrend ahead of D. Trump’s Presidential Inauguration scheduled later today. This is also bullish for all other indices.
More on this subject in tonight’s Market Report.
HOW CAN YOU SUBSCRIBE TO WAVETRACK’s LATEST REPORT?
HOW CAN YOU RECEIVE THE VIDEO FORECAST?
To receive your VIDEO UPDATE please click here to contact us.
– Please state if you wish to purchase the SINGLE VIDEO for COMMODITIES for USD 48.00 (67 charts)?
– Or opt for the www.wavetrack.com
COMMODITIES VIDEO – 2nd Phase of the ‘INFLATION-POP’ Gets Underway!
by WaveTrack International| January 4, 2017 | No Comments

COMMODITIES 2017! Re-flation on the way
Earlier last year, Developed Market (DM) stock indices, key benchmarks like the S&P and the Eurostoxx 50 hit important lows, ending a 9-month corrective sell-off that began from the May ’15 highs into February ’16 lows. This was the largest decline in over 4 years and comparable to the year-2011 correction. But this event also marked the end of 5-year counter-trend declines in Emerging Markets (EM) and Commodities. This formed an important convergence because the performance of EM’s and Commodities had been divergent over the past five years – now they have aligned again in what we described at the time as the ‘RE-SYNCHRONISATION’ process. The S&P has since traded into new record highs whilst EM’s have undergone a renaissance with huge outperformance as it resumes a new uptrend. Commodities have also staged a similar turn-around which is set to continue in the years ahead.
This re-synchronisation process was forecast as a future event back in December ’14 in WaveTrack International’s 2015 annual forecasts. It hinted that when these divergent trends would realign, it would signal the emergence of the 2nd Phase of the ‘INFLATION-POP’. The inflation-pop was a term we used to describe how many asset classes were undergoing inflationary impulses induced by Central Banks monetary easing policies that were implemented after the financial-crisis. The 1st phase of the inflation-pop’ ended in year-2011 when EM’s and Commodities formed their peaks. Now that corrective declines ended in January/February ’16, the 2nd Phase is deemed already underway.
The latest video series describes how this 2nd phase will translate into COMMODITIES, the duration and their extent/amplitude, for 2017 and beyond. Part II (fig’s #39-106) features a total of 67 charts, our largest assemblage ever with many more time-series and alternate counts in addition!
The COMMODITIES list includes medium/long-term Elliott Wave analysis for the following:
1 hour 50 mins long video of indepth Elliott Wave commentary featuring over 67 charts with Fib-Price-Ratios, Cycle projections, Correlation Studies and so much more! This is WaveTrack’s state of the art bi-annual video series which according to our clients is a ‘must have’!
Correlation analysis, highlighting Commodity 2nd Phase of the ‘INFLATION-POP’ Gets Underway!
CONTACT US NOW VIA EMAIL – SELECT YOUR PACKAGE
Single Video – $48.00 – PART I STOCK INDICES (Dec. ’16)
Triple Package offer – $96.00 (saving 33%)! – PART I – PART II – PART III (Dec. ’16 – Feb. ’17)
PARTS II & III will be available in a few weeks’ time (2017!) – we’re working on it!
HOW CAN YOU RECEIVE THE VIDEO FORECAST?
To receive your VIDEO UPDATE please click here to contact us.
– Please state if you wish to purchase the SINGLE VIDEO for COMMODITIES for USD 48.00 (67 charts)?
– Or opt for the www.wavetrack.com
Tags: Newmont Mining > Zinc
STOCK INDICES VIDEO – 2nd Phase of the ‘INFLATION-POP’ Gets Underway!
by WaveTrack International| December 22, 2016 | No Comments
Elliott Wave Price Forecasts & Cycle Projections for 2017
2nd Phase of the ‘INFLATION-POP’ Gets Underway!
We’re pleased to announce the publication of WaveTrack’s 2017 video update of medium-term forecasts for STOCK INDICES!
Since the inaugural edition of the EW-Compass report, you’ve asked for accompanying medium/long-term analysis in gaining a broader perceptive of Elliott Wave pattern development for many of the world’s major indices. So we’ve taken many charts from our institutional Elliott Wave Forecast database and compiled them into a video series, publishing them twice yearly, each December/January, June/July.
As the demand for more indices grew, so did our task in maintaining them to a sufficient standard – no problem! So now, we’ve set aside sufficient resources to ensure the medium/long-term outlooks are sent to you at key marker dates during the year.
There are over 120 charts being maintained round the clock so it’s necessary to split the videos into THREE parts – Part I STOCK INDICES, PART II COMMODITIES & PART III CURRENCIES & INTEREST RATES.
PART I Stock Indices VIDEO is available NOW!
This latest update of U.S., European and Global/Emerging market indices covers 38 newly illustrated Elliott Wave forecasts of the medium and long-term time-series. Our chief Elliott Wave analyst and Founder of WaveTrack International, Peter Goodburn is again your host. Once again, he talks us through all of the main themes and up-coming changes that are apparent within the pattern development of the major markets. He also illustrates some of the major cycles for the benchmark S&P 500 index, expounding his articulate knowledge of cyclicity obtained from his 25-year study of luminaries such as Edward Dewey and W.D. Gann.
The stock index list includes medium/long-term Elliott Wave analysis for the following:
Peter’s work is absolutely unique – you’ll be taking a look at Elliott Wave counts never seen anywhere else – GUARENTEED!
His 25-years of ground-breaking research into the seamless adherence of pattern development unfolding within specific geometric, Fibonacci dimensions provides the foundation for all the Elliott Wave forecasts shown in this video. This has enabled Peter to identify major directional changes ahead of time over the last sixteen years – for example:
• Identified a major top in the Dow Jones (DJIA) in March 2000
• Forecast the exact low in the Dow Jones in Oct.’02
• Forecast the Dow Jones’ high in Oct.’07 3-years ahead of time
• Identified the Dow/S&P’s price low ahead of March ‘09
• Forecast the S&P’s decline in year-2011 to exact levels in October’s low
• Described + published the Secular-Bull uptrend in 2010-2011 into record highs
In last December’s Stock Index update, Peter described how major indices were trending lower but with the S&P’s cycle analysis signalling a major low in late-January/February – see this cycle analysis below…

S&P 500 – Weekly -Composite Cycle
…and how the KBW Banking Index was finalising a major low before resuming its medium-term uptrend…
WaveTrack’s KBW Banking Index Forecast – Weekly
These were just two hints that markets were going to get off to a shaky start, but then turn around to resume larger uptrends!
Get Up-to-date on the next 6-month outlook – & beyond!
As an Elliott Wave Compass subscriber, we’ve ensured you have access to this Institutional–grade analysis at very modest expense.
PART I Stock Indices VIDEO is available now, at only $48.00!
We’ll send you a personal link so that you can watch the video, anytime at your convenience.
And if you’d like to subscribe to the up-coming COMMODITIES & CURRENCIES videos in PART II & PART III, you can receive ALL THREE for $96.00! – that’s a saving of 33% per cent!
• Single Video – $48.00
• Triple Package offer – $96.00 (saving 33%)!
If you saw the EW forecasts for the COMMODITIES Video published in January’s 2016 PART II update, you’d find that downside targets were successfully achieved!…here’s an extract:

Commodities – Newmont Mining – Weekly
Since then, Newmont Mining has traded higher by an amazing +200% per cent!
And if you followed the CURRENCY video in combination with the Emerging Market and Commodity outlooks, you would have been fully prepared for a big change in the US$ dollar, and related EM/Commodity Currencies, like the Canadian Dollar:

Currencies – USD vs. CAD – Weekly
CONTACT US NOW VIA EMAIL – SELECT YOUR PACKAGE
Single Video – $48.00 – PART I STOCK INDICES (Dec. ’16)
Triple Package offer – $96.00 (saving 33%)! – PART I – PART II – PART III (Dec. ’16 – Feb. ’17)
PARTS II & III will be available in a few weeks’ time (2017!) – we’re working on it!
HOW CAN YOU RECEIVE THE VIDEO FORECAST?
To receive your VIDEO UPDATE please click here to contact us.
– Please state if you wish to purchase the SINGLE VIDEO for STOCK INDICES for USD 48.00?
– Or opt for the TRIPLE PACKAGE for USD 96.00 in total?
– Next we will send you a PayPal payment request and provide you with the video link & PDF report once confirmed.
We’re sure you’ll reap the benefits – don’t forget to contact us with any Elliott Wave questions – Peter is always keen to hear you views, queries and comments.
Most sincerely,
WaveTrack’s Elliott Wave Team
Visit us @ www.wavetrack.com
GOOGLE – Fib-Price-Ratio Study
by WaveTrack International| December 7, 2016 | 2 Comments
Check this Out! – Fib-Price-Ratio Study Pinpoints Google low at 727.54
Fibonacci-Price-Ratios (FPR’s) form an integral part of the Elliott Wave process of identifying reversals in major markets. Over the last twenty years, we’ve catalogued and archive several hundred examples of how fib-price-ratios can be used in a systematic way to identify a pattern’s completion and a subsequent change of direction/trend.
Each of R.N. Elliott’s 13 patterns have a short-list of accompanying fib-price-ratios that recur with high frequency. This means applying those fib-price-ratios that are specific to the pattern that is evolving. Using this standard approach requires discipline but it’s definitely worth the effort in learning them.
In this example, we can see that Google Inc. declined from its October 25th high of 816.68 into a simple corrective pattern, specifically, a three wave/price-swing zig zag that subdivides 5-3-5 – see fig #1. Once wave [a] of the zig zag has completed, in this case at 750.56, the standard approach is to extend wave [a] by a fib. 38.2% and 61.8% ratio. The former projects wave [c] declines to 726.74 and the latter to 712.40. Once wave [b] ends its counter-trend correction, in this case to 795.63, one additional fib-price-ratio measurement can be applied – this one, I’m sure you’re familiar with already – using a fib. 100% correlation ratio, measuring the equal length/amplitude of waves [a] and [c] – that would project a terminal low for wave [c] towards 731.21.
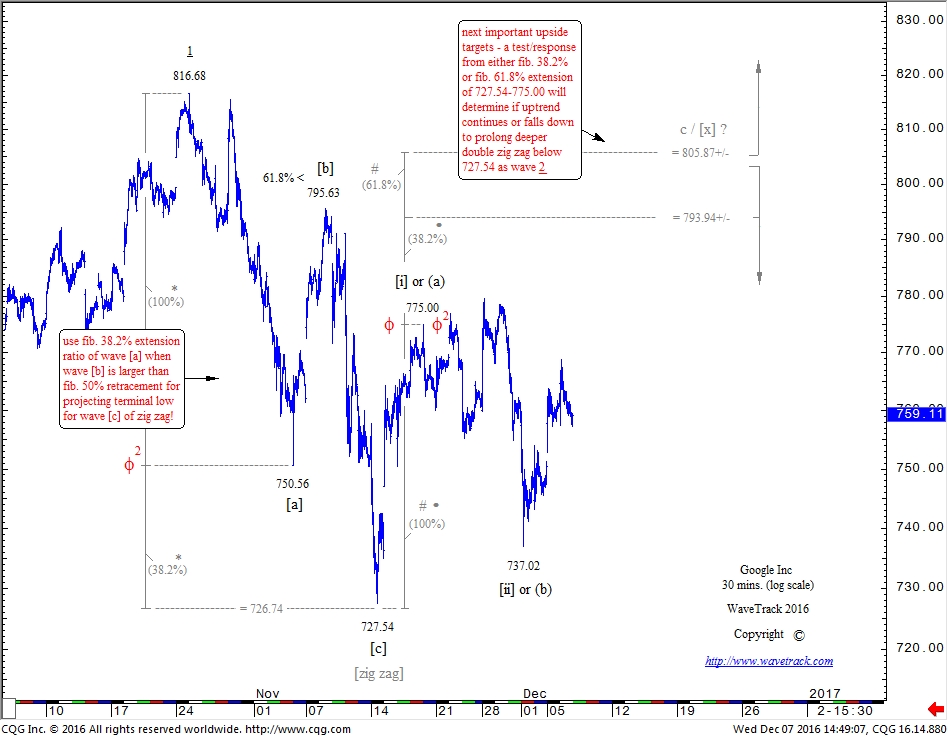
Google Inc. – 30 mins chart
But one subtle observation also comes through in the analysis of this zig zag decline – wave [b] was quite a deep retracement, slightly more than a fib. 61.8% ratio. That’s important because when ‘B’ waves extend beyond the fib. 50% retracement level, there is a greater statistical probability that wave [c] declines will halt at the fib. 38.2% extension level of wave [a]. And in Google Inc.’s case, it did, wave [c]’s decline ended right into the fib. 38.2% extension target zone, with an actual low formed at 727.54 – not bad!
Looking ahead, we can apply the same FPR guideline to the following advance from 727.54. The next high unfolded into a typical five wave expanding-impulse pattern, ending at 775.00 on November 18th. This means upside continuity into the future. If we don’t know what the larger Elliott Wave pattern is, then this advance can be either the beginning of a new five wave uptrend or another zig zag, this time, wave [x] within the continuation of a double zig zag decline from 816.68 as minute wave 2. Either way, an upside attempt is consistent for both wave counts/scenarios. And so, extending the initial five wave upswing from 727.54-775.00 by a fib. 38.2% and fib. 61.8% ratio projects two upside objectives to either 793.94+/- or 805.87+/-. These are, of course, minimum upside targets based in the assumption the entire advance from 727.54 is a zig zag pattern, labelled wave [x]. When prices test either of these levels, we’ll check on whether a five wave subdivision is evident in this next advance from 737.02 – if it does subdivide into a five wave pattern then stages price-rejection, we’ll know that it is ending wave [x] and that prices will then begin a secondary zig zag decline that ultimately trades below 727.54.
But should the price action thrust above these levels, it would otherwise indicate Google Inc. has resumed its much larger/aggregate uptrend as minute wave 3.
Get access to WaveTrack’s bi-weekly Elliott Wave Compass report featuring many short-term updates of all 4 asset classes!
Successful trading with WaveTrack International
Subscribe to the EW-Compass here…
GOLD – Sentiment Extremes
by WaveTrack International| December 1, 2016 | No Comments
If you’re feeling Bearish – Stop it now! Break bad habits

Isn’t it amazing to see how extremes in price activity ultimately expose the fragility of the human condition? The markets are a terrific teacher in training us to master ourselves, in an effort to conquer our whims and emotions that flood through the veins during times of price excess. There are degrees of excess which of course, translates itself into the fractal model of the Elliott Wave Principle. Major peaks like the dot.com highs of year 2000 or the sub-prime peak of 2007 are naturally exposing euphoric sentiment at much higher levels than say intermediate highs traded in 2011. Likewise, major lows are similarly graded, although we rely on sentiment models to help determine each rating.
Gold Forecast – 19th Jul 2016 – Result! 1st December 2016
It’s an ongoing, life-time process of self-development with the goal of withdrawing oneself from the capture of the herd instinct – trading in the crowd, which ordinarily turns bullish at highs and bearish at lows. It’s a difficult process to master – to sell when the herd is buying or is bullish, and to buy when the herd is selling or bearish. But once practised, amazing revelations are there for each of us to grasp onto. For example, the herd was bullish into gold and silver’s highs of last July/August even though this proved to be an important peak. Our Elliott Wave report at the time turned bearish because of two factors – Elliott Wave analysis and the bullish sentiment extremes of the Commitment of Traders (COT) reports. And so it comes as no surprise to read that some analysts, commentators are suddenly questioning gold and silver’s uptrends established earlier this year, just because prices are now considerably lower than they were 3-4 months ago.
The renowned gold bullion dealers Sharps Pixley (SP) are obviously not immune to the trials of self-development as they lead an article published Wednesday November 30th entitled ‘Gold’s 2016 Rally Was Built On Sand’. It states that physical precious metal demand was lacking in this year’s run higher, exposing the trends weakness. Oh, we lament! If this was really a concern, why not publish these facts at the peak in July/August – why wait ‘till now? Of course, we know why. Analysts are beginning to think about annual 2017 forecasts – some have already penned opinions that a rising US$ dollar and higher interest rates will keep precious metals from trending higher. We’ve seen a few reports already taking this line of thought so SP is not alone. But to the trained nose and with a little help from EW and sentiment statistics, an important low in gold and silver is not too far off.
Get access to WaveTrack’s bi-weekly Elliott Wave Compass report featuring many short-term updates of all 4 asset classes!
Successful trading with WaveTrack International
Subscribe to the EW-Compass here…
Biotechnology (NBI) Fades After Trump-Jump
by WaveTrack International| November 23, 2016 | No Comments
NASDAQ Biotechnology Index – 30 mins.
NBI Fades After Trump-Jump | Biotechnology Index (NBI)
The Biotechnology Index (NBI) jumped higher following the Trump election win – this was no great surprise from an Elliott Wave perspective because prior to the voting, the NBI had already begun a counter-trend rally in response to the completion of a preceding five wave impulse decline that began from 3154.36. The only deviation from original forecasts higher towards 61.8% resistance at 2923.00+/- was the depth of the rally. But given the market’s unexpected response, it’s not unusual to see targets being extended in a moment of emotive short-covering.
The index has since traded up to 3075.45 – that’s almost a fib. 85.4% retracement of the 1st wave decline, about maximum for a deep 2nd wave retracement. As other major indices stretch to new higher-highs, the NBI is already waning, gradually working its way lower as if to begin its 3rd wave decline. Basis the preceding five wave pattern unfolding within the decline from September’s high of 3154.36 into the early-November low at 2582.20, it should be impossible for the index to trade any higher, and definitely not break above 3154.36. Could it be that this index is providing a pre-cursor look at an imminent downtrend getting underway for the broader market?
Get access to WaveTrack’s bi-weekly Elliott Wave Compass report featuring many short-term updates of all 4 asset classes!
Successful trading with WaveTrack International
Subscribe to the EW-Compass here…

Recent Posts
Recent Comments
Archives
- February 2026
- December 2025
- August 2025
- July 2025
- June 2025
- March 2025
- February 2025
- January 2025
- December 2024
- August 2024
- July 2024
- June 2024
- May 2024
- April 2024
- February 2024
- January 2024
- December 2023
- August 2023
- July 2023
- June 2023
- March 2023
- February 2023
- January 2023
- December 2022
- November 2022
- October 2022
- August 2022
- July 2022
- June 2022
- May 2022
- March 2022
- February 2022
- January 2022
- December 2021
- August 2021
- July 2021
- June 2021
- March 2021
- February 2021
- January 2021
- December 2020
- November 2020
- August 2020
- July 2020
- June 2020
- May 2020
- April 2020
- March 2020
- February 2020
- January 2020
- December 2019
- October 2019
- September 2019
- July 2019
- June 2019
- May 2019
- April 2019
- March 2019
- February 2019
- January 2019
- December 2018
- November 2018
- September 2018
- August 2018
- July 2018
- June 2018
- May 2018
- April 2018
- March 2018
- February 2018
- January 2018
- December 2017
- November 2017
- October 2017
- September 2017
- August 2017
- July 2017
- June 2017
- May 2017
- March 2017
- February 2017
- January 2017
- December 2016
- November 2016
- October 2016
- September 2016
- August 2016
- July 2016
- June 2016
- May 2016
- April 2016
- March 2016
- February 2016
- January 2016
- December 2015
- November 2015
- October 2015
- September 2015
- August 2015
- July 2015
- June 2015
- May 2015
- April 2015
- March 2015
- February 2015
- January 2015
- December 2014
- November 2014
- October 2014
- September 2014
- August 2014
- July 2014
- June 2014
- May 2014
- April 2014
- March 2014
- February 2014
- January 2014
- December 2013
- November 2013
- October 2013
- September 2013
- August 2013
- July 2013
- June 2013
- May 2013
- April 2013
- March 2013
- February 2013
- January 2013
- December 2012
- November 2012
- October 2012
- September 2012
- August 2012
Categories
- ADXY Index
- Agnico Eagle Mines
- AI Artificial Intelligence
- Alcoa
- Amazon
- AngloGold Ashanti
- Antofagasta
- APPL
- Apple
- ASX 200
- AUD vs USD
- AUDNZD
- AUDUSD
- Australia ASX 200
- Baltic Dry Index
- Banking
- Base Metals
- Biotechnology
- Bitcoin
- Bovespa
- Broadcom
- Catalexit
- central banks
- Christmas
- Commodities
- Commodities Video Outlook 2020
- Conference
- Copper
- Coronavirus Sell-Off
- CRB
- Crude oil
- crude oil price chart
- CryptoCurrency
- Currencies
- Currencies + Interest Rates Video Outlook
- Cycles
- Dax 30
- deutsche bank
- Dewey Cycle
- DJ Transportation Average
- DJ Utilities
- Dow Jones 30
- Dow Theory
- ECB
- economy
- Elliott Wave
- Elliott Wave Charts
- Elliott Wave Patterns
- Elliott Wave Principle
- Emerging Markets
- Ending-Diagonal Elliott Wave Pattern
- Equity
- EUR vs CHF
- EUR/USD
- Euro / US$
- Eurostoxx 50
- EuroStoxx50
- EuroStoxxBanks
- EURUSD
- Expanding Flat Pattern
- FAAMG
- FANG+
- fib-price-ratio
- Fibonacci Trading
- Fibonacci-Price-Ratio
- Financial Forecasting
- Fixed Income
- forex
- Freeport McMoran
- FTSE 100
- Fund Management
- FX
- FXStreet
- GBP/AUD
- GBP/USD
- GDX
- GDXJ
- Germany 10 year Euro Bund future
- Gilead Sciences
- Glencore
- Global Economy
- Gold
- Gold Mining
- Golden Ratio
- goldman sachs
- Google Inc.
- Google/Alphabeth
- Greek debt crisis
- Hang Seng
- Harbinger
- Hungarian Forint
- IBEX 35 Index Spain
- Independent Research
- India-CNX Nifty 50
- Interest Rates
- Interview
- IRP Independent Research
- kbw bank index
- Lonmin
- MAG-7
- McDonald's
- MID-YEAR VIDEO UPDATE!
- Mifid II
- Mines
- Mining
- MSCI China
- MSCI Emerging Markets
- Nasdaq 100
- Nasdaq Biotechnology Index
- Nasdaq Composite
- Nasdaq100
- Netflix
- Newmont Mining
- Nikkei 225
- NVIDIA
- NYSE Composite Index
- Palladium
- Platinum
- Precious Metals
- Ralph Nelson Elliott
- Reversal-Signature
- Russell 2000
- Russia RTS
- S&P 500
- Sector
- Secular-Bull
- Sentiment Survey
- Shanghai Composite Index
- Silver
- Slanting Flat Elliott Wave Pattern
- SP100
- SP400 Mid-Cap
- SP500
- SPX 500
- STLG/AUD
- Stlg/US$
- STLG/USD
- STLG/YEN
- STLG/ZAR
- Stock Index
- Stock Index Tracking
- Stock Index Video
- Stock Indices
- Stock Indices Video Outlook 2023
- Stock Indices Video Outlook 2025
- Sugar
- Summary
- Tesla
- Tesla Inc
- Toyota
- Track Record
- trading
- Trusts
- Tutorial
- Uncategorized
- UniCredit
- US
- US Dollar Index (DXY) (USDX)
- US$ Index
- US-Dollar Index
- US10yrYields
- USD
- USD/ARS
- USD/CNY
- USD/IDR
- USD/INR
- USD/MXN
- USD/SGD
- USD/THB
- USD/YEN
- USD/ZAR
- Vale
- Value Line Index
- video
- VIDEO OUTLOOK 2018
- VIDEO OUTLOOK 2020
- VIX
- W.D. Gann
- WaveTrack International
- XAU Gold/Silver Index
- Xetra Dax
- XOP
- Yields
- Zig Zag
- Zinc
- ‘INFLATION-POP’
- ‘SHOCK-POP-DROP’