BITCOIN – CORRECTION ONLY! UPTREND INTACT!
by WaveTrack International| January 4, 2018 | No Comments
Back in September of last year, the Bitcoin frenzy was beginning to pick up. For the first time, going mainstream with pundits forecasting a bubble. That was when the price had just hit 4920.00. It subsequently declined to 2991.00 then traded to almost 20000.00 last December, a gain from that low of +560% per cent.
There was no bubble, so what are those pundits saying now? Well, as you can imagine, silence has fallen. Some big changes have occurred since too. Bitcoin futures is now trading on the CME exchange which allows short-sellers to play the game which means the pro’s have arrived on the scene. Large hedge funds are recording an interest and have begun to trade in these new contracts.
But what about the expected price moves? Last September’s report [extract here] confronted the bubble calls, explicitly affirming there was no bubble. WaveTrack forecasted the decline as simply a counter-trend correction. That proved correct. The fact that September’s decline unfolded into a typical Elliott Wave double zig zag correction, then traded to new higher-highs validated the ongoing pattern sequence of its price development. That pattern sequence is still continuing to this day.
Bitcoin – What Next?
Bitcoin’s decline from December’s high of 19739.85 (CME Bitcoin) 19891.00 (Bitcoin.com) is unfolding into another almost identical double zig zag pattern. Except this one is of larger degree than September’s, labelled in minuette degree, [a]-[b]-[c]-[x]-[a]-[b]-[c] – see fig #1.
Bitcoin – 60 mins. – Elliott Wave Forecast by WaveTrack International
The first zig zag ended at 10913.57 on December 22nd, 2017. Its corrective rally since taking the form of a contracting/symmetrical triangle pattern as wave [x]. This is composed of five price-swings, three of which have already completed. And a fourth and fifth are now in progress with an estimated completion towards 14655.00+/-.
We have a trading rule for triangles, which is to always trade the price-extreme of wave ‘C’ because waves ‘D’ and ‘E’ can sometimes fail to emerge. Waiting to trade the completion of wave ‘E’ that never develops can result in missing the strategic trade. If shorting bitcoin is the strategy objective, then this should be done now with stops above wave (a)’s high of 16476.17.
The secondary zig zag is targeting down to two levels, at 8700.00+/- and 7570.00+/-. The 8700.00+/- area is derived by extending the first zig zag to 10913.57 by a fib. 38.2% ratio, the 7570.00+/- area by a fib. 61.8% ratio – probability leans more towards the attempt to 7570.00+/-. If so, then wave [a] of the secondary zig zag is approximated towards 9725.00+/- which creates a ‘golden-section’ 61.8% cut of the entire decline.
Bitcoin – Looking Further Ahead
The short-term triangle pattern is very informative in forecasting the future of Bitcoin’s price development. Because triangles cannot occur within five wave impulse patterns, this would eliminate the concept of December’s decline unfolding into a five wave sequence which would signal a more prolonged downtrend. Rather, it confirms December’s decline is simply another counter-trend sequence within the dominant, prevailing uptrend.
In this next chart, we depict the Elliott Wave pattern development from the August ’15 low of 192.00 – see fig #2. What this chart tells us is that minute wave 3’s advance which began a little later, from the Feb.’16 low of 360.00 ended into the December ’17 high at 19891.00. Both pattern structure and especially, our proprietary Fib-Price-Ratios confirm this as follows: minute wave 3 subdivides into a five wave impulse labelled in minuette degree, [i]-[ii]-[iii]-[iv]-[v] – extending from 360.00 (origin of wave [i]) to the point that ends ‘price-expansion, i.e. the end of the 3rd-of-3rd-of-3rd wave sequence projects the terminal high for wave [v] into December’s high.
Bitcoin – Daily – Elliott Wave Forecast by WaveTrack International
A proportional correction of this sequence has since begun, labelled minute wave 4. A fib. 23.6% retracement would pull prices down towards the 7700.00+/- area. This converges with the short-term downside targets towards 7570.00+/- shown earlier.
Conclusion
Once Bitcoin tests these two downside convergence levels between 7700.00+/- and 7570.00+/-, we’ll check the pattern structure to ensure synchronous completion. If all goes to plan, a new ‘buy’ signal will be triggered. That would translate into higher-highs in the months ahead – and another phenomenal return on investment!
Are you trading CryptoCurrencies? Contact us if you would like to see regular updates on Bitcoins? If there is enough interest we are considering to add Bitcoins to our bi-weekly report and/or make it available through WaveTrack’s ‘on-demand‘ service. Leave your comments below or contact us!
Visit us @ www.wavetrack.com and subsribe to our latest EW-COMPASS report!
Stock Index Video Outlook 2018
by WaveTrack International| December 29, 2017 | 9 Comments

STOCK INDEX VIDEO OUTLOOK 2018
Valuations High – But Secular-Bull Uptrend Intact!
INCLUDES NEW SENTIMENT & ECONOMIC INDICATOR STUDIES
Stock index uptrends are almost 2-year’s old as measured from their grand ‘RE-SYNCHRONISATION’ lows of Jan/Feb.’16. This re-synchronisation process was forecast as a future event back in December ’14 in WaveTrack International’s 2015 annual forecasts. It hinted that when the 5-year divergent trends of Developed/Emerging Markets/Commodities would realign. This would signal the emergence of the 2nd Phase of the ‘INFLATION-POP’. The inflation-pop was a term we used to describe how several asset classes were undergoing inflationary impulses induced by Central Banks monetary easing policies implemented after the financial-crisis.
So far, this 2nd phase of price advances has seen the benchmark S&P contract up by +48% per cent, the Eurostoxx 50 +38% per cent, the MSCI Emerging Market index +69% per cent and the CRB-Cash commodity index +24% per cent although it has given some of that back since. But can these gains be sustained for another year, into 2018?
Valuations High – But Secular-Bull Uptrend Intact!
Much has been spoken about stock market valuation models during 2017! And how they have unanimously highlighted overvaluations signalling an imminent end to the secular-bull uptrend. This annual EW-Forecast Report takes an in-depth look at Robert Shiller’s CAPE P/E ratio, the Price to Book Ratio of the S&P 500 and its Price/Sales ratio to see if these warnings have merit. We also update various sentiment indicators including the VIX, AAII Bullish Sentiment, the NYSE Advance/Decline ratio, Consumer Sentiment trends, U.S GDP trends and courtesy of Bank of America/Merrill Lynch, the results of its Fund Manager Risk survey.
What this reveals is a two-fold approach to forecasting the Global/U.S. economy and the related trends/counter-trends of the major indices for 2018
• The first focuses on the medium-to-long-term outlook, how indices are trending over the next couple of years or more
• The second, a projection of the immediate near-term future leading into the first-half of 2018 and afterwards, into year-end.
Several investment banks are already posting their 2018 forecasts – for example, Morgan Stanley forecasts an S&P upside target for the coming year to 2750.00+/-, Goldman Sachs to 2850.00+/- and JP Morgan to 3000.00+/-. Widening the poll, the average forecast predicts the S&P 500 at 2819.00+/- by the end of 2018 but that’s only an annual gain of 5.4% per cent above current levels. To put this into perspective, the S&P is currently just shy of 2700.00 and it was trading at 2557.45 in mid-November, just 6-weeks ago! That’s a gain of 5.5% per cent – besides, we believe predicting a ‘year-end’ figure is worthless because of what could happen ‘in-between’ – does the S&P surge much higher first, then correct to these projection levels, or perhaps the index collapses lower first, then recoups those losses? These forecasts do not take any of these ‘possibilities’ into account – AND THAT’S VERY IMPORTANT!
Our price-forecasts are governed by Natural Law as translated through the Elliott Wave Principle. WaveTrack’s analysis is therefore dynamic and non-linear which means forecasting trends and their rhythms during the year, not just into year-end.
New Stock Index 2018 Video – PART I/III
For 2018, we expect to see more volatility in the markets. Over the last two years, since markets formed corresponding lows at the grand ‘RE-SYNCHRONISATION’ period of Jan/Feb.’16, it was relatively easy to predict surging price rises. But these gains across varying global markets have accelerated at a different pace, some advancing their wave counts ahead of others in a show of outperformance. This means it will be more challenging to predict the exact timing of retracement declines across the year as not all Elliott Wave patterns are aligned at their current location. So this makes it all-so-important to know the location of each index and its relationship with other global counterparts.
This new 2018 STOCK INDEX video is like nothing you’ve seen anywhere else in the world – it’s unique to WaveTrack International, how we foresee trends developing through the lens of Elliott Wave Principle (EWP) and how its forecasts correlate with Cycles, Sentiment extremes and Economic data trends.
We invite you to take this next part of our financial journey with us – video subscription details are below – just follow the links and we’ll see you soon!
Most sincerely,
Peter Goodburn
Founder and Chief Elliott Wave Analyst
WaveTrack International
Stock Index Video Content: 54 charts
• CRB-Cash index
• S&P 500 + Cycles
• Dow Jones Industrial Average
• S&P Price/Book Ratio
• S&P Price/Sales Ratio
• S&P CAPE P/E Ratio
• VIX Volatility Index
• AAII Bullish Sentiment
• NYSE Advance-Decline
• Bank of America/Merrill Lynch FMS Survey
• Consumer Sentiment
• US GDP data
• Nasdaq 100
• Russell 2000
• KBW Banking Index
• XLF Financial
• Value (SVX) vs Growth (SGX)
• S&P/DJ-Internet Spread
• XLK Technology
• Eurostoxx 50
• Xetra Dax 30
• FTSE-100
• MSCI Emerging Market
• MSCI BRIC
• Bovespa
• Russia RTS
• Nifty 50
• MSCI China
• Shanghai Composite
• China Enterprises
• MSCI Hong Kong
• Hang Seng
• Taiwan SE Weighted
• Singapore Straits
• ASX 200
• Nikkei 225
CONTACT US NOW VIA EMAIL – SELECT YOUR PACKAGE
Single Video – *$48.00 – PART I STOCK INDICES (Dec. ’17)
Triple Package offer – *$96.00 (saving 33%)! – PART I – PART II – PART III (Dec. ’17 – Feb. ’18)
*(additional VAT may be added depending on your country – currently US, Canada, Asia have no added VAT but most European countries do)
PARTS II & III will be available in a few weeks’ time (2018!) – we’re working on it!
HOW CAN YOU RECEIVE THE VIDEO FORECAST?
To receive your VIDEO UPDATE please click here to contact us.
– Please state if you wish to purchase the SINGLE VIDEO for STOCK INDICES for USD *48.00?
– Or opt for the TRIPLE PACKAGE for USD *96.00 in total?
– Next we will send you a PayPal payment request and provide you with the video link & PDF report once confirmed.
*(additional VAT may be added depending on your country or residence. Currently, the US, Canada, Asia have no added VAT but most European countries do)
We’re sure you’ll reap the benefits – don’t forget to contact us with any Elliott Wave questions – Peter is always keen to hear you views, queries and comments.
Most sincerely,
WaveTrack’s Elliott Wave Team
Visit us @ www.wavetrack.com
Merry Christmas and a Joyous New Year 2018!
by WaveTrack International| December 22, 2017 | No Comments

Merry Christmas
&
Happy New Year 2018!
‘Owe no one anything, except to love each other, for the one who loves another has fulfilled the law.’
Wherever you are, whatever your faith let us remember this one universal law
unifies all humanity.
We wish you a peaceful & joyous and holiday season!
And look forward to meeting you again
On the other side of Saint Sylvester…
Peter and EW-Team
Celebrating 40-Years of Trading!
by WaveTrack International| December 19, 2017 | 4 Comments
Celebrating 40-Years of Trading!
This day, December 19th 1977 was my first day of trading in the markets. I joined Billiton-Enthoven Metals as a junior trader/analyst at their City of London operations, Colonial House, Mincing Lane, EC3. The company was a ‘floor’ member of the London Metals Exchange. It was a time when the commodity markets dominated exchanges in London A period when the stock markets were just emerging from an 8-year bear market and the bond market was practically non-existent. Actually, bond futures began trading in May 1982! Investment Banks were clients to the privately-owned exchange members. And it wasn’t until deregulation occurred in 1985, known as ‘Big Bang’, did banks break into the closely-held membership of market-makers and exchange membership.
fig #1 – view of trading ‘ring’ – London Metals Exchange – circa 1978/79 (I’m standing a 1 O’clock positon – third box from left)

fig #2 – Entrance to London Metals Exchange, Leadenhall Market (right) – circa 1971 – courtesy of the London Metals Exchange

fig #3 – Entrance to London Metals Exchange, Leadenhall Market (right) – circa 2012 – courtesy Peter Goodburn

fig #4 – PG’s Employment contract – Billiton-Enthoven Metals – circa November 19th 1977
Trading or a Baptism of Fire
The first couple of years was a baptism of fire! Commodity markets were booming following President Nixon’s announcement of his New Economic Policy, a programme ‘to create a new prosperity without war’. This became known as the ‘Nixon shock’. Mainly, because it effectively dissolved the Bretton Woods system of fixed exchange rates established at the end of World War II. Instead ushering in a free-floating system – inflationary pressures soon emerged with soaring commodity prices.
Beginning in the early 1970s, Bunker Hunt and his brother William Herbert began accumulating large amounts of silver. Both physical bullion and by buying into the futures market. By 1979, they had nearly cornered the global market. I remember being given the silver ‘book’ to trade in the office at Billiton-Enthoven Metals as prices were continually being marked higher. That meant making bids-and-offers simultaneously several times a minute to the eager clients that were ‘phoning into the sales team sitting opposite me. Was I glad to see the senior market-maker return after his lunch break!
There were many fond memories of that time. Leaving the office at 11:30am to walk the half-mile to the London Metal Exchange at Leadenhall Market which began trading the first of two 2 ½ hour price-fixing sessions of each day. And the 10 minute break which allowed us floor traders to take a quick ‘pint’ of beer in the cellar of the Lamb pub which was opposite the entrance to the exchange.
Elliott Wave Journey
My introduction to Elliott Wave analysis came through listening to daily updates of financial commentary by Bob Beckman on LBC radio (London Broadcasting Company) around the early eighties. And the intimate journey that followed is so far, mostly untold. Forty years may seem a long time to you, but for me, it’s a flashing moment. I guess we all experience a life journey like that? This one is far from over, or at least I believe it to be. And for the time that remains, I sincerely hope to be able to transfer as much as I know about the art of ‘price-forecasting’ to you and everyone out there!
Happy anniversary!
Two Reasons why the USD Dollar is in Decline
by WaveTrack International| December 18, 2017 | No Comments
Euro/USD – AUD/USD – Zig Zags Confirm US Dollar Decline
Conventional technical analysis is highlighting a ‘head-and-shoulders’ top formation in the Euro/USD beginning. The left shoulder at last August’s high of 1.1911. Its head at 1.2092 and the right shoulder into November’s high at 1.1961. This would allow a break below the neckline which is slanting left/right. This would result in a downside break below November’s low of 1.1554.
But Elliott Wave analysis is projecting a higher Euro/USD at the moment? Why?
The main reason for this is because recent declines across various USD dollar pairs have unfolded into typical Elliott Wave corrective patterns. To be specific zig zags! This implies additional Euro/USD strength/dollar weakness.
Zig Zags
Case Study 1: Euro/USD – the Euro/USD’s decline from the late-November high of 1.1961 into last week’s low not only unfolded into a typical three wave zig zag pattern, a-b-c subdividing 5-3-5 but it also adhered to fib-price-ratio measurements. For example, extending minute wave a by a fib. 61.8% to 1.1809 projects a terminal low for wave c to 1.1716 (log scale) – the actual low was 1.1717, just 1 pip from this idealised measurement! See fig #1. That’s not a coincidence! This confirms the Euro/US$ is set to resume its uptrend to a new higher-high and not break lower as indicated basis the ‘head-and-shoulders’ pattern.
EUR/USD – Elliott Wave Forecast by WaveTrack International
The Fibonacci-Price-Ratio Factor
Furthermore, if this same decline was labelled as a bearish 1-2-1 formation, in other words, the preliminary sequences within a developing five wave impulse pattern, then the two declining sequences would be of different degrees of trend which would not hold any relative fib-price-ratio relationship. Because they did hold a relationship, this identifies the three wave sequence as a zig zag. This differentiation process is a WaveTrack proprietary technique we developed many years ago and it has proved successful over the term.
Case Study 2: AUD/USD – the Aussie$ has declined from September’s high of 0.8126 into last week’s low of 0.7501 into another perfectly formed zig zag pattern. Don’t forget that this zig zag began at the exact time the Euro/USD began its correction from 1.2092 but whereas the Euro/USD ended its larger zig zag in early-November, the AUD/US$ only completed last week. But now they’re synchronised! Extending minute wave a to 0.7733 by a fib. 61.8% ratio projects a terminal low for wave c to 0.7500+/-. The actual low traded to 0.7501 – again, just 1 pip deviation! See fig #2.

AUD/USD – Short-term Elliott Wave Forecast confirms US Dollar Decline by WaveTrack International
Conclusion
The ‘pattern-integrity’ or ‘qualitative’ attribute of these two zig zags is corroborated by the ‘quantitative’ element of fib-price-ratio measurements. Both patterns have ended downward corrections which now points towards another period of US$ dollar weakness, lasting the next month or two. Negation can only occur below last week’s lows, and that seems unlikely.
Are you trading Currencies – USD, EUR, STLG or AUD? Don’t miss WaveTrack’s regular updates in our bi-weekly EW-Compass Report! Ensure you’re tracking our Forex forecasts – subscribe online for the EW-COMPASS REPORT.
Visit us @ www.wavetrack.com and subsribe to our latest EW-COMPASS report!
How to use the RUSSELL 2000 as a lead indicator?
by WaveTrack International| December 11, 2017 | No Comments
Russell 2000 – NOVEMBER’S IMPULSE PATTERN COMPLETED AT 1560.00! – WATCH FOR BEARISH DIVERGENCE DJIA
Many investors believe the Russell 2000 small-cap index leads the price movements of the large-cap indices like the S&P and Dow Jones (DJIA). However, the reality is that its relationship is often inconsistent. Yes, sometimes it does ‘lead’ but on other occasions, it ‘lags’ too. That doesn’t make it a redundant indicator. It just means that bullish/bearish divergences will occasionally alternate depending on the market forces at the time.
As all major U.S. indices approach important upside targets that end 3rd wave sequences within the five wave impulse pattern developing from the Feb.’16 low. That is why it is especially important to watch for bearish divergences between the small-cap Russell 2000 and the S&P and Dow.
August’s Impulse Completed
The Russell 2000’s five wave impulse upswing from last August’s low of 1348.80 (futures) represents the fifth wave within the larger 3rd in progress from the June ’16 Brexit low – see fig #1. As you can see from this chart, this fifth wave, labelled as minuette wave [v]. Note how it subdivides into a smaller impulse sequence, (i)-(ii)-(iii)-(iv)-(v). It has structurally satisfied completion already, into the early-December high of 1561.90.
Russell 2000 – Elliott Wave forecasting by WaveTrack International
This can be verified using Fib-Price-Ratios – for example, wave (v) unfolds by a commonly recurring fib. 61.8% ratio of waves (i)-(iii) at 1561.90, just 1.3 points from the ‘idealised’ measurement. It has subsequently traded lower to 1506.70, enough to qualify a reversal-signature.
As things stand, the S&P is scheduled to make a bid to a slightly higher-high later this week before it also triggers a ‘reversal-signature’ decline. So it will be interesting to see of some short-term bearish divergence occurs between these two.
Conclusion
Short-term bearish divergence can be misleading but this depends on the Elliott Wave pattern structure. An index could simply be lagging, as the Russell was back in October/November, but now that pattern alignment with the S&P has occurred, any sign of bearish divergence at this juncture becomes much more interesting.
Are you trading the Russell 2000, S&P 500 or Dow Jones? Don’t miss WaveTrack regular updates in our bi-weekly EW-Compass Report! Ensure you’re tracking our forecasts – subscribe online for the EW-COMPASS REPORT.
Visit us @ www.wavetrack.com and subsribe to our latest EW-COMPASS report!
NASDAQ100! What is the Perfect Timer?
by WaveTrack International| December 4, 2017 | No Comments
ENDING-DIAGONAL FOR NASDAQ100 – PERFECT TIMER!!
The S&P 500, Dow Jones (DJIA) and Russell 2000 are each trading higher from their November retracement lows into ‘expanding-impulse’ patterns. Yet, the outperforming Nasdaq100 indicating an entirely different pattern is now underway, one which might just be the perfect timer in signalling the end to the current uptrend.
The initial upswing from the mid-November low of 6230.75 (futures) has traded to new higher-highs whilst unfolding into a three wave zig zag pattern. To be exact, i.e. a-b-c, subdividing 5-3-5 and ending at 6429.50 – see fig #1. As we know, the trend cannot be terminal as a THREE wave sequence. It must ultimately complete a FIVE wave pattern. There a limited amount of ways in which a three wave sequence to higher-highs can be reconciled with other major indices. Especially, if these indices themselves are unfolding into ‘expanding-impulse’ patterns, and the most probable is where the Nasdaq100 takes the form of ‘diagonal-impulse’.

Nasdaq100 Index – 120 mins chart – Financial Forecasting by WaveTrack International
This diagonal is specifically an ENDING type, it’s the 5th wave within the larger/aggregate uptrend. What does this mean? It indicates that each of the three impulse sequences, waves [1]-[3]-[5] have a tendency to subdivide into zig zag patterns. Explaining why the November advance unfolded into one, it ended the 1st wave within the developing diagonal.
Nasdaq100 and Fib-Price-Ratios
Last Friday’s sharp decline of the Nasdaq100 to 6246.00 ended a 2nd wave correction, itself unfolding into a zig zag. The 3rd wave is normally slightly larger than the 1st wave’s amplitude. This is why we’ve used a fib. 123.6% ratio to project wave [3] towards upside targets at 6493.00+/-.
A 4th wave correction within a ‘contracting’ type diagonal (not in the case of an ‘expanding’-diagonal) will commonly unfold by a fib. 50% ratio which projects towards 6369.00+/-.
A final 5th wave advance commonly unfolds by a Fibonacci 61.8% ratio of the 3rd wave which projects wave [5] towards 6523.00+/-.
Perfect Timer
The diagonal seems the most reasonable solution for pattern reconciliation with the other major indices. Especially, as they too, finalise uptrends from the mid-November lows. But the Nasdaq’s diagonal has another quality that is useful in projecting a terminal high and that is its TIMING effect. An ‘expanding-impulse’ pattern has no constraints over just how much time is consumed in its completion. For example it can compress less time by accelerating higher or alternatively slow-down its trajectory to consume more time. In either situation, it’s difficult to determine which outcome will ultimately unfold. But the diagonal’s shape and dimension are specific enough within its converging boundary lines to offer relative time consumption before completion.
The factor of time is an important element that defines its shape and dimension. The upper and lower boundary lines must be drawn within parameters of the ‘goldilocks’ angles. If the upper boundary is too acute, i.e. above 38 degrees, then the ‘flattening’ of waves [1]-[3] and [5] are lost, where only marginal higher-highs occur at each successive attempt. In this example of the Nasdaq100, the angle is flatter at 29 degrees. In contrast, the lower boundary must be more acute to create the ‘wedge-shaped’ effect of the diagonal. Yet, if it is too oblique and you end up with a parallel with the upper boundary line.
In this example, the lower angle is at 50 degrees and could be a little more. However, less would destroy the ‘contracting’ dimension of the diagonal. In order to ensure the boundary lines form the contracting-diagonal correctly, time must be a factor. By drawing this as an exercise, especially with fib-price-ratio parameters added, it ultimately projects completion with TIMING as a key element. In the case of the Nasdaq100 ending sometime towards year-end, December ’17.
Conclusion
Like human faces, none are exactly alike, each has its slight permutations or variances. And we expect nothing less from this example of the Nasdaq100 too! By applying a general template of angles, timing and fib-price-ratios, we end up with a tangible reference for completing this uptrend.
Are you trading the Nasdaq100? Don’t miss WaveTrack regular updates in our bi-weekly EW-Compass Report! Ensure you’re tracking our forecasts – subscribe online for the EW-COMPASS REPORT.
Visit us @ www.wavetrack.com and subsribe to our latest EW-COMPASS report!
1 Common Factor you need to know! EURUSD – USD Index (DXY)
by WaveTrack International| November 27, 2017 | No Comments
EURUSD and US Dollar Index
1 Common Factor = 1 Elliott Wave Pattern
The recent EURUSD revival from the early-November low of 1.1554 seems like it’s resumed the larger uptrend that has been unfolding all year. But a closer look at the pattern structure within its counter-trend zig zag decline from September’s high of 1.2092 tells us otherwise.
The initial five wave decline to 1.1669 seems obvious enough to end wave [a], but what about the next decline from 1.1881 to 1.1554? Has that also subdivided into a satisfactory five wave pattern as wave [c]? See fig #1 (left).
EURUSD and US Dollar Index (DXY) – 360 mins – Financial Forecast by WaveTrack International
At the time of the low at 1.1554, we labelled the decline from 1.1881 as completing only a THREE WAVE SEQUENCE, not a five. Besides, the overall decline was too short to complete wave [c] within September’s zig zag pattern – it’s much shorter than wave [a]. Yes, short ‘c’ waves can sometimes occur, about 15% per cent of the time. Yet, that doesn’t explain why wave [c] only unfolded into a three wave sequence.
Expanding Flats
One viable explanation is that minor wave b. within September’s zig zag decline is unfolding into an EXPANDING FLAT, subdividing 3-3-5. That would explain why the decline between 1.1881 to 1.1554 unfolded into only a THREE WAVE SEQUENCE, not a five! Because it ended minute wave b, the second sequence of the expanding flat.
If correct, then the EURUSD’s upswing from 1.1554 as minute wave c of the expanding flat must be coming towards completion right now, at 1.1963+/-. It must also subdivide into a five wave pattern. That is actually possible! In this case it would commonly end above minute wave a’s origin by a fib. 38.2% extension ratio. This is now right into the current level at 1.1957.
All that is needed is a qualifiable ‘reversal-signature’ to take place over the next trading session. A strong push below the previous high at 1.1861 would be enough. In this case this would be the third wave peak within minute wave c ’s impulse advance.
The equivalent expanding flat pattern for the US$ Dollar index can be seen in fig #1, right. It is just testing completion in today’s low at 92.58+/-.
Failure to respond to these targets would negate this forecast, instead confirming 1.1554 and 95.15 ended September’s zig zags, albeit with deficiencies in both pattern and measurement.
Are you trading the EURUSD or the US DOLLAR INDEX? Don’t miss WaveTrack regular updates in our bi-weekly EW-Compass Report! Ensure you’re tracking our forecasts – subscribe online for the EW-COMPASS REPORT.
Visit us @ www.wavetrack.com and subsribe to our latest EW-COMPASS report!
Tags: EUR/USD
EuroStoxx50 – Uptrend Intact!
by WaveTrack International| November 23, 2017 | No Comments
EuroStoxx50 – For the Record!
WaveTrack forecasted the EuroStoxx50 Index back in December 2015. Compare the result as per today (23rd November 2017) for yourself. Just one chart for the record.
Yet, this EuroStoxx50 result speaks a 1000 words. Elliott Wave @ its best!
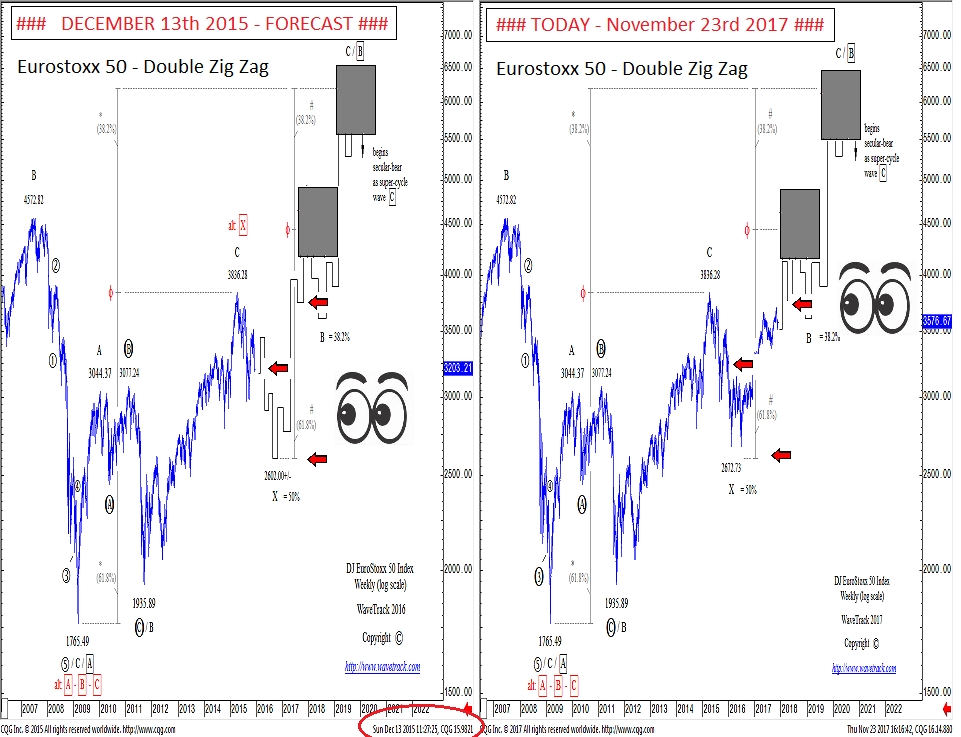
EuroStoxx50 Index – Forecasted 13th December 2015 | Result 23rd November 2017
Are you trading the EuroStoxx50? Don’t miss WaveTrack regular updates in our bi-weekly EW-Compass Report! Ensure you’re tracking our forecasts – subscribe online for the EW-COMPASS REPORT.
How to determine the next move for the SP500?
by WaveTrack International| November 21, 2017 | No Comments
SP500 and Elliott Wave!
The SP500 has been making hard work of maintaining its uptrend since the last significant correction occurred into last August’s low of 2415.75 (futures). Since then, a five wave impulse pattern has pushed markets up by +7.3% per cent, impressive, but the momentum is now waning.
The impulse pattern began by unfolding into a series of 1-2’s, a step-like sequence of advances and declines of similar amplitude which are simply the fractal subdivisions of the up-coming 3rd wave. After three 1-2 sequences, ‘price-expansion’ occurred from the late-September low of 2485.00 which acts as the 3rd-of-3rd-of-3rd wave sequence within the pattern.
The reason why the S&P is now making hard work of maintaining the same velocity is because, since early-October, it is engaged in a corresponding series of 4-5’s which are approaching upside completion that ends the entire impulse from August’s low.
The Double Diagonal!
If we zoom-in to the final stage of the 4-5-4-5 sequences, we can see something a little unusual – see fig #1. The last two impulse advances as 5th waves can be seen taking the form of an ending/contracting diagonal pattern. The first of the diagonals acts as the fifth wave within the larger 3rd within August’s impulse advance. Note that extending wave 1 to 2580.75 projects the peak of wave 5 in close proximity to the final high of 2594.50.
This was followed by a three wave correction to 2555.50, ending the larger 4th wave within August’s impulse advance.
SP500 Forecast – 60 mins. chart by WaveTrack International
The following advance has also the initial hallmarks of unfolding into a diagonal too. The push higher from 2555.50 to 2589.50 has definitively unfolded into a three wave sequence, not a five. Had it been a five, this would have resulted in the advance proceeding as an ‘expanding-impulse’, but as a three wave sequence, this fits the profile of an ending/diagonal, because the impulse sequences, i.e. 1-3-5 are expected to subdivide into zig zags (or multiples, doubles/triples).
The 2589.50 high is labelled as ending the first wave, wave < 1 > within the ending/diagonal, wave < 2 > has since pulled lower to 2567.75. But wave < 3 > is now engaged to the upside – this must also subdivide into a zig zag (as illustrated) or perhaps a double/triple sequence.
The Fibonacci Advantage
Wave < 3 > is commonly slightly larger than wave < 1 >, so we’ve used a subliminal fib. 109.01% ratio that measures its high towards 2605.00+/-. Wave < 4 > then pulls back towards the fib. 50% retracement area at 2586.50+/- which is enough to cause the necessary ‘overlap’ of wave < 1 >. And finally, wave < 5 > to upside targets towards 2609.25+/- where this unfolds by a fib. 61.8% ratio of wave < 3 >.
Observing back-to-back diagonals is something interesting to watch – this doesn’t happen often, and predicting a second is somewhat speculative but definitely worth exploring.
Are you trading the SP500? Don’t miss WaveTrack regular updates in our bi-weekly EW-Compass Report! Ensure you’re tracking our forecasts – subscribe online for the EW-COMPASS REPORT.
Visit us @ www.wavetrack.com and subsribe to our latest EW-COMPASS report!
« go back — keep looking »
Recent Posts
Recent Comments
Archives
- February 2026
- December 2025
- August 2025
- July 2025
- June 2025
- March 2025
- February 2025
- January 2025
- December 2024
- August 2024
- July 2024
- June 2024
- May 2024
- April 2024
- February 2024
- January 2024
- December 2023
- August 2023
- July 2023
- June 2023
- March 2023
- February 2023
- January 2023
- December 2022
- November 2022
- October 2022
- August 2022
- July 2022
- June 2022
- May 2022
- March 2022
- February 2022
- January 2022
- December 2021
- August 2021
- July 2021
- June 2021
- March 2021
- February 2021
- January 2021
- December 2020
- November 2020
- August 2020
- July 2020
- June 2020
- May 2020
- April 2020
- March 2020
- February 2020
- January 2020
- December 2019
- October 2019
- September 2019
- July 2019
- June 2019
- May 2019
- April 2019
- March 2019
- February 2019
- January 2019
- December 2018
- November 2018
- September 2018
- August 2018
- July 2018
- June 2018
- May 2018
- April 2018
- March 2018
- February 2018
- January 2018
- December 2017
- November 2017
- October 2017
- September 2017
- August 2017
- July 2017
- June 2017
- May 2017
- March 2017
- February 2017
- January 2017
- December 2016
- November 2016
- October 2016
- September 2016
- August 2016
- July 2016
- June 2016
- May 2016
- April 2016
- March 2016
- February 2016
- January 2016
- December 2015
- November 2015
- October 2015
- September 2015
- August 2015
- July 2015
- June 2015
- May 2015
- April 2015
- March 2015
- February 2015
- January 2015
- December 2014
- November 2014
- October 2014
- September 2014
- August 2014
- July 2014
- June 2014
- May 2014
- April 2014
- March 2014
- February 2014
- January 2014
- December 2013
- November 2013
- October 2013
- September 2013
- August 2013
- July 2013
- June 2013
- May 2013
- April 2013
- March 2013
- February 2013
- January 2013
- December 2012
- November 2012
- October 2012
- September 2012
- August 2012
Categories
- ADXY Index
- Agnico Eagle Mines
- AI Artificial Intelligence
- Alcoa
- Amazon
- AngloGold Ashanti
- Antofagasta
- APPL
- Apple
- ASX 200
- AUD vs USD
- AUDNZD
- AUDUSD
- Australia ASX 200
- Baltic Dry Index
- Banking
- Base Metals
- Biotechnology
- Bitcoin
- Bovespa
- Broadcom
- Catalexit
- central banks
- Christmas
- Commodities
- Commodities Video Outlook 2020
- Conference
- Copper
- Coronavirus Sell-Off
- CRB
- Crude oil
- crude oil price chart
- CryptoCurrency
- Currencies
- Currencies + Interest Rates Video Outlook
- Cycles
- Dax 30
- deutsche bank
- Dewey Cycle
- DJ Transportation Average
- DJ Utilities
- Dow Jones 30
- Dow Theory
- ECB
- economy
- Elliott Wave
- Elliott Wave Charts
- Elliott Wave Patterns
- Elliott Wave Principle
- Emerging Markets
- Ending-Diagonal Elliott Wave Pattern
- Equity
- EUR vs CHF
- EUR/USD
- Euro / US$
- Eurostoxx 50
- EuroStoxx50
- EuroStoxxBanks
- EURUSD
- Expanding Flat Pattern
- FAAMG
- FANG+
- fib-price-ratio
- Fibonacci Trading
- Fibonacci-Price-Ratio
- Financial Forecasting
- Fixed Income
- forex
- Freeport McMoran
- FTSE 100
- Fund Management
- FX
- FXStreet
- GBP/AUD
- GBP/USD
- GDX
- GDXJ
- Germany 10 year Euro Bund future
- Gilead Sciences
- Glencore
- Global Economy
- Gold
- Gold Mining
- Golden Ratio
- goldman sachs
- Google Inc.
- Google/Alphabeth
- Greek debt crisis
- Hang Seng
- Harbinger
- Hungarian Forint
- IBEX 35 Index Spain
- Independent Research
- India-CNX Nifty 50
- Interest Rates
- Interview
- IRP Independent Research
- kbw bank index
- Lonmin
- MAG-7
- McDonald's
- MID-YEAR VIDEO UPDATE!
- Mifid II
- Mines
- Mining
- MSCI China
- MSCI Emerging Markets
- Nasdaq 100
- Nasdaq Biotechnology Index
- Nasdaq Composite
- Nasdaq100
- Netflix
- Newmont Mining
- Nikkei 225
- NVIDIA
- NYSE Composite Index
- Palladium
- Platinum
- Precious Metals
- Ralph Nelson Elliott
- Reversal-Signature
- Russell 2000
- Russia RTS
- S&P 500
- Sector
- Secular-Bull
- Sentiment Survey
- Shanghai Composite Index
- Silver
- Slanting Flat Elliott Wave Pattern
- SP100
- SP400 Mid-Cap
- SP500
- SPX 500
- STLG/AUD
- Stlg/US$
- STLG/USD
- STLG/YEN
- STLG/ZAR
- Stock Index
- Stock Index Tracking
- Stock Index Video
- Stock Indices
- Stock Indices Video Outlook 2023
- Stock Indices Video Outlook 2025
- Sugar
- Summary
- Tesla
- Tesla Inc
- Toyota
- Track Record
- trading
- Trusts
- Tutorial
- Uncategorized
- UniCredit
- US
- US Dollar Index (DXY) (USDX)
- US$ Index
- US-Dollar Index
- US10yrYields
- USD
- USD/ARS
- USD/CNY
- USD/IDR
- USD/INR
- USD/MXN
- USD/SGD
- USD/THB
- USD/YEN
- USD/ZAR
- Vale
- Value Line Index
- video
- VIDEO OUTLOOK 2018
- VIDEO OUTLOOK 2020
- VIX
- W.D. Gann
- WaveTrack International
- XAU Gold/Silver Index
- Xetra Dax
- XOP
- Yields
- Zig Zag
- Zinc
- ‘INFLATION-POP’
- ‘SHOCK-POP-DROP’