Value Line Index – Expanding Flat!
by WaveTrack International| April 10, 2018 | No Comments
Markets Higher Now!
In recent updates, U.S. index declines from February 27th highs were identified as unfolding into 3-3-5, [A]-[B]-[C] expanding flat patterns. This is the case for the S&P 500, the S&P 400 mid-cap, the Russell 2000 small-cap, the Nasdaq 100 together with several sector indices including recent updates for the XLY Consumer Disc. Index. All indices ended the expanding flat patterns in or around the lows on April 2nd. Interestingly though, the Dow Jones (DJIA) unfolded during the same period into a different corrective pattern. A Zig Zag forming a 5-3-5 [A]-[B]-[C] pattern, the same as the major European indices. When two differing patterns like this synchronously unfold, it tells us a lot about their integrity, or validity. Moreover, it can tell us of what comes next.
Value Line Index
One index which also adhered to the expanding flat pattern between the dates of Feb. 27th to April 2nd was the Value Line index. Background (Wikipedia) – the total number of companies in the Value Line Composite Index hovers near 1675. The Value Line Arithmetic Composite Index was established on February 1, 1988. It is using the arithmetic mean to more closely mimic the change in the index if you held a portfolio of stocks in equal amounts. The Value Line index is a broader measure as it combines corporates from several exchanges, which has a tendency to smooth out distortions or exaggerated sequences.
Significance of the Expanding Flat Patterns
Note the expanding flat that began from the Feb. 27th high of 6178.38 (see fig #1, left) where wave [A] ended a double zig zag decline to 5900.74. Then a single zig zag upswing as wave [B] ending at 6257.54. And finally, wave [C] which at the time of this original update published on March 18th was trading at 6176.67 but forecast down towards the 5837.00+/- area.
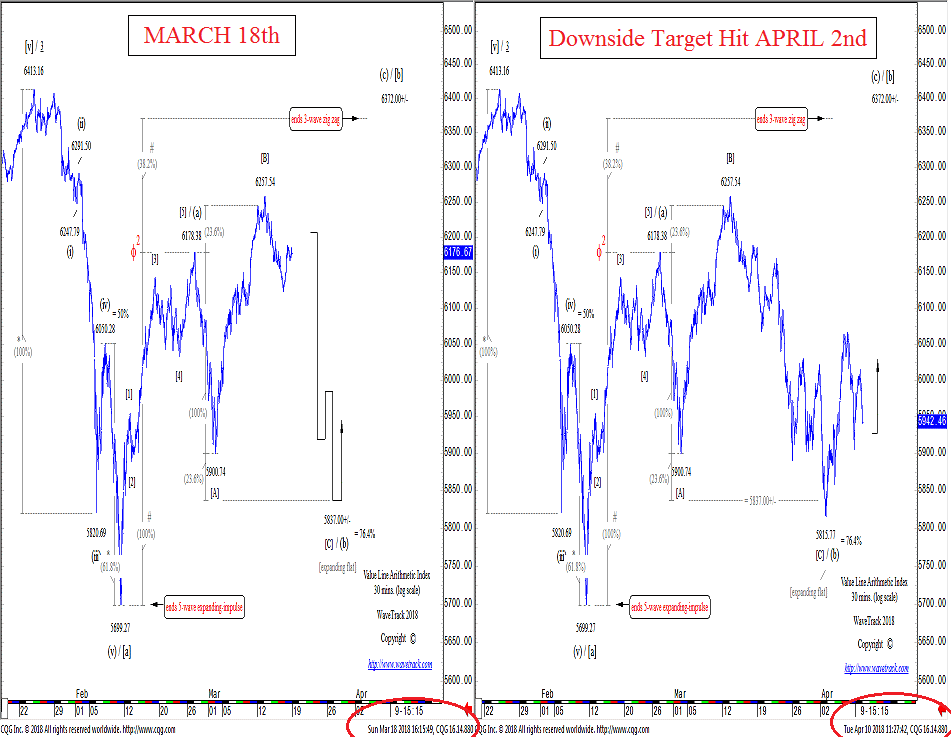
Value Line Arithmetic Index – Forecast and Result!
As you can see, wave [C] declined into a tidy five wave impulse pattern, ending into the April 2nd low at 5815.77, just a little lower (see fig #1, right). The following advance into last week’s high at 6066.93 is too large to be part of the preceding expanding flat decline. It is undoubtedly confirming the completion of the expanding flat at those early-April lows. It is the beginning of the next upswing which at the moment, is targeting towards 6372.00+/- basis the original plan.
Conclusion
Stocks are still jittery as they trade around the volatile media news emanating from President Trump and his tariff plans. But there’s evidence in these Elliott Wave patterns that suggests we are seeing at least a short-term reprieve from the selling that occurred last month. Some positive gains are forecast during the next few weeks prior to the next breakdown.
Are you trading Nasdaq100, S&P 500, EuroStoxx, Russell 2000, Dow Jones 30, Dax, FTSE100, Shanghai Composite, Hang Seng or ASX200? Don’t miss WaveTrack’s regular updates in our bi-weekly EW-Compass Report! Ensure you’re tracking our Forex forecasts – subscribe online for the EW-COMPASS REPORT.
Visit us @ www.wavetrack.com and subsribe to our latest EW-COMPASS report!
Nasdaq100 – Expanding Flat – New Update!
by WaveTrack International| April 3, 2018 | 9 Comments
NASDAQ100 – Technology Stock Slide Over!
Read more «Nasdaq100 – Expanding Flat – New Update!»
EuroStoxx and SP500 – Relax, Don’t Do It (Sell!)
by WaveTrack International| March 28, 2018 | No Comments

staging a reversal-signature that begins the next advance towards 2854.75+/-, a gain of +11% per cent over the coming month
Read more «EuroStoxx and SP500 – Relax, Don’t Do It (Sell!)»
NASDAQ 100 – Success! Downside targets achieved
by WaveTrack International| March 26, 2018 | No Comments
NASDAQ 100 – Downside Targets Achieved @ 6507.84!
Last week’s escalating news-flow around President Trump’s plans to expand upon existing U.S. import tariffs caught the markets out. Subsequently, leading to declines of -9.5% per cent in the Nasdaq 100 over the last 10-day period. Naturally, mass media and analysts continue to debate the impact of a potential trade war. However, the Nasdaq 100 together with the other major U.S. indices is quietly unfolding into some near-perfect Elliott Wave patterns that eliminates all the ‘guessing’ and ‘opinion’ from investors and pundits alike.
Expanding Flat Pattern
January’s decline hasn’t finished yet! It’s identified as unfolding into an Elliott Wave expanding flat pattern – see tutorial graphic, top-right – fig #1. There are quite a few twists and turns in this pattern particularly in the second sequence. This means we have to expect a lot more price volatility over the coming month.

Nasdaq 100 – 60 mins. – Forecast by WaveTrack International
The expanding flat is composed of three main price-swings. These price swings are labelled in minuette degree as waves [a]-b]-[c]. Each of them subdividing 3-3-5 or otherwise termed as zig zag-zig zag-impulse patterns. Wave [a] establishes the initial price-extremity of the pattern. Wave [a] did this by declining from January’s high of 7022.97 into a zig zag, ending in mid-February at 6164.43. Now, waves [b] and [c] must then marginally break beyond wave [a]’s trading-range in order to complete the expanding flat. The amplitudes of waves [b] and [c] can be measured using fib-price-ratios.
First of all, the 2nd sequence of the expanding flat, wave [b] is unfolding higher from the mid-February low of 6164.43 as a zig zag pattern, labelled (a)-(b)-(c). Wave (b) was recently forecast as unfolding into an expanding flat pattern, labelled [A]-[B]-[C] with downside targets towards 6498.00+/-. Also, last week’s dramatic sell-off basis the Trump tariff news pulled prices directly into this downside area ending into Friday’s session low at 6507.84. This is less than ten points from objectives – Monday’s (today’s) opening has rejected this low, trading now at 6657.21. This ends wave (b) of February’s zig zag upswing – wave (c) is now en-route towards 7381.64+/-.
Trade Negotiations or Trade War?
US Treasury Secretary Steve Mnuchin said yesterday this about China – ‘We’re having very productive conversations with them. I’m cautiously hopeful we reach an agreement’. China’s Ministry of Foreign Affairs replied by saying ‘China is willing to negotiate to appropriately manage and control differences with the United States on the basis of mutual respect and mutual benefit’.
Conclusion
Basis the expanding flat, a short-term reprieve around tariff talks has softened last week’s sell-off. Hence today’s stock market pull away from last Friday’s lows. But if the expanding flat has another sharp decline coming once current prices trade to higher-highs, then for sure, we can expect the talks to break down – unless another exogenous event takes its place!
Are you trading Nasdaq 100, Russell 2000, Dow Jones 30, EuroStoxx, Dax, FTSE100, Shanghai Composite, Hang Seng or ASX200? Don’t miss WaveTrack’s regular updates in our bi-weekly EW-Compass Report! Ensure you’re tracking our Forex forecasts – subscribe online for the EW-COMPASS REPORT.
Visit us @ www.wavetrack.com and subsribe to our latest EW-COMPASS report!
NEW UPDATE! Nasdaq 100 Breaks to Higher-Highs – then Collapse!
by WaveTrack International| March 15, 2018 | 2 Comments
NASDAQ 100 – EXPANDING FLAT! – NEW UPDATE!
Some of the major U.S. indices that declined during January/February’s sell-off unfolded into five wave impulse patterns. Yet, others developed into three wave corrective sequences. In order to maintain positive-correlation and pattern alignment, the ‘default’ procedure is to adopt developing [a]-[b]-[c] 5-3-5 zig zag pattern for the former. And naturally, an [a]-[b]-[c] 3-3-5 expanding flat patterns for the latter.
There is only problem with this. It demands a -19% decline for the outperforming Nasdaq 100 during wave [c]’s final sequence! That’s far too big compared to European and Asian indices. As these are already in the final stages of ending counter-trend declines that began from the November/January highs.
There are only two ways to reconcile this amplitude dislocation. Either the Nasdaq 100 and other U.S. indices will underperform European indices during wave [c]’s declines? Or the February lows ended the entirety of January’s correction for all U.S. indices with new impulse uptrends already in upside progress! However, with only a minor correction unfolding during the next week or so, correlating to final declines in Europe/Asia.
Shorter-term, we’ve detected the more recent upswing for the Nasdaq 100 from the early-March low of 6645.03 into this week’s high of 7186.09 unfolding into a three wave zig zag – see fig #1. That indicates wave (b) is transforming from a zig zag correction. Originally labelled ending at 6645.03, into a more complex correction, an expanding flat. However, wave [C] downside targets are now towards 6498.00+/-.
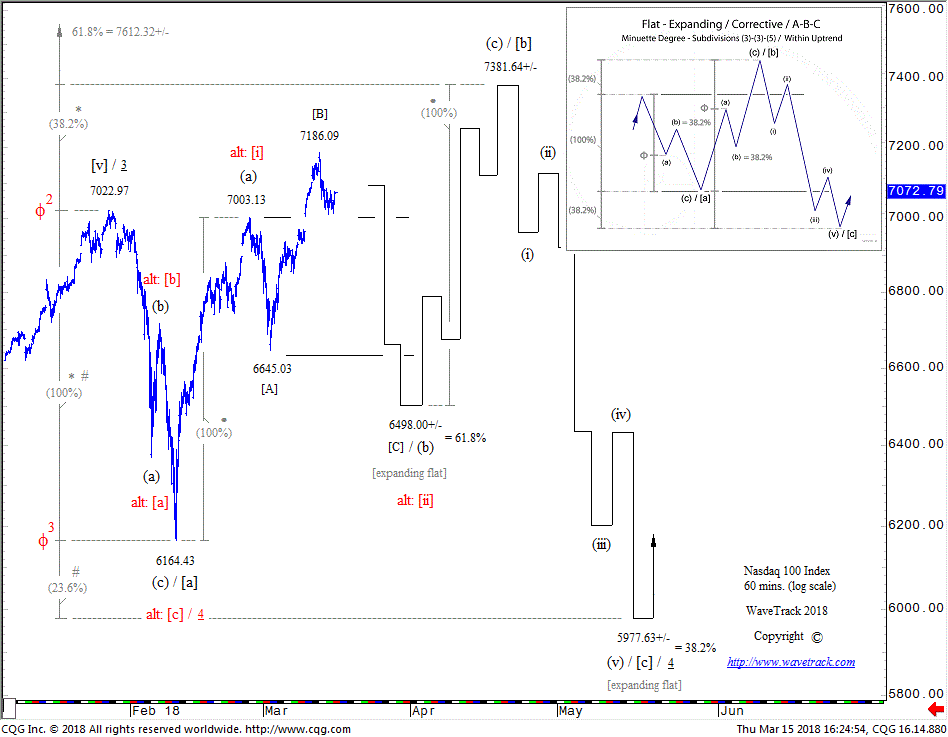
Nasdaq 100 forecast – 60 mins. chart by www.wavetrack.com
Conclusion
We can’t be certain which of these two scenarios will unfold! But one thing is for certain, a short-term decline to 6498.00+/- would present the next major buying opportunity. This is labelled as either ending wave (b) within a zig zag with wave (c) upside targets to 7381.64+/- or ending minuette wave [ii] two within a new impulse uptrend.
Are you trading Nasdaq 100, Russell 2000, Dow Jones 30, EuroStoxx, Dax, FTSE100, Shanghai Composite, Hang Seng or ASX200? Don’t miss WaveTrack’s regular updates in our bi-weekly EW-Compass Report! Ensure you’re tracking our Forex forecasts – subscribe online for the EW-COMPASS REPORT.
Visit us @ www.wavetrack.com and subsribe to our latest EW-COMPASS report!
NASDAQ 100 – EXPANDING FLAT!
by WaveTrack International| March 13, 2018 | 4 Comments
Nasdaq 100 Breaks to Higher-Highs – then Collapse!
During January’s steep declines, benchmark indices like the S&P 500 unfolded lower whilst developing into five wave impulse sequences. If so, then this indicates downward continuity once a three wave corrective upswing has ended. But some indices like the outperforming Nasdaq 100 declined from January’s high into the mid-February lows unfolding into a three wave zig zag pattern. So how can you have two major indices that are positively-correlated unfolding into two diametrically opposite patterns? One that implies downward action, the other upward!
The Un-Common Denominator – Elliott Wave Pattern Secret
Well, there is a un-common denominator! And it combines a zig zag development for indices like the S&P 500 and the broader Value Line Index with yes, an expanding flat for the Nasdaq 100.
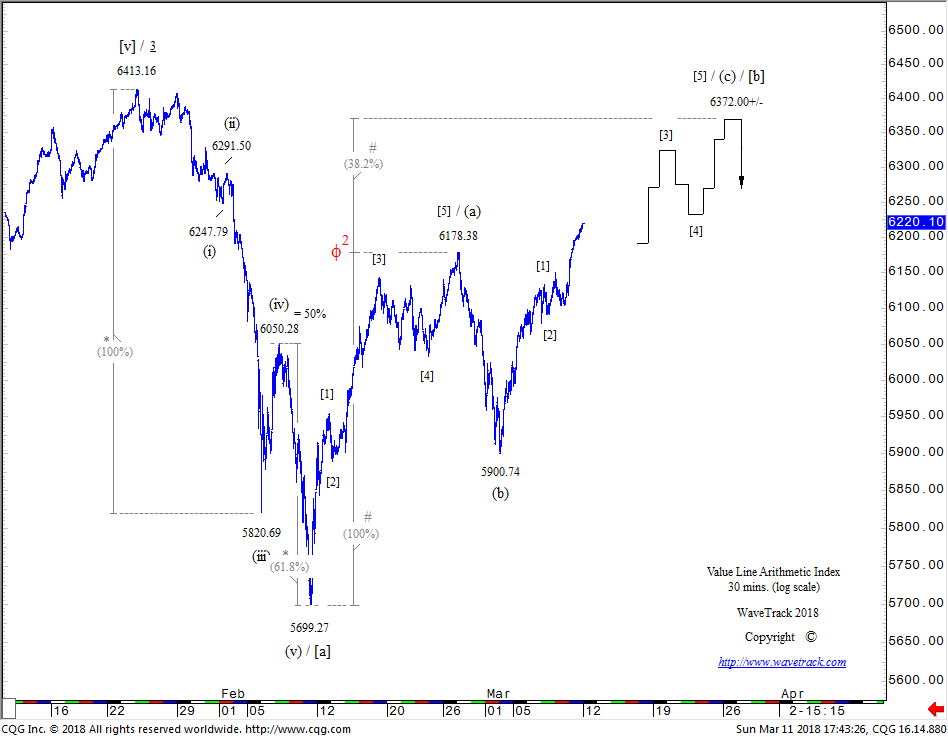
Value Line Arithmetic Index – 30 mins. – Forecast by WaveTrack International
The Value Line index was selected as a ‘proxy’ for the slight underperforming indices because it declined from the January highs into a picture-perfect five wave impulse pattern, from 6413.16 to 5699.27 – see fig #1. Using proprietary fib-price-ratios, note that wave (v) five declined by a fib. 61.8% ratio of waves (i)-(iii) ending at the exact low. That gave unequivocal confirmation that the decline did unfold into a five wave pattern, not a three, and that a counter-trend rally would then unfold. But that counter-trend rally must end below the January high. It can be very deep, but basis the rules of the Elliott Wave Principle, it must end below 6413.16. If the Value Line index is scheduled to complete a counter-trend rally ending below the January high before resuming the larger zig zag decline afterwards, then in all probability, the outperforming Nasdaq 100’s advance to higher-highs will also be capped, and that’s where the expanding flat comes in.
Value Line and the Nasdaq 100 and Zig Zag Patterns
Both the Value Line and the Nasdaq 100 are pushing higher from the mid-February lows into three wave zig zags but whereas the Value Line should not, must not break to higher-highs, this is a perquisite for the Nasdaq 100 because its January decline unfolded into a three wave zig zag, not a five wave impulse sequence – see fig #2.

NASDAQ 100 Index – 60 mins. chart – Forecast by WaveTrack International
The Nasdaq 100’s expanding flat is labelled in minuette degree, [a]-[b]-[c] – see tutorial chart, inset. Wave [a] declined to 6164.43 as a zig zag and this is being replicated by wave [b]’s subsequent advance. Note that wave (a) of this zig zag ended below the preceding January peak that began the pattern. Extending wave [a] by a fib. 38.2% ratio projects a terminal high for wave [b] towards 7381.64+/-. It looks like it will be a tight squeeze to fit a five wave subdivision into wave (c)’s advance from 6645.03 but it’s certainly possible. The rarer fib. 61.8% extension ratio comes in at 7612.32+/- but this seems unlikely to be tested relative to upside targets for other major indices, including the Value Line.
Conclusion
Once wave [b] ends the Nasdaq 100’s advance, it opens the door to another sizable sell-off for wave [c] within this developing expanding flat pattern. Downside targets are towards the 5977.63+/- area, derived by extending wave [a] by a fib. 23.6% ratio. This was selected over-and-above the other two fib-price-ratios because this closely converges with the fib. 38.2% retracement support of the preceding uptrend.
Market commentators are split between the hedonistic-bullish, and the perma-bears, but on this occasion, it looks like those treading the middle-ground have a more realistic chance of trading successfully in the months ahead.
Are you trading Nasdaq 100, Russell 2000, Dow Jones 30, EuroStoxx, Dax, FTSE100, Shanghai Composite, Hang Seng or ASX200? Don’t miss WaveTrack’s regular updates in our bi-weekly EW-Compass Report! Ensure you’re tracking our Forex forecasts – subscribe online for the EW-COMPASS REPORT.
Visit us @ www.wavetrack.com and subsribe to our latest EW-COMPASS report!
SP500 – Drama, Declines & Opportunity!
by WaveTrack International| February 12, 2018 | 9 Comments
DIARY OF AN ELLIOTT WAVE ANALYST
SP500 – A WEEK OF DRAMA, DECLINES & OPPORTUNITY!
It was a week of drama, declines & opportunity for SP500. But it all began several days before, on Friday 26th January. The SP500 index was testing upside targets of 2861.75+/-, eventually overrunning slightly to 2878.50 (futures) first thing Monday morning. It then spent most of the week working lower. However, importantly unfolding into an intra-hourly five wave impulse pattern to 2813.00 ending a 1st wave in the process. Evidence of a five wave impulse pattern ensured downside continuity once a short-term correction had completed. And that’s exactly what happened by Thursday night when the index ended a 2nd wave correction at 2836.75. From then on, it was all downhill. Friday’s trading saw the SP500 decline in a 3rd wave sequence ending at 2755.00. On Monday, the 3rd wave ended at 2733.00 followed by a 4th correction to 2763.00 by the time the U.S. markets began trading. The 5th wave collapsed into Monday’s session to 2596.00, then extended into Tuesday’s low at 2529.00.
SP500 – Could such huge declines really be predicted?
Well, yes, why not. Perhaps the speed of the declines were not necessarily predicted unless you are familiar with the principle of VELOCITY in financial markets. If you’ve stared and studied such phenomenon in the past, you will begin to see! Understand that when any market runs higher, exponentially, upon exhaustion, it will decline by an equal or often larger velocity. That was certainly the case here.
In Friday’s January 26th Elliott Wave report, the SP500 was forecast building an important high towards the 2861.75+/- area. But then beginning a multi-month correction with minimum downside targets towards 2625.00+/-. This happened to be the fib. 23.6% retracement of minute wave 3’s advance measuring from its origin, the June ’16 Brexit low. Soon enough, the collapse gathered pace as last week’s trading began. Subsequently, resulting in reaching this downside target in short succession! – see Track Record in fig #1.

SP500 – Forecast and Result! Track Record
The Imporance of Correlations
Cross-referencing the decline with various other global indices, a synchronous pattern began to emerge. Monday/Tuesday’s rapid, accelerative declines was actually a 5th wave that was undergoing an ‘extension’, where one of three impulse sequences within a five wave pattern unfolds much larger than the other two. We could ‘proof’ that through fib-price-ratio analysis – for example, a common ratio found in 5th wave extensions is where it unfolds by a fib. 161.8% ratio of the 1st-4th waves – see fig #2. This projected a low for the 5th wave towards 2595.02 (cash index) – the actual low was 2593.07!
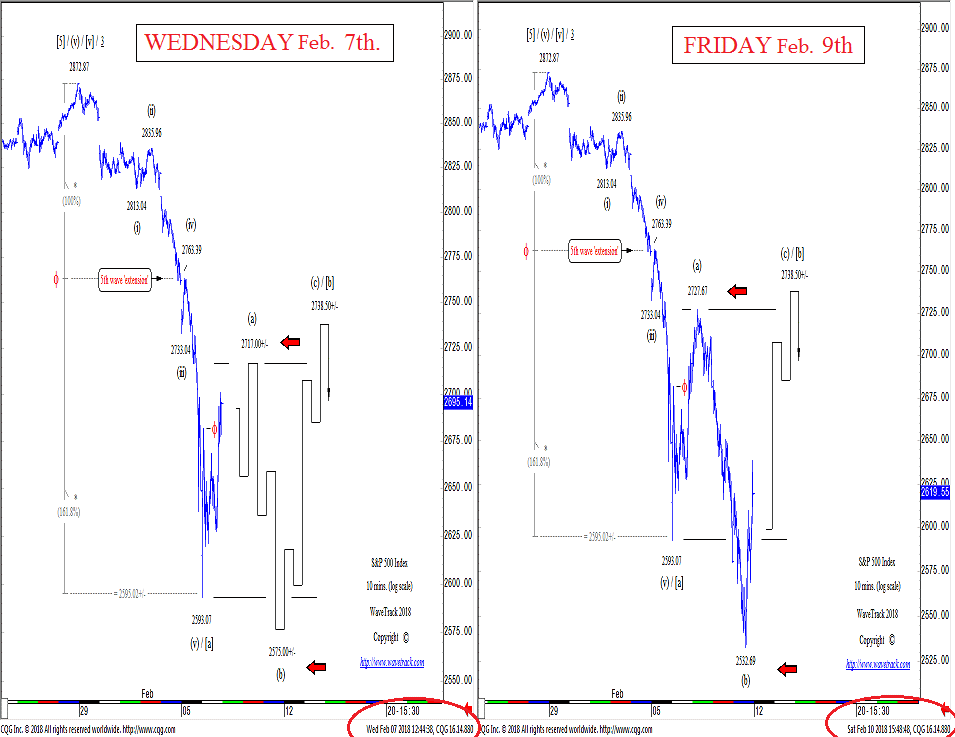
SP500 – Forecast and Result! Track Record
When 5th waves ‘extend’ like this, it commonly results in a hefty corrective upswing that follows, once again, the VELOCITY principle at work. During Wednesday’s session a three wave corrective sequence was forecast in our Elliott Wave report ending towards 2717.00+/-, the actual high was at 2727.67!
The ‘Compensation’ Factor
But because the preceding decline was an extended 5th wave plus the fact that the market’s emotions were running high, another principle was enacted – that of ‘COMPENSATION’. It’s function is to allow the market’s behaviours and emotions to ‘catch-up’ with the volatile price movements, and that often translates itself into a correction which unfolds as a ‘complex’ pattern, i.e. a horizontal/expanding flat, or perhaps a triangle. The subsequent trading-range created by such patterns allows the market’s behaviours and emotions to ‘digest’ the recent volatility. Our analysis reflected this too in Wednesday’s forecast for the S&P 500 to unfold the correction into an expanding flat pattern – labelled wave [b]. This required a decline from 2717.00+/- [2727.67] to a slightly lower-low, estimated down towards 2575.00+/-, [actual low was 2532.69] but then a hefty upside recovery that begins its final sequence, targeting upside levels towards 2738.50+/-. You can see how effective this forecast was into late-session Friday. The SP500 (cash) swing dramatically higher ending at 2619.55 – and this advance is by no means finished yet.
SP500 and Futures Contracts
Friday’s Elliott Wave report forecast this same decline, then reversal upswing for the SP500’s futures contract – see fig #3. The same five wave impulse pattern ended wave [a] into Tuesday’s low, but the following upswing to 2726.75 ended the entirety of wave [b]. The following decline actually begins the 1st wave within wave [c] declines, and in the morning, this was still incomplete with downside targets towards 2527.00+/-. This downside target was measured from the internal five wave development of this decline, where the fifth wave unfolds by a fib. 61.8% correlative ratio of the first-third waves.
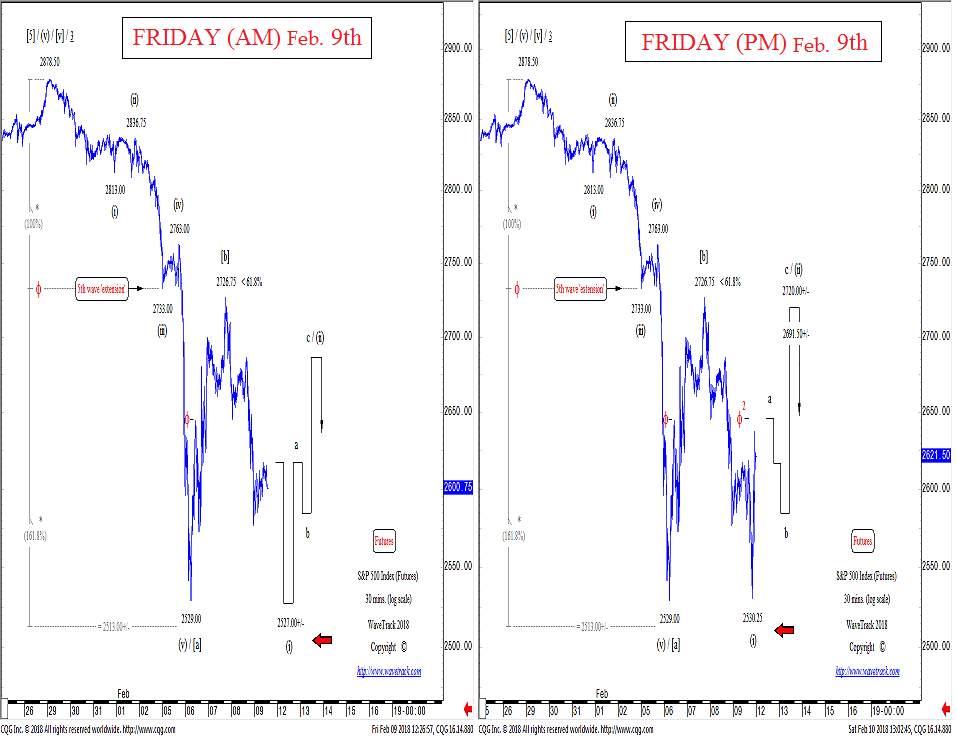
SP500 – Forecast and Result! Track Record
Fast-forward to the evening session of Friday, the SP500 ran lower amidst nervous selling and a lot of bearish headline media reports, but within a few hours of the close, the SP500 hit a low at 2530.25, just a few points from ‘idealised’ target levels, then popped higher to begin wave [c]’s 2nd wave rally.
This coming week is expected to be a very positive week with more upside potential.
These price-forecasts are dedicated to R.N. Elliott’s work and discoveries – Peter Goodburn
PS: All of this has been forecasted in WaveTrack’s EW-COMPASS REPORT
For Stock Indices Traders
Single Video – $48.00* *(additional VAT may be added depending on your country of residence. Currently US, Canada, Asia have no added VAT but most European countries do) – PART I – STOCK INDICES (54 charts 2 hours long) (Dec. ’17/Jan. ’18) Table of Contents for the STOCK INDICES VIDEO
Are you trading Currencies – SP500, Nasdaq 100, Russell 2000, Dow Jones 30, EuroStoxx, Dax, FTSE100, Shanghai Composite, Hang Seng or ASX200? Don’t miss WaveTrack’s regular updates in our bi-weekly EW-Compass Report! Ensure you’re tracking our Forex forecasts – subscribe online for the EW-COMPASS REPORT.
Visit us @ www.wavetrack.com and subsribe to our latest EW-COMPASS report!
Elliott Wave – The SLANTING FLAT Pattern – GBP/USD
by WaveTrack International| February 9, 2018 | No Comments
R.N. Elliott’s SLANTING FLAT Pattern – GBP/USD
There’s a variation to the corrective ‘FLAT’ pattern that R.N. Elliott documented which causes some confusion in identification. Fortunately, it’s quite rare though. It’s called a SLANTING FLAT. Like the ‘horizontal’, ‘running’ and ‘expanding’ flat’s it subdivides the same, as a 3-3-5 sequence but with some slight differences.
In a horizontal flat, waves A-B-C oscillate within almost-exact horizontal/parallel lines – in an expanding flat, wave A establishes an initial trading range, but waves B and C marginally exceed wave A upon completion – and finally, the running flat where waves A and B conform to the same movements as the expanding flat except that wave C falls short of ending towards the completion of wave A – see fig #1.
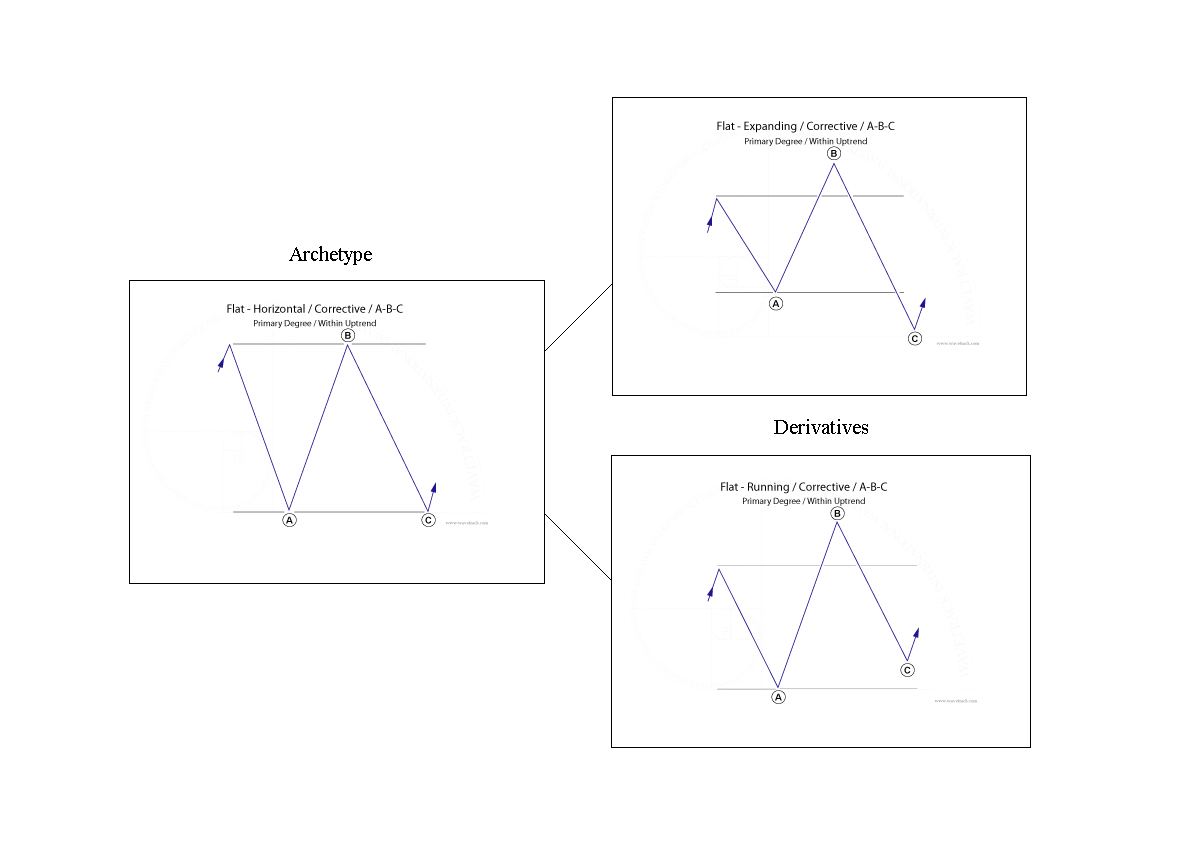
Elliott Wave Pattern Highlight The Slanting Flat Pattern
Slanting Flat Pattern
But the ‘SLANTING FLAT’ is a bit of a hybrid of these other patterns. Wave A establishes the trading range-extremity whilst subdividing into a three wave zig zag (can also unfold into a double/triple zig zag). But when wave B begins to unfold, it doesn’t equal or break above the original level of wave A – rather, it falls short. It does subdivide into a three wave zig zag though (can also unfold into a double/triple zig zag). Here’s the interesting bit – the next sequence as wave C unfolds into a five wave impulse pattern and it exceeds the completion of wave A. Sounds simple enough, but here’s the ‘rub’ – how can this be differentiated between a developing double zig zag pattern, i.e. A-B-C-X-A-B-C, 5-3-5-X-5-3-5? The same subdivisions for the ‘slanting flat’occur up until the sequence A-B-C-X-A…waves B-C are missing.
There’s only one certain way to differentiate between a completed ‘slanting flat’ and a developing double zig zag and that’s cross-referencing the pattern with other contracts/markets – there’s a good chance the pattern is unfolding differently but is less ambiguous.
GBP/USD
For what it’s worth, GBP/USD has just completed a real-time ‘SLANTING FLAT’ pattern – see fig #2.
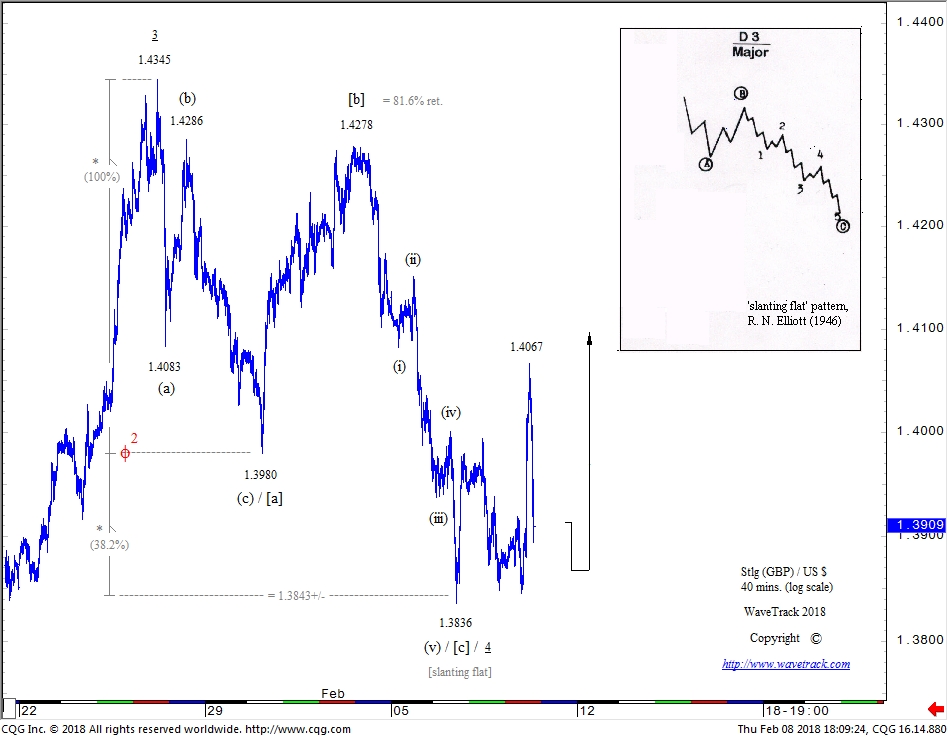
STLG vs USD – 40 mins. Elliott Wave Forecast by WaveTrack International
R.N. Elliott’s original template is inserted top-right. Labelled in minuette degree, [a]-[b]-[c], note that wave [a] subdivides into a required zig zag ending at 1.3980 and how wave [b] doesn’t quite make it to wave [a]’s origin of 1.4345 instead ending short at 1.4278 (a retracement of 81.6%). In reality, the 1.4278 high could have ended wave [x] within a developing double zig zag. The following five wave impulse decline to 1.3836 is labelled as ending wave [c] of the slanting flat but could be mistaken for wave [a] within a secondary zig zag. A comparative look at the Euro/US$ confirms the slanting flat because it has synchronously completed a double zig zag at the same time GBP/USD traded to 1.3836.
Fib-Price-Ratios
Our proprietary use of fib-price-ratios also comes in useful in verifying the completion of a slanting flat rather than a developing double zig zag pattern. Extending wave [a] by a fib. 38.2% ratio projects a terminal low for wave [c] to 1.3843+/-, the actual low was 1.3836.
Conclusion
Yes, it is still possible to conclude the following rally from 1.3836 to 1.4067 in GBP/USD is wave [b] of the secondary zig zag within a double formation but again, analysis must be cross-referenced to other positively-correlated contracts/markets.
Good luck and best wishes,
Peter Goodburn
WaveTrack International
For Currency Traders
Single Video – $48.00* *(additional VAT may be added depending on your country of residence. Currently US, Canada, Asia have no added VAT but most European countries do) – PART II – CURRENCIES (55 charts 2 hours long) (Dec. ’17/Jan. ’18)
Are you trading Currencies – USD, EUR, STLG or AUD? Don’t miss WaveTrack’s regular updates in our bi-weekly EW-Compass Report! Ensure you’re tracking our Forex forecasts – subscribe online for the EW-COMPASS REPORT.
Visit us @ www.wavetrack.com and subsribe to our latest EW-COMPASS report!
3 Reasons to watch out for Copper
by WaveTrack International| January 30, 2018 | No Comments
Copper – 2016 impulse uptrend concluding with ending-diagonal pattern!
It was exactly two-years ago that Copper prices were forging important lows at $4318 tonne. At the very same time the grand ‘RE-SYNCHRONISATION’ lows formed for developed and emerging markets. This major event was identified and documented in our monthly INSTITUTIONAL EW-NAVIGATOR REPORT and subsequent bi-weekly supplemental reports throughout 2016 onwards. It triggered what we termed as the 2nd PHASE of the ‘INFLATION-POP’. In Elliott Wave terminology this is called the next uptrend for primary wave C for major Emerging Markets & Commodities, including Copper.
Fast-forward to January/February 2018, Copper prices are approaching an interim terminal peak within the medium-term uptrend of Primary wave C which is labelled intermediate wave (1). This is the five wave impulse uptrend that began from the Feb.’16 low.
Copper – An Ending-Diagonal within Minor Wave v. Five
The fifth wave of wave (1)’s advance, labelled minor wave v. five began from the May ’17 low of 5463. Adhering to the fractal nature of financial markets, this fifth wave is also subdividing into a smaller five wave pattern. In this case a 1-2-3-4-5 pattern. Interestingly, minute wave 5 is itself unfolding into an ending/contracting-diagonal pattern, a wedge-shaped impulse sequence. Furthermore, this sequence itself is composed of five price-swings which began from last September’s low of 6366 – see fig #1.
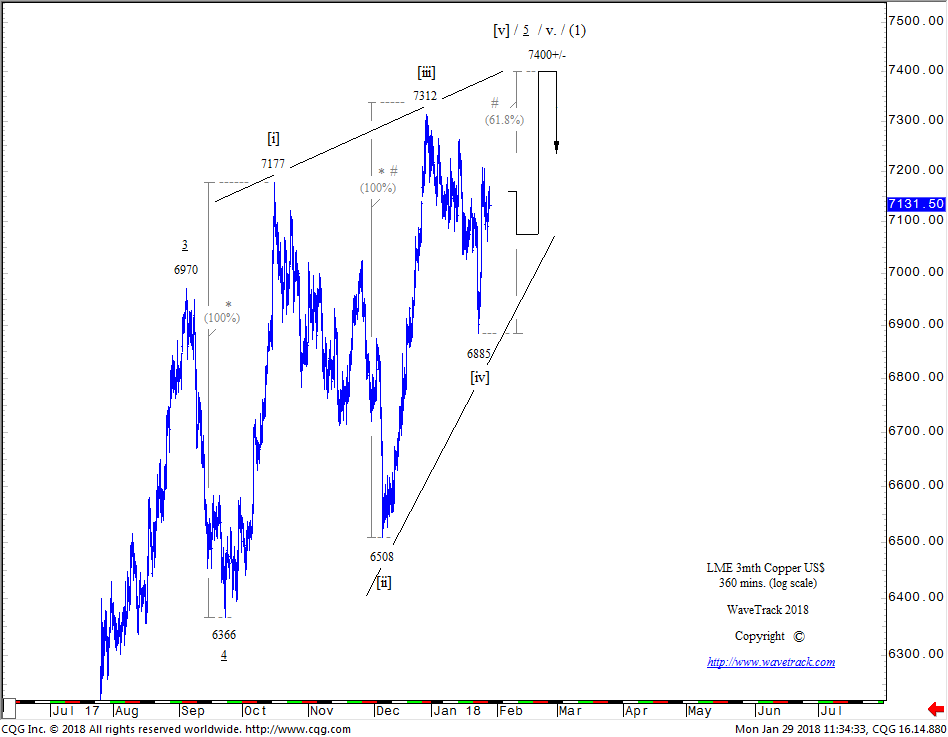
Copper – 360 mins. chart by www.wavetrack.com
In Elliott Wave methodology, a five wave diagonal pattern only appears at either the beginning or the ending of an existing trend. Clearly, this one is an ending-type given Copper has been trending higher for two years. And so evidence of a diagonal pattern appearing now is a forewarning of an imminent change of direction.
Fib-Price-Ratios
However, the diagonal is not quite ready to complete just yet. It seems to require one additional upside attempt above December’s 3rd wave high of 7312. This is labelled as minuette wave [iii] to fulfil a terminal high for the 5th wave, minuette wave [v]. Our proprietary fib-price-ratios applied to fifth waves of a ‘contracting’ type diagonal propose wave [v] will unfold higher by a fib. 61.8% correlative ratio of wave [iii] which projects a final upside test to 7400+/-.
Conclusion
Our monthly EW-COMMODITIES OUTLOOK report is about to be published with Copper’s entire five wave impulse sequence shown unfolding from the Feb.’16 low along with cycles and its positive correlation with other Base Metals. It suggests that Copper and other base metals are forming important highs for the entire year, with multi-month corrective declines about to begin. That of course, contrasts to market consensus, but taking a contrarian stance at key junctures is what financial-forecasting is all about!
3 Reasons to watch out for Copper Prices
Naturally, should Copper form a high then turn lower as we expect, it will have far-reaching effects in many other asset classes too – 1. U.S. stocks are extremely elevated right now and could do with a bit of a wash-out dell-off to trim the excesses – 2. also, watch for ‘fake-out’ not ‘break-outs’ in precious metals and – 3. long-dated interest rates over the coming month.
Good luck and best wishes,
Peter Goodburn
WaveTrack International
Take advantage of WaveTrack’s COMMODITY OUTLOOK 2018 including Base Metals, Precious Metals, Energy and a special feature of Base and Precious Metal Miners. Subscribe here to our Elliott Wave Commodities Outlook.
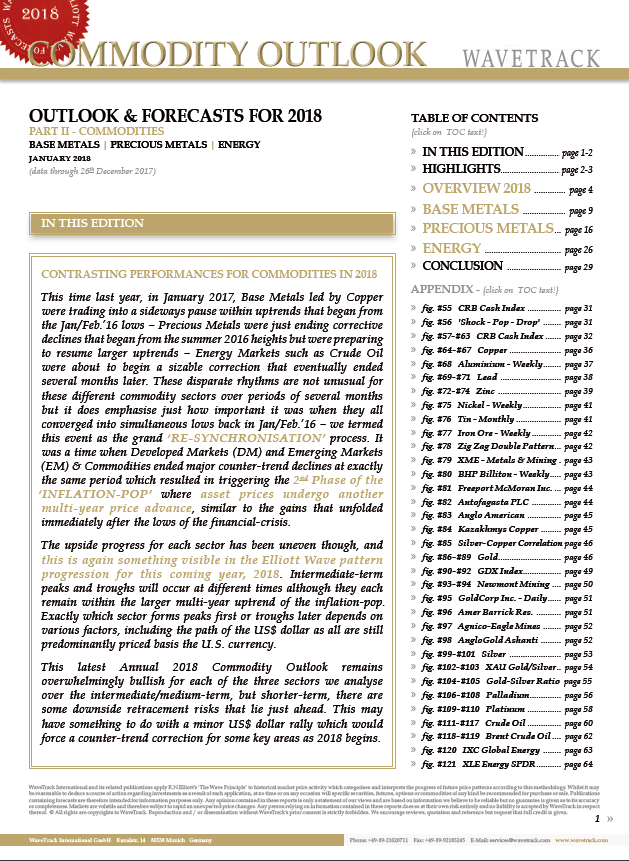
WaveTrack’s Commodity Outlook 2018
Currencies & Fixed Income 2018 Video Series
by WaveTrack International| January 29, 2018 | No Comments

Currencies and Fixed Income 2018 Video Series | PART III/III / Elliott Wave @ its best
This latest installment of WaveTrack International’s Annual 2018 three part VIDEO SERIES takes an in-depth look at how Elliott Wave patterns and cycles translate across most of the major currencies & interest rates of the world – PART III, CURRENCIES & INTEREST RATES – 2018 & BEYOND.
Our latest Video/Report analyses over 55 charts and cycles highlighting major trends, reversal levels together with Fibonacci-Price-Ratio projection levels of the major currency pairs/crosses and interest rates of the U.S., Europe and Japan. Don’t hesitate. This is the most thoroughly researched, accurate ELLIOTT WAVE ANALYSIS on the planet. We’ll be taking a look at currency trends over a 50+ year period and projecting these trends into the future. And if you want to see what the US$ Dollar looks like over a period of 350-years and U.S. interest rates over a period of 250+ years, then this latest ANNUAL 2018 ELLIOTT WAVE PRICE-FORECASTS & CYCLE PROJECTIONS will tell you.
US Dollar 2017 Recap
It was exactly 1-year ago, in January 2017 when the annual forecast wrote: This year’s most anticipated event is the changing trend for the US$ dollar against its G4+ counterparts. Over the last 7.8-year cycle period, the US$ dollar index has traded higher from the pre-financial-crisis lows to current levels but contained within a typical Elliott Wave, THREE price-swing pattern…This 7.8-year cycle upswing is about to complete, into Q1’17 then stage a reversal-signature that resumes the long-term downtrend. The dollar’s decline over the next several years will be massive, fueling a resurgence in commodity values and other assets classes in this 2nd phase of our ‘INFLATION-POP’ scenario.
It’s easy to forget just how prescient this forecast was because the US$ dollar has since declined so rapidly during the last year. It is now already embedded into our current reality – in other words, we’ve got used to it! But at the time, it was oh-so contrarian with consensus opinion heavily tilted towards a strengthening US$ dollar. Mainly because the Federal Reserve was expected to continue tightening monetary policy and a resurgent U.S. economy triggered by President Trump’s ‘America First’ programme. But all that was blown away during 2017. The US$ dollar index benchmark has since declined by -14.8% per cent – but why? Part of the reason has been a resurgent Euro which is the world’s second most traded currency unit. Yet, we believe the real reason behind the US$ dollar’s decline is the change in its alternating 7.8-year cycle.
Currencies and 7.8-Year Cycle Downtrend
Back in 2008, the dollar index formed a low at 70.70. Fast-forward another 7.8-years to late-2017, early 2017, the cycle alternates to form its next major peak. This of course, means the next 7.8-year cycle is now in a downwards direction from the US$ dollar. But what path is it likely to follow during this time period? No trend or even counter-trend trades in a straight-line! This annual report examines that path for the US$ dollar, but also how this relates to the Euro/US$, Stlg/US$, US$/Yen and many more currency pairs and crosses. And to place the 2018 forecasts into context, we’re examining long-term trends to see how they’ve interacted in the past, how they influence the future.
Furthermore, we also take a look at the net aggregated US$ dollar positioning against 8 currencies which offers a glimpse into sentiment extremes and what the immediate future holds for many of these trends. We expect to see a significant directional change of intermediate degree status into Q1 2018 which will have an effect on all currency pairs and crosses. Specific attention is also drawn to Commodity Currencies like the Aussie and Canadian dollar, together with Yen crosses against other majors. Our attention then turns to Emerging Market currencies, the Asian ADXY basket, but also some directional hints for the Korean Won, Singapore Dollar, Indian rupee, Taiwan Dollar, Thai Baht, Malaysian Ringgit, Indonesian Rupiah and the Philippine Peso. Our analysis will also include the Mexican Peso, US$/Rand, Brazilian Real, the Russian Rouble and China’s Renminbi – oh, I almost forget to mention Bitcoin!
Interest Rates – U.S. | Europe | Japan
Interest Rates are a big subject for 2018. Whilst the Federal Reserve has begun to withdraw from monetary stimulus over the last year with rate hikes a normal feature and expectation for 2018, it’s quite a different story with two other major central banks. The European Central Bank is continuing to exert its stimulus programme with continued bond purchases with no signs of withdrawal. Even though it acknowledges the Eurozone economy is in a strong recovery. The Bank of Japan has just reiterated its commitment in maintaining its own economic stimulus agenda whilst its key inflation measures remain benign. This dislocation is an intriguing one but there is some uniformity in the way long-dated interest rates are behaving.
One aspect worthy of mention is that despite U.S. stock markets reaching new record highs and a strong economic reading across many industrial sectors. Yet, the US10yr yields are relatively low by comparison! This annual 2018 report will offer some insights as to why this is happening whilst planning a definitive route for long-dated yields for this coming year. We’ll make comparisons with the benchmark European DE10yr yield and adding some cycle analysis before finalising with an outlook for the TIPS 10yr Inflation rate and Japanese 10yr yield forecast.
Only Twice a Year!
This new 2018 CURRENCY & INTEREST RATES VIDEO is like nothing you’ve seen anywhere else in the world. It’s unique to WaveTrack International, how we foresee trends developing through the lens of Elliott Wave Principle (EWP) and how its forecasts correlate with Cycles and Currencies, Interest Rates from around the world. It is only available twice a year!
We invite you to take this next part of our financial journey with us – video subscription details are below – just follow the links and we’ll see you soon!
Most sincerely,
Peter Goodburn
Founder and Chief Elliott Wave Analyst
WaveTrack International
The contents of this CURRENCIES & INTEREST RATES VIDEO include Elliott Wave analysis for:
Currencies:
• US$ index
• Euro/US$
• Stlg/US$
• US$/Yen
• US$/CHF
• AUD/US$
• NZD/US$
• US$/CAD
• Euro/Stlg
• Euro/Yen
• Asian ADXY
• US$/IDR
• US$/MXN
• US$/ZAR
• US$/BRL
• US$/RUR
• US$/CNY
• Bitcoin
Interest Rates:
• U.S. AAA+ 30-Year Corporate Bond Yields
• US30yr Yield
• US10yr Yield
• US10yr TIPS Break Even Inflation Rate
• DE10yr Yield
• JPY10yr Yield
CONTACT US NOW VIA EMAIL – SELECT YOUR PACKAGE
Single Video – $48.00* *(additional VAT may be added depending on your country of residence. Currently US, Canada, Asia have no added VAT but most European countries do) – PART II – CURRENCIES (55 charts 2 hours long) (Dec. ’17/Jan. ’18)
Triple Package offer – $96.00* (saving 33%) *(additional VAT may be added depending on your country of residence. Currently US, Canada, Asia have no added VAT but most European countries do)! – PART I – PART II – PART III (Dec. ’17 – Feb. ’18)
And the latest COMMODITIES video covers 67 charts and is 2 hour 5 mins long. click here to read more about the COMMODITIES video content
Visit us @ www.wavetrack.com

Recent Posts
Recent Comments
Archives
- August 2026
- July 2026
- June 2026
- February 2026
- December 2025
- August 2025
- July 2025
- June 2025
- March 2025
- February 2025
- January 2025
- December 2024
- August 2024
- July 2024
- June 2024
- May 2024
- April 2024
- February 2024
- January 2024
- December 2023
- August 2023
- July 2023
- June 2023
- March 2023
- February 2023
- January 2023
- December 2022
- November 2022
- October 2022
- August 2022
- July 2022
- June 2022
- May 2022
- March 2022
- February 2022
- January 2022
- December 2021
- August 2021
- July 2021
- June 2021
- March 2021
- February 2021
- January 2021
- December 2020
- November 2020
- August 2020
- July 2020
- June 2020
- May 2020
- April 2020
- March 2020
- February 2020
- January 2020
- December 2019
- October 2019
- September 2019
- July 2019
- June 2019
- May 2019
- April 2019
- March 2019
- February 2019
- January 2019
- December 2018
- November 2018
- September 2018
- August 2018
- July 2018
- June 2018
- May 2018
- April 2018
- March 2018
- February 2018
- January 2018
- December 2017
- November 2017
- October 2017
- September 2017
- August 2017
- July 2017
- June 2017
- May 2017
- March 2017
- February 2017
- January 2017
- December 2016
- November 2016
- October 2016
- September 2016
- August 2016
- July 2016
- June 2016
- May 2016
- April 2016
- March 2016
- February 2016
- January 2016
- December 2015
- November 2015
- October 2015
- September 2015
- August 2015
- July 2015
- June 2015
- May 2015
- April 2015
- March 2015
- February 2015
- January 2015
- December 2014
- November 2014
- October 2014
- September 2014
- August 2014
- July 2014
- June 2014
- May 2014
- April 2014
- March 2014
- February 2014
- January 2014
- December 2013
- November 2013
- October 2013
- September 2013
- August 2013
- July 2013
- June 2013
- May 2013
- April 2013
- March 2013
- February 2013
- January 2013
- December 2012
- November 2012
- October 2012
- September 2012
- August 2012
Categories
- ADXY Index
- Agnico Eagle Mines
- AI Artificial Intelligence
- Alcoa
- Amazon
- AngloGold Ashanti
- Antofagasta
- APPL
- Apple
- ASX 200
- AUD vs USD
- AUD/YEN
- AUDNZD
- AUDUSD
- Australia ASX 200
- Baltic Dry Index
- Banking
- Base Metals
- Biotechnology
- Bitcoin
- Bovespa
- Broadcom
- Campanhia Siderugica
- Catalexit
- central banks
- CHF/Yen
- Christmas
- Commodities
- Commodities Video Outlook
- Commodities Video Outlook 2020
- Conference
- Copper
- Coronavirus Sell-Off
- CRB
- Crude oil
- crude oil price chart
- CryptoCurrency
- Currencies
- Currencies + Interest Rates Video Outlook
- Cycles
- Dax 30
- deutsche bank
- Dewey Cycle
- DJ Transportation Average
- DJ Utilities
- Dow Jones 30
- Dow Theory
- ECB
- economy
- Elliott Wave
- Elliott Wave Charts
- Elliott Wave Patterns
- Elliott Wave Principle
- Emerging Markets
- Ending-Diagonal Elliott Wave Pattern
- Equity
- EUR vs CHF
- EUR/CHF
- EUR/USD
- Euro / US$
- Eurostoxx 50
- EuroStoxx50
- EuroStoxxBanks
- EURUSD
- Expanding Flat Pattern
- FAAMG
- FANG+
- fib-price-ratio
- Fibonacci Trading
- Fibonacci-Price-Ratio
- Financial Forecasting
- Fixed Income
- forex
- Fortescu Metals
- Freeport McMoran
- FTSE 100
- Fund Management
- FX
- FXStreet
- GBP/AUD
- GBP/USD
- GDX
- GDXJ
- Gerdau Steel
- Germany 10 year Euro Bund future
- Gilead Sciences
- Glencore
- Global Economy
- Gold
- Gold Mining
- Golden Ratio
- goldman sachs
- Google Inc.
- Google/Alphabeth
- Greek debt crisis
- Hang Seng
- Harbinger
- Hungarian Forint
- IBEX 35 Index Spain
- Independent Research
- India-CNX Nifty 50
- Interest Rates
- Interview
- IRP Independent Research
- kbw bank index
- Lonmin
- MAG-7
- McDonald's
- MID-YEAR VIDEO UPDATE!
- Mifid II
- Mines
- Mining
- MSCI China
- MSCI Emerging Markets
- Nasdaq 100
- Nasdaq Biotechnology Index
- Nasdaq Composite
- Nasdaq100
- Netflix
- Newmont Mining
- Nikkei 225
- NVIDIA
- NYSE Composite Index
- Palladium
- Platinum
- Precious Metals
- Ralph Nelson Elliott
- Reversal-Signature
- Russell 2000
- Russia RTS
- S&P 500
- Sector
- Secular-Bull
- Sentiment Survey
- Shanghai Composite Index
- Silver
- Slanting Flat Elliott Wave Pattern
- SP100
- SP400 Mid-Cap
- SP500
- SPX 500
- STLG/AUD
- Stlg/US$
- STLG/USD
- STLG/YEN
- STLG/ZAR
- Stock Index
- Stock Index Tracking
- Stock Index Video
- Stock Indices
- Stock Indices Video Outlook 2023
- Stock Indices Video Outlook 2025
- Sugar
- Summary
- Tesla
- Tesla Inc
- Toyota
- Track Record
- trading
- Trusts
- Tutorial
- Uncategorized
- UniCredit
- US
- US Dollar Index (DXY) (USDX)
- US$ Index
- US-Dollar Index
- US10yrYields
- USD
- USD/ARS
- USD/CNY
- USD/IDR
- USD/INR
- USD/MXN
- USD/NOK
- USD/SEK
- USD/SGD
- USD/THB
- USD/YEN
- USD/ZAR
- Vale
- Value Line Index
- video
- VIDEO OUTLOOK 2018
- VIDEO OUTLOOK 2020
- VIX
- W.D. Gann
- WaveTrack International
- XAU Gold/Silver Index
- Xetra Dax
- XOP
- Yields
- Zig Zag
- Zinc
- ‘INFLATION-POP’
- ‘SHOCK-POP-DROP’