SP500 AT 2600.00 – PSYCHOLOGICAL? NO – MATHEMATICAL!!
by WaveTrack International| November 9, 2017 | No Comments
For the last several weeks, sentiment readings for the stock market have been so high that it’s prompted analysts and a good few treasure hunters to signal a major decline is about to begin. But the SP500 has been steadily breaking to new record highs over the last month as sentiment readings go from one extreme to another.
A couple of examples – AAII Investor Sentiment Survey shows bulls at 45.1% where the historical average is 38.5%! Now, bears are at 23.1% but this has declined sharply over the last week by a massive -5.5%. This is indicating the bears have become more neutral/bullish as the stock market continues higher. The latest from Investors Intelligence shows bulls on the NYSE at 64.9% which is slightly off from 65.28%. Yet, historically markets tend to form important peaks when this measure reaches over 60.0% per cent.
The SP500 has been approaching an important psychological level towards 2600.00. The markets love ‘round-numbers’, but is this the real reason for its approach. No, not psychological, more mathematical.
How to apply Mathematics & Fibonacci-Price-Ratios to uncover the next move for the SP500?
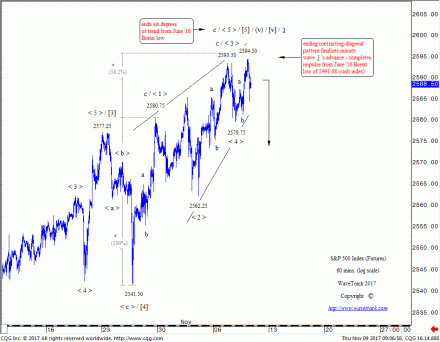
An Elliott Wave impulse pattern is approaching it upside termination between 2579.00+/- and 2606.58+/-. This five wave pattern began from the June ’16 Brexit low. The two upside targets are derived from the mathematical application of Fibonacci-Price-Ratios. For example, the 2579.00+/- level is derived from a combination of fib-price-ratios where the golden-section 61.8% cut of the entire impulse from the Feb.’16 low is at 2338.00+/-, then working back a fib. 38.2% adjustment. The 2606.58+/- area is derived where its fifth wave, minuette wave [v] unfolds by a fib. 61.8% ratio of waves [i]-[iii].
When subdividing wave [v] into five smaller waves from the March ’17 low, we see its 5th wave advance begin from August’s low of 2415.75 and within this advance, its concluding 5th wave can be seen unfolding into an ending/contracting-diagonal pattern – see fig #1. The diagonal can be seen unfolding into a typical wedge-shaped pattern, but still composed of five internal waves, <1> – <2> – <3> – <4> – <5>. Note that each impulse wave subdivides into a three wave sequence. For example a zig zag which is a prerequisite for the ‘ending’ type diagonal as opposed to the ‘leading’ type variation. Extending wave <1> by a fib. 38.2% ratio projects the terminal high for wave <5> to 2596.00+/-. The overnight high at 2594.50 approached this important number, then staged ‘price-rejection’. The following decline is enough to validate the diagonal’s completion.
The diagonal’s completion also ends a total of six degrees of trend, ending the entire impulse pattern that began from the June ’16 Brexit low. This is a larger 3rd wave in the dynamics of the impulse in upside progress from the Feb.’16 low, but it does open the way to a larger 4th wave correction now, which is about -7% or -9% per cent below current levels.
Learn how to take advantage of WaveTrack’s Fibonacci-Price-Ratios!
Watch WaveTrack’s Fib-Price-Ratio videos on youtube to see how these measurements are applied. WaveTrack’s first Elliott Wave Academy video
Ensure you’re tracking our forecasts – subscribe online for the EW-COMPASS REPORT.
Visit us @ www.wavetrack.com and subsribe to our latest EW-COMPASS report!
Comments
Leave a Reply

