SP500 Update – Impulse Patterns Ending Now!
by WaveTrack International| May 15, 2018 | No Comments
SP500 Update
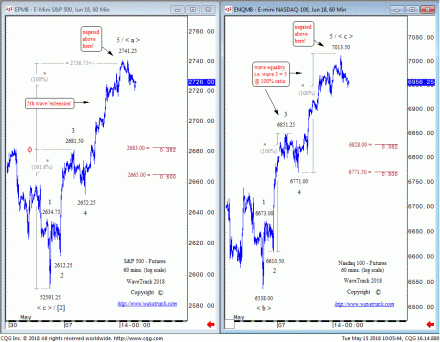
SP500 – Futures vs. Nasdaq 100 – Futures – 60 mins. Elliott Wave Forecast by WaveTrack International
Last week’s update forecast the upside completion of the SP500’s impulse pattern towards 2708.75+/- where the 5th wave unfolds by a common fib. 61.8% ratio of the 1st-3rd wave advance. But the SP500 pushed even higher, to an extent at which it developed as a 5th wave ‘extension’, where the 5th wave measures greater than either the 1st or 3rd wave sequence (see fig #1, left). The final high ended at 2741.25. This is an uncommon recurrence of only 5-7% per cent and it usually manifests at times of intense short-covering.
Sentiment in the lead-up to this advance was predominantly bearish. Especially, because the preceding advance during April unfolded into a discernible corrective/counter-trend pattern. And for investors/traders that weren’t familiar with this pattern, bearishness prevailed in previous polls simply because of the impact on rising interest rates. But the April 18th high was exceeded last week, causing the ‘extension’ in a flurry of hectic buying.
By comparison, the Nasdaq 100’s equivalent advance from the early-May low ‘looks’ more like a conventional five wave ‘expanding-impulse’ pattern where the 3rd wave is commonly the largest sequence, around 85% per cent probability (see fig #1, right). But looking closer, the 5th wave sequence is actually the same amplitude as the 3rd wave, they measure equally at a fib. 100% equality ratio. That in itself is an uncommon event. The high at 7013.50 was just a shave shorter than the 3rd, but technically, we would say these are equal.
SP500 and the latest Corrections
A short-term correction/counter-trend decline can be expected to unfold over the next several trading days. The fib. 38.2% and fib. 50% retracement areas are prime candidates to aim for, although they could be deeper. Once an initial downswing has unfolded, the pattern can be examined to determine the completion of the correction in its entirety. But until that happens, these two downside levels become the provisional downside target levels. Both adhere to Elliott’s guideline of a return to ‘fourth wave preceding degree’.
Conclusion
These short-term five wave impulse patterns are part of much larger advances underway within April’s uptrend. Once these corrections have completed, both the SP500 and Nasdaq 100 are forecast even higher, for a revisit of the February highs, and in the Nasdaq 100’s specific case, a break to new record highs.
Are you trading the SP500, EuroStoxx, Nasdaq100, Russell 2000, Dow Jones 30, Dax, FTSE100, Shanghai Composite, Hang Seng or ASX200? Don’t miss WaveTrack’s regular updates in our bi-weekly EW-Compass Report! Ensure you’re tracking our Forex forecasts – subscribe online for the EW-COMPASS REPORT.
Visit us @ www.wavetrack.com and subsribe to our latest EW-COMPASS report!
SP500 – CORRECTION DUE!
by WaveTrack International| May 10, 2018 | 4 Comments
SP500 – 5 Wave Expanding-Impulse Pattern Ending Now – Correction Due!
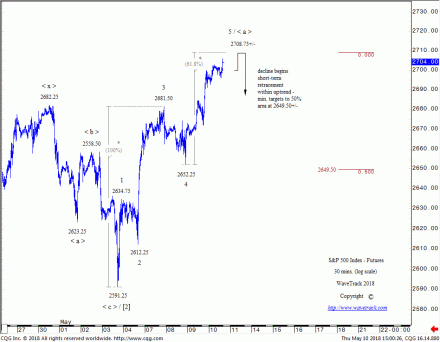
Tuesday’s update in our latest report stated ‘…The current intra-hourly advance from the early-May low of 2594.62 (2591.25 futures)…is developing into a five wave expanding-impulse pattern – upside targets are measured towards the 2708.00-18.00+/- area. Upon completion, this ends wave < a > within a developing zig zag pattern…’.
That five wave pattern can be seen approaching upside completion now – see fig #1. Labelled 1-2-3-4-5, note that wave 5’s upside targets at 2708.75+/- are derived where this fifth wave unfolds by a fib. 61.8% ratio of waves 1-3.
A counter-trend decline is perfect timing to begin wave < b > within this developing, larger uptrend. Idealised retracement levels are towards the fib. 50% retracement area at 2649.50+/-.
Conclusion
Current forecasts are ticking all the right boxes with pattern development following the precepts of the Elliott Wave Principle. What does this tell us? – it tells us that once a short-term correction has ended, the SP500 along with the other major U.S. indices will trend higher again. A re-test and even a slight break above the February highs seem inevitable.
Are you trading the SP500, EuroStoxx, Nasdaq100, Russell 2000, Dow Jones 30, Dax, FTSE100, Shanghai Composite, Hang Seng or ASX200? Don’t miss WaveTrack’s regular updates in our bi-weekly EW-Compass Report! Ensure you’re tracking our Forex forecasts – subscribe online for the EW-COMPASS REPORT.
Visit us @ www.wavetrack.com and subsribe to our latest EW-COMPASS report!
Elliott Wave Tutorial | Wave Structure – Pattern Dimension & Fib-Price-Ratios
by WaveTrack International| May 3, 2018 | No Comments
Q. I have a query about [WaveTrack’s] Elliott Wave EuroStoxx50/European indices analysis – could the entire decline from the Nov.’17 peak be labelled as a W-X-Y corrective pattern ending into the late-March ’18 low? – and a new uptrend beginning from that point ending the 1st wave now within a progressive five wave advance?
A. Thanks for your question. Your labelling of the 4th wave decline from the Nov.’17 high as a W-X-Y is actually a double zig zag, a-b-c-x-a-b-c, or 5-3-5-X-5-3-5. Re-labelling this helps to focus the correct subdivision for each wave sequence.
Pattern Dimension
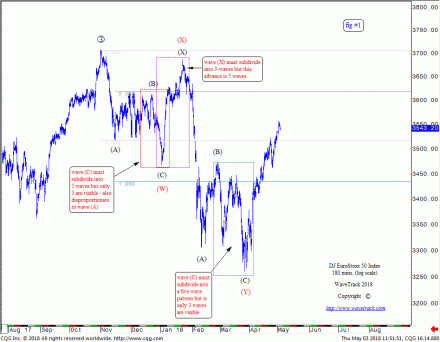
Fib-price-ratio and proportion is evenly weighted in the assessment. This reveals the ‘dimension’ for each pattern which is very important. The reason why we developed proportional/dimensional guidelines for each of Elliott’s 13 patterns is to ensure correct counting. Your labelling raises the perfect example. For example, we’ve added your count in fig #1 (see below). You’ve suggested an (A)-(B)-(C) zig zag decline from the Nov.’17 high ending into the Jan. 2nd low. But wave (C) doesn’t subdivide into the necessary five wave sequence. Nor does it fit the profile of wave (C) because it is far too short relative to wave (A).
Fib-Price-Ratios
Short ‘C’ waves within zig zags often lead to incorrect counting. But unfortunately, this is too often seen in the Elliott Wave community. Yes, they can be short but -in our experience- rarely so. More common measurements are where waves ‘A’ & ‘C’ measure equally by a fib. 100% correlative ratio or when extending wave ‘A’ by a fib. 38.2% or 61.8% ratio projects the terminal level of wave ‘C’. However, only use the 38.2% ratio extension if wave ‘B’ is a 50% retracement or more. Otherwise, use 61.8% – this guideline prevents wave ‘C’ being too short.
Wave Structure
You’ll notice we’ve added some text to the charts. Wave (X) must be a three/seven/eleven wave sequence in your labelling to evoke a correction. For example a zig zag/single/double/triple, but it is clearly a five. And finally, wave (C) within the secondary zig zag is undoubtedly a three wave sequence but basis you count, this would have to be a five.
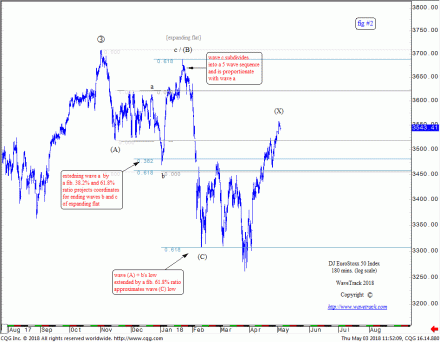
So now let’s take a look at our existing count in fig #2 . Wave (B) within the first zig zag fits perfectly to an expanding flat. The pattern subdivides 3-3-5 and it measures like an expanding flat where wave ‘a’ is extended by a fib. 38.2% or 61.8% ratio – extending wave (A) but including the ‘b’ wave low by a fib. 61.8% ratio projects in close proximity to wave (C)’s low…a little overshoot, but only by a single daily bar-spike.
Elliott Wave – Consistency and Success
The February-March decline measures as a zig zag…no short ‘c’ wave here, so perfect…and so, this count complies with both form, subdivision and proportionality. If this method and approach is used consistently, it will produce consistent results because the markets unfold in regular recurrence to these guidelines…and it eliminates a large part of subjectivity which as you know, is the Elliott Wave ‘curse’!
Yes, sometimes, counts slip through the net, but this will be small in comparison to the victories! Let’s see how the Eurostoxx 50 pans out – at the very least, you’ve constructed a good ‘alternate Elliott Wave count’!
All the very best,
Peter & the Elliott Wave Analysis Team @ WaveTrack International
Are you trading the EuroStoxx, Nasdaq100, S&P 500, Russell 2000, Dow Jones 30, Dax, FTSE100, Shanghai Composite, Hang Seng or ASX200? Don’t miss WaveTrack’s regular updates in our bi-weekly EW-Compass Report! Ensure you’re tracking our Forex forecasts – subscribe online for the EW-COMPASS REPORT.
Visit us @ www.wavetrack.com and subsribe to our latest EW-COMPASS report!
Deutsche Bank – Elliott Wave Buy Signal!
by WaveTrack International| April 26, 2018 | 2 Comments
Deutsche Bank Profit Down -79%! Elliott Wave Buy Signal!
Deutsche Bank AG announced its first-quarter earnings today (Thursday). Profits are down by a massive -79% per cent and trading revenue down by -17% per cent. The bank said it was scaling-back certain trading and lending activities in the U.S. and Asia whilst it undergoes a complete reorganisation of priorities. This includes focusing on business lending to its corporate clients in Europe.
We already know about DB’s restructuring following the departure of its former Chief Executive John Cryan and the appointment of Christian Sewing. Over recent months, analysts have marked-down Deutsche Bank’s growth potential. And now, S&P Global Ratings recently announced that DB’s ‘A’ rating is on review for a downgrade. But are these latest quarterly earnings a guide to the future performance of the share price?
Elliott Wave Analysis – Setting the Scene
It’s easy to get carried away with the bearish sentiment for Deutsche Bank. However, from an Elliott Wave perspective, the outlook for its share price is bullish.
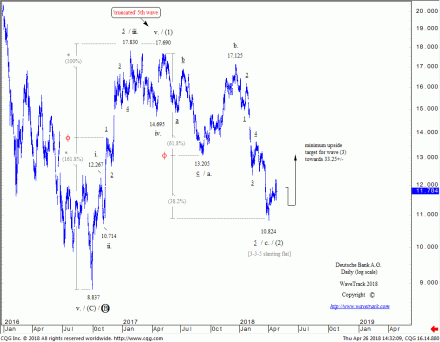
On the 10th October 2016, our equity update of Deutsche Bank issued the last buy signal at 12.035. This followed the completion of a major low at 8.837 the week before (9.898 pre-share-split of March ’17) for primary wave B. The culmination of declines that originated from the April ’10 peak of 60.55. Primary wave C upside targets were also published in that report targeting 42.23+/-, max. 73.94+/- over the next several years.
Primary wave C must ultimately develop higher into a five wave impulse sequence. Naturally, labelled in intermediate degree, (1)-(2)-(3)-(4)-(5). Wave (1) has since developed higher from that September ’16 low of 8.837 (9.898). This pattern subdivided into a smaller five wave impulse sequence which affirms its medium-term uptrend. This initial stage of the uptrend ended in May ’17 at 17.690 as wave (1) with following counter-trend declines as wave (2).
Shorter-term
The five wave impulse uptrend as wave (1) can be seen ending at 17.690 – see fig #1. Note that by extending the initial 1-2-1 sequence by a fib. 61.8% ratio projects into the final high.
The subsequent decline as wave (2) has unfolded into a rather uncommon pattern, something R.N. Elliott himself described as a ‘slanting flat’. It is labelled in minor degree, a-b-c and subdivides 3-3-5 like any of the ‘flat’ variations, except this one ends measurably below the initial decline of wave a. For example, extending wave a. by a fib. 61.8% ratio pinpoints the low for wave c. into the early-April ’18 low traded last week at 10.824. So this means the entire counter-trend decline has completed wave (2) at this low.
Conclusion
Despite the bearish sentiment of Deutsche Bank, this Elliott Wave analysis indicates a very bullish outlook and an opportunity to add to long positioning. This is, of course, a ‘contrarian’ signal but this fits the current sentiment extremes which occur at important turning points like this. Remember what it felt like back in October ’16?
If you haven’t already subscribed to our bi-weekly Elliott Wave Compass report and are actively watching or trading the markets, then do join our growing community – we have the answers you seek!
To subscribe, click here:
Institutions –
Private Investors –
SP500 and Nasdaq 100 – Two Different Corrective Patterns – Same Message!
by WaveTrack International| April 20, 2018 | 10 Comments
SP500 – Nasdaq 100 – 1st Wave Of Ending-Diagonal!
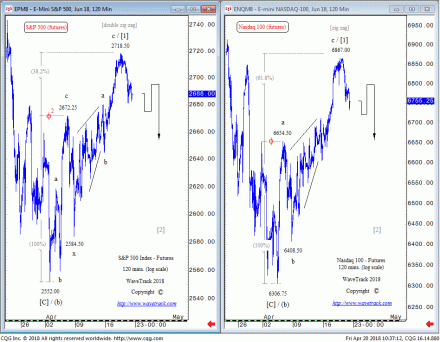
The April 2nd / April 4th lows ended expanding flat corrective patterns that began from the February 27th highs. These lows formed at 2552.00 for the SP500 futures contract and at 6306.75 for the Nasdaq 100 futures. These patterns were labelled as ending sub-minuette wave (b) within February’s larger degree zig zag upswing – see fig #1. Following advances begin wave (c) which itself must develop higher whilst unfolding into a five wave impulse pattern, extending above the Feb. 27th highs of 2789.75 and 7009.00 respectively. So far, so good!
SP500 and Nasdaq 100 – Two Different Patterns?!
But taking a closer look at wave (c)’s upside progress from those April 2nd lows reveals two different corrective patterns ending into last Wednesday’s highs. A double zig zag for the SP500 (see left) and a single zig zag for the Nasdaq 100 (see right). How can that be? Surely, the advance must unfold as a developing five wave impulse pattern, i.e. 1-2-3-4-5? Perhaps this is a series of 1-2’s, you know, a five wave ‘expanding-impulse’ pattern which begins 1-2-1-2 etc. And then expands the price action with a 3rd-of-3rd wave surge to the upside. That could still happen. But if so, why have these indices dropped away from Wednesday’s highs? A 3rd-of-3rd wave should be propelling price action higher, not lower.
Furthermore, look at how these overlapping price-swings have adhered to fib-price-ratios that depict corrective sequences. For example, if the S&P has developed into a double zig zag, then extending the first from 2552.00 to 2672.25 by a fib. 38.2% ratio projects a terminal high for the secondary zig zag exactly into Wednesday’s high at 2718.50. Extending wave ‘a’ of the Nasdaq 100’s initial upswing from 6306.75 to 6654.50 by a fib. 61.8% ratio projects a terminal high for wave ‘c’ to 6878.75 – the actual high was 6867.00.
SP500 and Nasdaq 100 – The Puzzle Solved
The only obvious answer to this rather intricate puzzle is that wave (c) is unfolding higher, not as an expanding-impulse pattern, but as a diagonal-impulse pattern, specifically, and ‘ending’ type diagonal. The wave labelling of the two impulse patterns remain the same, [1]-[2]-[3]-[4]-[5], but in an ending-diagonal, waves [1]-[3]-[5] have a tendency to subdivide into ‘threes’, zig zags or multiples, i.e. double zig zags or even triples. This explains why the advances have unfolded into a double zig zag and single zig zag for these two indices.
What Next?
Firstly, with wave [1] ending into last Wednesday’s highs, wave [2] is now underway as a corrective decline. Second wave retracements are usually sharp and steep affairs, so watch for a sudden sell-off over the next few trading days. But ultimately, wave [2] will end above the April 2nd / April 4th lows, then resume higher afterwards to begin wave [3].
Conclusion
We already know that market watchers are mystified over recent price-swings and can only stand aside with expectations of more volatility. But from an Elliott Wave perspective, we gain an intimate view of price-progression in a way no other financial system can operate – that’s because it is completely suited to non-linear dynamics, the DNA and the heartbeat of the markets’ character.
If you haven’t already subscribed to our bi-weekly Elliott Wave Compass report and are actively watching or trading the markets, then do join our growing community – we have the answers you seek!
TESLA INC. – Expanding Diagonal!
by WaveTrack International| April 16, 2018 | No Comments
Tesla vs. Goldman Sachs – We’re Backing Tesla!
Tesla Inc. caught our attention following last week’s publication of investment bank Goldman Sachs’ recent analyst report. It stated suspicion over the sustainability of the Model 3 production rate for Q2 2018 and that it would probably be far lower than Tesla’s optimistic estimates.
CEO Elon Musk responded shortly after Goldman analysts advised clients to sell the stock by challenging them and any short-sellers by saying ‘place your bets’ to followers on twitter.
And from an Elliott Wave perspective, we agree with Elon Musk – this stock is trending higher again!
To understand how Tesla Inc. got to this point, we must travel back in time. In this case, to the origin of the dominant uptrend that originated from the Feb.’16 low of 141.05. February ’16 was a very important date, not just for Tesla. But for almost all global stock markets/indices, emerging-markets and commodities! Why? Because this marked the end of counter-trend declines in each of these asset classes. It was the date when corrective declines for global stock markets completed from their 2015 highs. And where emerging markets and commodities ended corrective declines that had begun from their 2011 highs.
They all converged at the same time, forming major, synchronous lows. We termed this the grand ‘RE-SYNCHRONISATION’ lows. Mainly because up until that point, developed markets had been diverging with emerging markets and commodities for 5 years. However, now they were re-aligned!
Tesla and the Expanding Diagonal
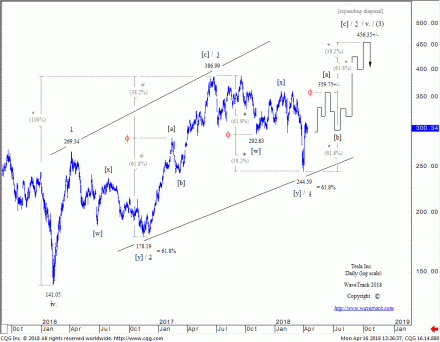
Tesla Inc. has since traded higher from the Feb.16 low into a developing five wave impulse pattern, but it’s no ordinary impulse, it’s taking the form of a DIAGONAL-IMPULSE pattern. It still consists of five waves but a diagonal necessitates the ‘overlap’ of wave 4 into the price territory of wave 1 – see fig #1.
The diagonal is labelled in minute degree, 1-2-3-4-5 where its 1st wave ended an initial thrust higher to 269.34 in April ’16, the 3rd wave ended the next upswing into the June ’17 high at 386.99 but the 5th is still in upward progress.
Now there are many aspects of this diagonal which heightens its ‘integrity’ or validity. We already know the diagonal is an ‘expanding’ type rather than a contracting variation because of the time and depth of the correction of its 4th wave that ended recently in early-April at 244.59. The boundary lines that connect the 1st and 3rd waves, the 2nd and 4th are widening as time elapses. This means using slightly different Fibonacci-Price-Ratios (FPR’s) in measuring the finalising 5th wave advance.
Tesla and Fibonacci-Price-Ratio Symmetry
In Tesla’s case, the 5th wave advance is shown unfolding by a fib. 61.8% ratio of the net advance of the 1st-3rd waves which projects a final high later this year towards 456.35+/-.
Note the other amazing fib-price-ratios in the diagonal’s development. This is an ‘ending’ type diagonal because it is the 5th wave within the intermediate-term uptrend that began way back in August ’11. Ending-diagonals usually contain impulse waves, i.e. 1st 3rd and 5th fifth’s that subdivide into [a]-[b]-[c] zig zags or doubles/triples. This is not easily visible in the 1st wave advance of this daily chart. However, it is clearly visible in the 3rd wave. Extending wave [a] to 287.39 by a fib. 61.8% ratio projects the terminal high for wave [c] of the 3rd at exactly the high traded in June ’17 at 386.99.
Furthermore, the 4th wave corrective decline that followed also measures amazingly into the early-April low at 244.59. This decline has unfolded into a double-three, labelled [w]-[x]-[y] and by extending the initial decline of [w] to 292.63 by a fib. 61.8% ratio projects the terminal low for [y] at 244.59!
The 5th wave has since begun to unfold higher and is expected to take the form of a three wave zig zag, labelled [a]-[b]-[c]. We’ve already measured the terminal high of the 5th to 456.35+/- earlier – if this is ‘cut’ by the ‘golden-ratio’ 61.8%, then an interim high is measured for wave [a] to 359.75+/-.
Conclusion
Stocks markets are still being jostled, pounded by conflicting news-flows but overall, we remain very optimistic for major indices over the next month. This positive outlook is also corroborated by Tesla Inc. too! Good luck Mr. Musk – we’re certainly endorsing your challenge!
Value Line Index – Expanding Flat!
by WaveTrack International| April 10, 2018 | No Comments
Markets Higher Now!
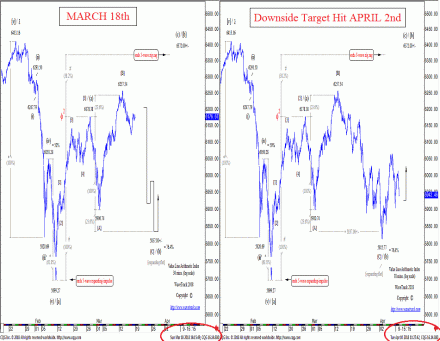
In recent updates, U.S. index declines from February 27th highs were identified as unfolding into 3-3-5, [A]-[B]-[C] expanding flat patterns. This is the case for the S&P 500, the S&P 400 mid-cap, the Russell 2000 small-cap, the Nasdaq 100 together with several sector indices including recent updates for the XLY Consumer Disc. Index. All indices ended the expanding flat patterns in or around the lows on April 2nd. Interestingly though, the Dow Jones (DJIA) unfolded during the same period into a different corrective pattern. A Zig Zag forming a 5-3-5 [A]-[B]-[C] pattern, the same as the major European indices. When two differing patterns like this synchronously unfold, it tells us a lot about their integrity, or validity. Moreover, it can tell us of what comes next.
Value Line Index
One index which also adhered to the expanding flat pattern between the dates of Feb. 27th to April 2nd was the Value Line index. Background (Wikipedia) – the total number of companies in the Value Line Composite Index hovers near 1675. The Value Line Arithmetic Composite Index was established on February 1, 1988. It is using the arithmetic mean to more closely mimic the change in the index if you held a portfolio of stocks in equal amounts. The Value Line index is a broader measure as it combines corporates from several exchanges, which has a tendency to smooth out distortions or exaggerated sequences.
Significance of the Expanding Flat Patterns
Note the expanding flat that began from the Feb. 27th high of 6178.38 (see fig #1, left) where wave [A] ended a double zig zag decline to 5900.74. Then a single zig zag upswing as wave [B] ending at 6257.54. And finally, wave [C] which at the time of this original update published on March 18th was trading at 6176.67 but forecast down towards the 5837.00+/- area.
As you can see, wave [C] declined into a tidy five wave impulse pattern, ending into the April 2nd low at 5815.77, just a little lower (see fig #1, right). The following advance into last week’s high at 6066.93 is too large to be part of the preceding expanding flat decline. It is undoubtedly confirming the completion of the expanding flat at those early-April lows. It is the beginning of the next upswing which at the moment, is targeting towards 6372.00+/- basis the original plan.
Conclusion
Stocks are still jittery as they trade around the volatile media news emanating from President Trump and his tariff plans. But there’s evidence in these Elliott Wave patterns that suggests we are seeing at least a short-term reprieve from the selling that occurred last month. Some positive gains are forecast during the next few weeks prior to the next breakdown.
Are you trading Nasdaq100, S&P 500, EuroStoxx, Russell 2000, Dow Jones 30, Dax, FTSE100, Shanghai Composite, Hang Seng or ASX200? Don’t miss WaveTrack’s regular updates in our bi-weekly EW-Compass Report! Ensure you’re tracking our Forex forecasts – subscribe online for the EW-COMPASS REPORT.
Visit us @ www.wavetrack.com and subsribe to our latest EW-COMPASS report!
Nasdaq100 – Expanding Flat – New Update!
by WaveTrack International| April 3, 2018 | 9 Comments
NASDAQ100 – Technology Stock Slide Over!
Read more «Nasdaq100 – Expanding Flat – New Update!»
EuroStoxx and SP500 – Relax, Don’t Do It (Sell!)
by WaveTrack International| March 28, 2018 | No Comments
staging a reversal-signature that begins the next advance towards 2854.75+/-, a gain of +11% per cent over the coming month
Read more «EuroStoxx and SP500 – Relax, Don’t Do It (Sell!)»
NASDAQ 100 – Success! Downside targets achieved
by WaveTrack International| March 26, 2018 | No Comments
NASDAQ 100 – Downside Targets Achieved @ 6507.84!
Last week’s escalating news-flow around President Trump’s plans to expand upon existing U.S. import tariffs caught the markets out. Subsequently, leading to declines of -9.5% per cent in the Nasdaq 100 over the last 10-day period. Naturally, mass media and analysts continue to debate the impact of a potential trade war. However, the Nasdaq 100 together with the other major U.S. indices is quietly unfolding into some near-perfect Elliott Wave patterns that eliminates all the ‘guessing’ and ‘opinion’ from investors and pundits alike.
Expanding Flat Pattern
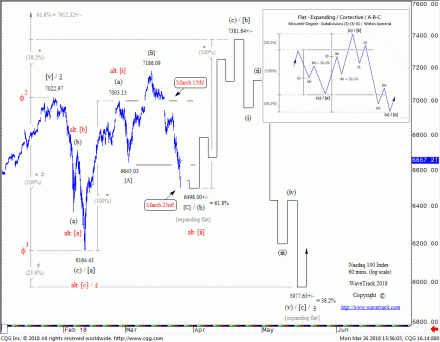
January’s decline hasn’t finished yet! It’s identified as unfolding into an Elliott Wave expanding flat pattern – see tutorial graphic, top-right – fig #1. There are quite a few twists and turns in this pattern particularly in the second sequence. This means we have to expect a lot more price volatility over the coming month.
The expanding flat is composed of three main price-swings. These price swings are labelled in minuette degree as waves [a]-b]-[c]. Each of them subdividing 3-3-5 or otherwise termed as zig zag-zig zag-impulse patterns. Wave [a] establishes the initial price-extremity of the pattern. Wave [a] did this by declining from January’s high of 7022.97 into a zig zag, ending in mid-February at 6164.43. Now, waves [b] and [c] must then marginally break beyond wave [a]’s trading-range in order to complete the expanding flat. The amplitudes of waves [b] and [c] can be measured using fib-price-ratios.
First of all, the 2nd sequence of the expanding flat, wave [b] is unfolding higher from the mid-February low of 6164.43 as a zig zag pattern, labelled (a)-(b)-(c). Wave (b) was recently forecast as unfolding into an expanding flat pattern, labelled [A]-[B]-[C] with downside targets towards 6498.00+/-. Also, last week’s dramatic sell-off basis the Trump tariff news pulled prices directly into this downside area ending into Friday’s session low at 6507.84. This is less than ten points from objectives – Monday’s (today’s) opening has rejected this low, trading now at 6657.21. This ends wave (b) of February’s zig zag upswing – wave (c) is now en-route towards 7381.64+/-.
Trade Negotiations or Trade War?
US Treasury Secretary Steve Mnuchin said yesterday this about China – ‘We’re having very productive conversations with them. I’m cautiously hopeful we reach an agreement’. China’s Ministry of Foreign Affairs replied by saying ‘China is willing to negotiate to appropriately manage and control differences with the United States on the basis of mutual respect and mutual benefit’.
Conclusion
Basis the expanding flat, a short-term reprieve around tariff talks has softened last week’s sell-off. Hence today’s stock market pull away from last Friday’s lows. But if the expanding flat has another sharp decline coming once current prices trade to higher-highs, then for sure, we can expect the talks to break down – unless another exogenous event takes its place!
Are you trading Nasdaq 100, Russell 2000, Dow Jones 30, EuroStoxx, Dax, FTSE100, Shanghai Composite, Hang Seng or ASX200? Don’t miss WaveTrack’s regular updates in our bi-weekly EW-Compass Report! Ensure you’re tracking our Forex forecasts – subscribe online for the EW-COMPASS REPORT.
Visit us @ www.wavetrack.com and subsribe to our latest EW-COMPASS report!
« go back — keep looking »