FIBONACCI-PRICE-RATIO Tutorial
by WaveTrack International| August 1, 2017 | 2 Comments
Fibonacci-Price Ratios – 5th Wave Extensions – How to Measure Termination!
Eurostoxx 50 Index
Whilst the Dow Jones Industrial Average (DJIA) trades to new highs, Europe’s equivalent bull run from last November’s low has temporarily been interrupted. The reason for this relative period of underperformance lies in the Elliott Wave pattern development. Our case study is the benchmark Eurostoxx 50 index and it offers an interesting insight to a very uncommon event – a 5th wave extension.
The Elliott Wave Principle states that a five wave impulse pattern denotes the direction of the dominant trend. There are two types of impulse patterns, the expanding-impulse and the diagonal-impulse. Both of these patterns contain a five wave sub-structure/subdivision. The expanding-impulse is the more common pattern of the two which is the subject of this tutorial.
Every expanding-impulse pattern contains one impulse sequence, either waves 1, 3, or 5. These waves visibly ‘extend’ – this means they measure larger than the other two waves – 2 or 4. About 80-85% per cent of the time, the extension or as we often term as ‘price-expansion’ occurs in the 3rd wave location. Therefore, those occasions where the 1st or 5th wave undergoes price-expansion are relatively infrequent. Because a high percentage figure is attributed to 3rd wave extensions, we often forget what a 1st or a 5th wave extension looks like. And when they do appear, how to determine the terminal high of the impulse pattern it is part of?
Fibonacci-Price-Ratios
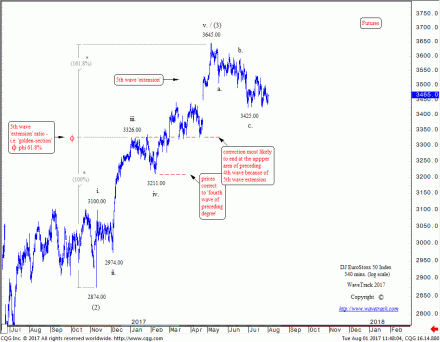
Over the last 25-years, we’ve discovered that each of R.N. Elliott’s 13 patterns unfold to certain dimensions defined and measured using Fibonacci-Price-Ratios. The Eurostoxx 50’s five wave expanding-impulse advance from the Nov.’16 low of 2874.00 (futures) offers a good example of what a 5th wave extension looks like. And in our case more importantly – how we can measure its termination – see fig #1.
This advance is labelled into its required five wave structure and assigned to minor degree, i-ii-iii-iv-v. Waves i-ii-iii are normal enough as is minor wave iv. four. However, when wave v. five begins its advance from 3211.00, it visibly unfolds larger than its predecessors, waves i. one and iii. three. Now, the correct way to measure the terminal high of this 5th wave is different in circumstances when an expanding-impulse pattern unfolds with a 1st or 3rd wave extension. In the case of a 5th wave extension, minor waves i-iii one-three are extended by a fib. 61.8% ratio, as follows:
• minor wave i. one (2874.00) to minor wave iii. three (3326.00) x 61.8% = minor wave v. five to 3640.00+/-
The actual high ended minor wave v. five just 5 points deviation at 3645.00.
When fibonacci-price-ratios are applied to the correct points in the Elliott Wave process, incredibly accurate forecasting is realised. When prices respond to predetermined upside targets like this, it transforms a subjective study of analysis into an objective one. It offers a quantitative attribute to a qualitative study, something quite unique in the field of financial forecasting.
Learn how to take advantage of WaveTrack’s Fibonacci-Price-Ratios!
Watch WaveTrack’s Fib-Price-Ratio videos on youtube to see how these measurements can be applied. These videos are gems of know-how for those who have eyes to see! WaveTrack’s first Elliott Wave Academy video
Keep tuned for more updates!
Ensure you’re tracking our forecasts – subscribe online for the EW-COMPASS REPORT.
Visit us @ www.wavetrack.com and subsribe to our latest EW-COMPASS report!
Check out WaveTrack’s latest CURRENCY VIDEO @ CURRENCIES and INTEREST RATES VIDEO PART III and subsribe to our latest EW-COMPASS report!
Comments
2 Responses to “FIBONACCI-PRICE-RATIO Tutorial”
Leave a Reply


August 6th, 2017 @ 11:51 am
Thanks for your analysis,so if you can make a forecast for the next months you see a retracements towards 3000?
August 7th, 2017 @ 9:31 am
Thank you for your comment. Agreed, current forecasts project down towards the 3300.00+/- level as intermediate wave (4) [double zig zag].