Currencies and Interest Rates 2020 Video | PART III/III
by WaveTrack International| February 18, 2020 | 1 Comment
PART III – CURRENCIES & INTEREST RATES
US$ Dollar Approaches Completion of Corrective Zig Zag Advance from 2018 Low – Major Reversal-Signature Triggers Next Stage of 7.8-Year Cycle Downtrend – Euro/US$ Forming Major Low Together with Other Dollar Pairs – U.S. Interest Rates Finalising Declines from 2018 Highs but Lower-Lows Come First – European Interest Rates Set to Retest September ’19 Lows – Italian Yields Break to Historical Lows
INCLUDES ANALYSIS ON MAJOR US$ DOLLAR PAIRS/CROSSES – ASIAN/EM CURRENCIES – MEDIUM-TERM CYCLES – LONG-DATED YIELDS US/EUROPE/JAPAN + SPREADS
We’re pleased to announce the publication of WaveTrack’s annual 2020 trilogy video series of medium-term ELLIOTT WAVE price-forecasts.
Today’s release is PART III, CURRENCIES & INTEREST RATES – Parts I & II were released during the last month.
CURRENCIES REVIEW – 2019
In last June ’19’s mid-year EW-Forecast Video, several key CURRENCY & INTEREST RATE events were highlighted –
• The US$ dollar index is set to accelerate higher through the remainder of this year (2019)
• Corresponding declines forecast for G8 currencies
• Asian currencies are expected to stage overall declines during H2 2019 with the Asian Dollar Index (ADXY) is vulnerable to a decline of -4.5%
• All emerging market and commodity-related currencies are forecast weakening against the US$ dollar during H2 2019 but some of the stronger currencies will simply undergo corrective retracements
How did these Elliott Wave price-forecasts pan out?
Actually, pretty well. The main driver that sent the US$ dollar higher across the final 6-month period of 2019 was strong U.S. economic growth and employment. But it also attracted safe-haven dollar buying as anxieties persisted over a potential fall-out from the U.S./China trade war.
The US$ dollar index traded up from the late-June low of 95.85 to 99.66 by October. It did fall back later, ending a corrective downswing into the early-January 2020 low of 96.36. But its back higher again, challenging the October highs.
There were corresponding declines for the major G8 currency pairs. The Euro/US$ declined from the June ’19 high of 1.1414 down to October’s low of 1.0879. Stlg/US$ traded down from 1.2784 into September’s low of 1.1958. Meanwhile, the AUD/US$ traded lower from 0.7083 to October’s low of 0.6671, the US$/CAD from 1.3566 to the end-December low of 1.2952 and US$/Yen from 108.80 to 104.46.
Asian Currencies Performance
Asian currencies staged downswings against the US$ dollar too. Led by the benchmark Asian Dollar Index (ADXY) which declined from 105.40 to 102.00 from June to September. However, it later recovered higher through the last quarter to 105.70 which gave some reprieve for the individual Asian currencies.
Overall, the US$ dollar pairs performed successfully within the forecasts of June ’19. So what next?
Key Drivers/Events for 2020
The currency markets have had to deal with the ongoing U.S./China trade war and more recently, as we begin 2020, the impact of the coronavirus Covid-19. But there’s more. Central Banks are beginning to rethink strategy having seen benign inflationary pressures both in the U.S. and Europe. This could be a major factor for this year.
Federal Reserve Chairman Jerome Powell’s testimony to Congress gave some hints. He said the central bank wanted to update its policy-setting manual to address an economic environment in which falling inflation was potentially a more pressing problem than rising inflation. In earlier statements, there were remarks about allowing inflation to ‘run hot’ should it begin to increase.
Now, this is creating the perfect environment to trigger the next phase of our ‘Inflation-Pop’, where asset prices advance exponentially over the next two, maybe three years.
In Europe, new ECB President Christine Lagarde has openly supported the idea of continuing to pump the financial system with liquidity. The strategic review Lagarde launched last month could be transformational for the ECB. Bringing tweaks to the ‘below but close to 2%’ inflation target and more tolerance for deviation. But what happens if the unexpected actually materialises? Would runaway inflationary pressures have a profound effect on monetary policy?
Central banks could find themselves chasing rising inflation in a repeat of the 1970’s.
Currency Volatility at Historical Lows
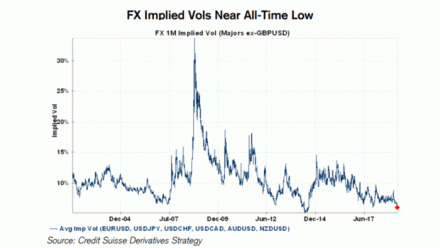
Just recently, the implied volatility of a cross-section of currencies against the US$ dollar has hit a new historical low. The last occasion volatility was this low was back in 2014. Before that, in 2007 and before that, in 1996 – see fig #1.
As you can see from this graph, courtesy of Credit Suisse Derivatives Strategy when volatility reaches towards the 5% per cent area, it doesn’t last long at these levels – it inevitably turns sharply higher. That translates into much higher volatility in the not-too-distant future.
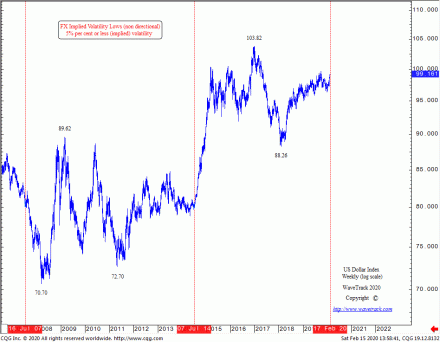
Those previous occasions of low volatility are marked in this next graph of the US$ dollar index – see fig #2. As you can see, low volatility isn’t necessarily linked to the DIRECTIONAL movement of the dollar. Back in July ’07, the US$ dollar index continued to accelerate LOWER – in July ’14, low volatility was accompanied by a surge HIGHER. What happens next may be just an opportunist guess, but not so if we apply the data to an Elliott Wave and Cycle Analysis overlay.
In this next graph – see fig #3, courtesy of Bloomberg and JP Morgan, they’ve concluded that low volatility precedes large 6-month movements in the US$ dollar.
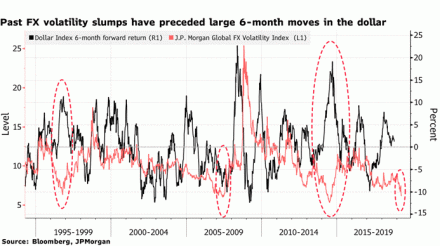
Pas FX volatility slumps have preceded large 6-month moves in the dollar – Source: Bloomberg, JP Morgan
We have to concur! – But in which direction?
Currencies EW-Forecasts for 2020
If you’ve tuned-in to our annual reports before, you’ll already know that the US$ dollar index is engaged in a 7.8-year cycle downtrend that began from the Jan.’17 high of 103.82. This is labelled as primary wave 3 within an Elliott Wave impulse downtrend that began from the July ’01 high of 121.02. You can probably imagine this means the dollar is set to decline rapidly over the next several years.
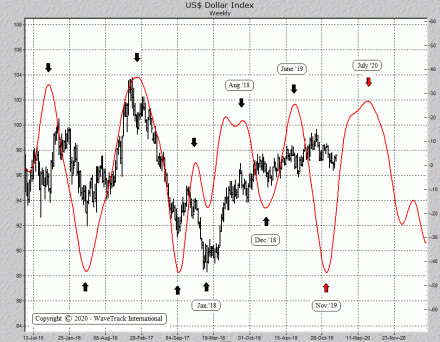
But if low volatility is a prelude to some big moves in the dollar, does that mean it will collapse immediately? Not so, basis the shorter-term EW pattern development which is also being corroborated by the weekly composite cycle of the US$ dollar index – see fig #4.
This composite cycle of the US$ dollar index is but one of several in this PART III Currencies & Interest Rate report. It depicts the US$ dollar bottoming around Nov.’19, then pushing higher until July ’20. Whilst these turning points are not exact, they do provide a useful overlay. Especially, in conjunction with shorter-term daily cycle analysis. What it does tell us is this – the dollar isn’t quite ready to resume its larger 7.8-year cycle downtrend.
Currencies and the Inflation-Pop
One of the key aspects to this year’s analysis revolves around the theme of the ‘Inflation-Pop’, where asset prices advance exponentially over the next two, maybe three years.
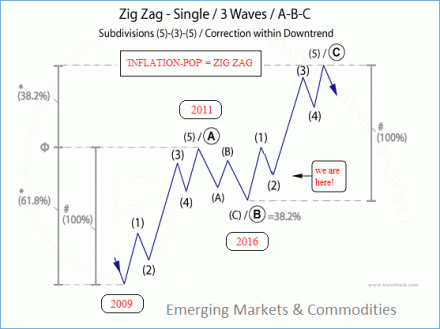
The Inflation-Pop advance is characterised by an Elliott Wave A-B-C zig zag pattern which began lifting prices higher for Stocks, Bonds, Emerging Markets and Commodities from the financial-crisis lows of 2008/09. Specifically, this A-B-C zig zag upswing is depicting the exact pattern of Emerging Market indices and many different Commodities, like benchmark Copper – see fig #5.
US Dollar Timing
But it’s also applicable to the ongoing direction of the US$ dollar. With Commodity prices set to resume wave C of the zig zag this year, in 2020, triggering the next stage of significant price advances, this will undoubtedly signal the TIMING for a declining dollar.
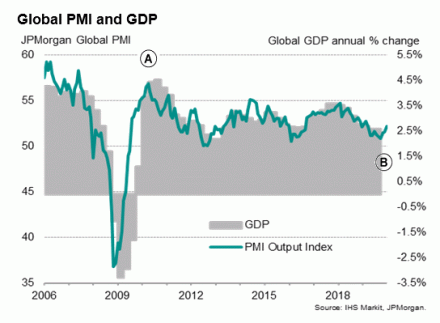
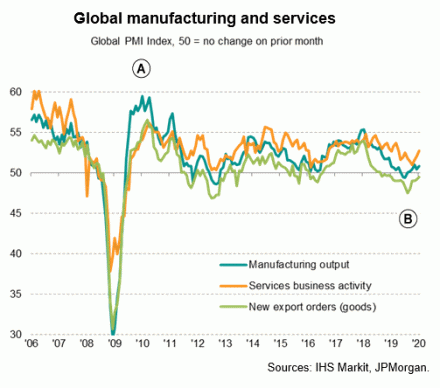
The latest Global Purchasing Managers Index (PMI) and GDP data from IHS Markit/JP Morgan corroborates the ‘Inflation-Pop’ outlook – see fig #6. We’ve annotated primary waves A and B onto the data where a sharp rise occurs for wave A from the financial-crisis lows, peaking in late-2010/early-2011, the same time that commodities and emerging market indices peaked.
Wave B’s corrective downswing has taken far longer than we first imagined. Commodities and EM’s have since ended their corresponding wave B lows in early-2016 in what was termed at the time as the Grand ‘Re-Synchronisation’ lows. But for the Global PMI, wave B is only now approaching downside completion. Just imagine what fundamental, economic conditions will arise as advances unfold as wave C!! Upside targets for wave C are towards the 70-75 point level, a massive advance over the next few years.
The Global Manufacturing & Services index, again courtesy of IHS Markit/JP Morgan shows exactly the same A-B-C zig zag pattern in upside progress, where wave B is ending now, wave C is set to explode higher – see fig #7.
For sure, 2020 is going to be a spectacular year.
Interest Rates
We already know that interest rates are artificially low. However, not only from a historical mean average but also from the fact that central banks are openly manipulating lower rates in an effort to maintain global economic growth following the financial-crisis collapse. This raises some big questions! Can central banks begin rebalancing rates higher as the economy grows? Or is it still too fragile? Could some exogenous event stymie efforts to support the financial system in the event of a recession? Or worse, another economic meltdown?
The Federal Reserve under Jerome Powell has hinted just recently about misgivings over the increasing national debt. The Treasury Department projected the budget deficit for the first four months of fiscal 2020 as $389.2 billion, a 25% per cent gain over the last year. Over the past 12 months, the gap has been nearly $1.1 trillion as the national debt has swelled past $23 trillion.
Total household debt rose by $193 billion during the last quarter of 2019, continuing a five-year upward trend. It now stands $1.5 trillion higher, in nominal terms, than the pre-recession peak of $12.7 trillion reached in 2008.
Powell added that the central bank wanted to update its policy-setting manual to address an economic environment in which falling inflation was potentially a more pressing problem than rising inflation. That’s ironic because it won’t be long before the natural forces of inflation begin to rise anyway.
Interest Rates and US10yr Breakeven Inflation TIPS rate
Earlier, we looked at global PMI data and could see it matched the ‘Inflation-Pop’ schematic, a rising A-B-C zig zag pattern where wave C is about to surge higher, lasting the next few years. Now look at this next graph – see fig #8. It depicts the US10yr Breakeven Inflation TIPS rate where the advance from the financial-crisis low of 0.077 is advancing into the same inflation-pop zig zag.
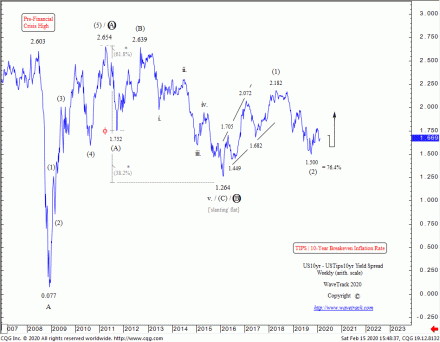
Interest Rates Elliott Wave Forecast by WaveTrack International – US10yr Breakeven Inflation TIPS rate
Primary wave A’s advance completed into the April ’11 peak of 2.654%, around the same time as corresponding peaks in commodities and emerging markets. Wave B then declined, finishing into the Grand ‘Re-Synchronisation’ lows of February ’16 at 1.264%. And since then, primary wave C has begun to trend higher beginning with 1st and 2nd waves within the ongoing (1)-(2)-(3)-(4)-(5) uptrend. Wave (5) has ultimate targets towards 4.247% which means much higher inflationary pressures are about to begin.
Should the TIPS chart be accurate as we believe it will, then the Federal Reserve will end-up being well behind the curve as they hesitate to stem the rising inflationary pressures. As a result, catching them unawares in a similar event to the 1970’s.
Interest Rates and Longer-term Outlook
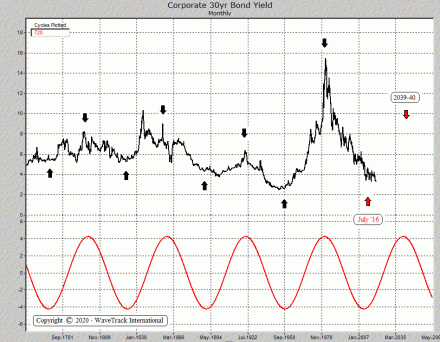
The long-term triple AAA corporate bond yield cycle certainly depicts an artificial prolongation of low interest rates – see fig #9. Whilst rising interest rates will undoubtedly be damaging for the U.S. and global economy further down the road, in its early stage of this next advance, it will simply be interpreted by central banks as a natural shift towards normalisation. And under these conditions, asset prices can explode higher, only to burst the inflation-pop bubble sometime later.
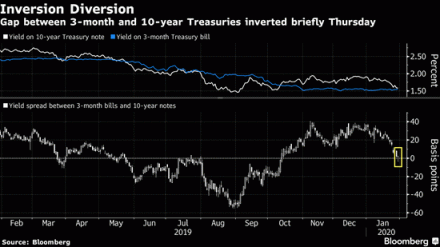
These bullish asset/inflation-pop uptrends are not shared by the consensus analysis. So far this year, two investment banks, UBS and UniCredit have come out with forecasts of three, maybe four consecutive ¼ quarter-point interest rate cuts by the Federal Reserve. That’s a pretty downbeat forecast. But that’s not all – economists are again focusing on the fact that the US dollar yield curve has inverted where US3-month yield/US10yr yield is again trading negatively. Analysis suggests this is the prelude to a recession – see fig #10.
However, that doesn’t stack up against the Elliott Wave analysis – quite the contrary.
New Currencies & Interest Rates 2020 Video – PART III/III
We’ve amassed over 90 charts (a new record!!) from our EW-Forecast database in this year’s Currencies & Interest Rates 2020 video. Each one provides a telling story into the way Elliott Wave price trends are developing in this next INFLATION-POP’ phase of cycle development. Moreover, we’re taking a look at some very specific patterns that span the entire 15.6-year US$ dollar cycle, explaining its current location and why inflation will trigger huge US$ dollar declines but simultaneously appreciating major Emerging Market and Asian Currencies.
Furthermore, we’re updating some amazing Elliott Wave forecasts for U.S. interest rates, US10yr, US10yr, US05yr and even US02yr together with a schematic look at several spread relationships with European rates not forgetting upside targets for the US10yr Inflation Tips – it’s a must-see!
We invite you to take this next step in our financial journey with us – video subscription details are below – just follow the links and we’ll see you soon!
Most sincerely,
Peter Goodburn
Founder and Chief Elliott Wave Analyst
WaveTrack International
Currencies and Interest Rates Video Content
90 charts | 2 hours
The contents of this CURRENCY & INTEREST RATES VIDEO include Elliott Wave analysis for:
Currencies:
• US$ index
• Euro/US$
• Stlg/US$
• US$/Yen
• US$/CHF
• AUD/US$
• NZD/US$
• US$/CAD
• Euro/Stlg
• Euro/Yen
• Euro/CHF
• Euro/NOK
• Stlg/Yen
• Stlg/ZAR
• Stlg/AUD
• Asian ADXY
• US$/KRW
• US$/SGD
• US$/INR
• US$/TWD
• US$/THB
• US$/MYR
• US$/IDR
• US$/PHP
• US$/BRL
• US$/RUB
• US$/CNY
• US$/ZAR
• US$/MXN
• US$/ARS
• US$/TRY
• US$/PLZ
• Bitcoin
Interest Rates:
• U.S. AAA+ 30-Year Corporate Bond Yields
• US30yr Yield
• US10yr Yield
• US05yr Yield
• US02yr Yield
• US10yr TIPS Break-Even Inflation Rate
• US10yr Tips Yield
• Various Spreads
• DE10yr Yield
• ITY10yr Yield
• JPY10yr Yield
CONTACT US NOW VIA EMAIL – SELECT YOUR PACKAGE
Single Video – *$48.00 – PART III CURRENCY and INTEREST RATES Video Outlook 2020 (February 2020)
Triple Package offer – *$96.00 (saving 33%)! – PART I – PART II – PART III (January – March ’20)
*(additional VAT may be added depending on your country – currently US, Canada, Asia have no added VAT but most European countries do)
PART III will be available in a few weeks’ time – we’re working on it!
HOW CAN YOU RECEIVE THE VIDEO FORECAST?
To receive your VIDEO UPDATE please click here to contact us.
– Please state if you wish to purchase the SINGLE VIDEO – Currencies and Interest Rates Video Outlook 2020 for USD *48.00 and send us an email to services@wavetrack.com?
– Or opt for the TRIPLE PACKAGE for USD *96.00 in total?
– Next we will send you a PayPal payment request and provide you with the video link & PDF report once payment is confirmed. Please know the reply can take up to 6 hours due to time zone differences. But rest assured we will give our best to provide you with the information as soon as possible!
*(additional VAT may be added depending on your country of residence. Currently, the US, Canada, Asia have no added VAT but most European countries do)
We’re sure you’ll reap the benefits – don’t forget to contact us with any Elliott Wave questions – Peter is always keen to hear your views, queries, and comments.
Visit us @ www.wavetrack.com
Comments
One Response to “Currencies and Interest Rates 2020 Video | PART III/III”
Leave a Reply

February 20th, 2020 @ 6:19 pm
Great content! Super high-quality! Keep it up! 🙂