XOP Oil and Gas Index/ETF – Advance
by WaveTrack International| May 12, 2020 | 2 Comments
Mid-March $29.48 Low Begins 2½ Year Advance to 1180.00+/-
XOP Oil & Gas Index/ETF and 10 Components
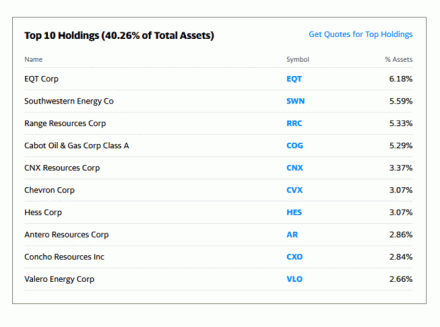
The XOP Oil & Gas Index/ETF is widely traded. By volume alone, it is one of the largest representative indexes in the Oil and Gas industries. Its top 10 components are – (see fig #1):
EQT Corp (EQT) – Southwestern Energy Co (SWN) – Range Resources Corp (RRC) – Cabot Oil & Gas (COG) – CNX Resources Corp (CNX) – Chevron Corp (CVX) – Hess Corp (HES) – Antero Resources Corp (AR) – Concho Resources Inc (CXO) – Valero Energy Corp (VLO)
We’ve taken a look at the pattern development for each of these top 10 companies and none are reflective of the index/ETF which in itself is fascinating. Some companies have been around a long time. For example, EQT Corp.’s historical data begins in July 1980. Others like CNX Resources Corp and Antero Resources Corp have little historical data to analyse.
10 Components and 1 Common Denominator
Scanning through these equities, all formed important lows in mid-March 2020 ahead of Crude oil’s major low in April. Additionally, dual lows forming in Natural Gas in late-March/early-April. Some of these equities have more upside potential than others. However, all have been decimated this year although many were already in bear market declines much earlier, from the beginning of year-2014.
XOP Index and Elliott Wave Analysis
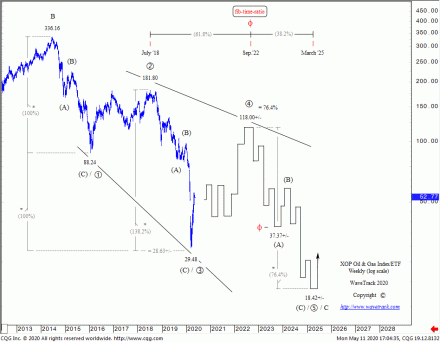
As for the XOP index, this too has been engaged in a bear market downswing since June ’14 – see fig #2. This Elliott Wave analysis shows the decline from that high of 336.16 as unfolding into a decennial five wave diagonal-impulse pattern, labelled in primary degree, 1-2-3-4-5. The diagonal is specifically an ‘expanding’ type pattern, widening as it progresses and enveloped by its two boundary lines. It’s also designated an ‘ending’ type diagonal because it is the final sequence of a much larger, multi-decennial expanding flat pattern that began from the July ’08 high of 292.16. Together, the diagonal becomes an ending/expanding-diagonal pattern.
XOP Index and Detailed Pattern Analysis
The component impulse waves, 1-3-5 of an ‘ending’ type diagonal are very specific. They commonly unfold into zig zags or doubles/triples, i.e. (A)-(B)-(C) which is the case so far for primary waves 1 and 3. This feature verifies the qualitative aspect of the diagonal’s characteristics which therefore goes some way in identifying its ongoing pattern development.
Primary wave 3’s decline also unfolded into an (A)-(B)-(C) zig zag pattern from the July ’18 high of 181.80 ending in mid-March at 29.48. This unfolded by a quantitative fib-price-ratio of 138.2% of primary wave 1. This is yet another distinction within the diagonal’s geometrical development.
Primary wave 4 has now begun a multi-year, counter-trend rally. In order to augment the widening upper/declining boundary line that connects primary waves 2 and 4, wave 4 must rally significantly higher over the next 2-3 years, into our expected TIME ZONE that ends the INFLATION-POP bubble.
Wave 4 commonly retraces wave 3 within an ‘expanding’ type diagonal by as much as a fib. 76.4% ratio, that projects towards 118.00+/-. This could develop as either a single or double/triple zig zag pattern. We don’t know which just yet although it will become apparent over the next couple of months.
XOP Index and Cycle Analysis
Cycle analysis was inconsistent in identifying a potential date for ending primary wave 4 but fib-time-ratio analysis has proved useful. As we’ll see from the monthly time-series chart in just a moment, September 2022 is a potential date for ending this rally. Extending this by a fib. 61.8% ratio projects primary wave 5 into a final low in March 2025 – that’s certainly worth watching.
Primary wave 5’s decline is measured using fib-price-ratios towards 18.42+/-. This is where wave 5 unfolds by a fib. 76.4% correlative ratio of waves 1-3. Subdividing into another (A)-(B)-(C) zig zag, wave (A) has initial downside targets towards 37.37+/-.
XOP – Monthly Time-Series
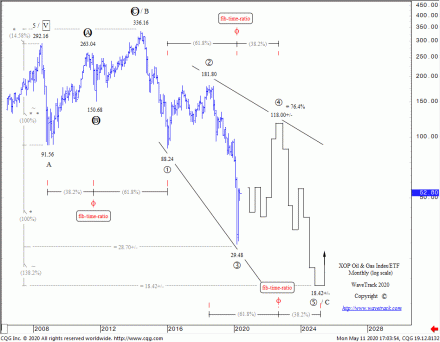
This monthly time-series chart inserts the diagonal pattern into a much longer-term expanding flat pattern that began this secular-bear correction from its all-time-high of July ’08 – see fig #3. Labelled in cycle degree, A-B-C. Wave A’s initial decline unfolds from 292.16 down to 91.56 during the financial-crisis of 2008/09. Wave B’s rally must trade briefly above wave A’s origin high, which it does, ending at 336.16 in June ’14 whilst unfolding into a primary degree zig zag pattern – another condition of the pattern. Also, it ended above wave A by a fib. 14.58% ratio. Then comes cycle wave C’s diagonal which remains incomplete but with ultimate downside targets towards 18.42+/-. This is derived by extending cycle wave A by a fib. 138.2% ratio.
XOP Index and Fibonacci Price Ratio Analysis
Note how this very different fib-price-ratio measurement forms a convergence-matrix at the same level basis the weekly chart shown earlier. When something like this happens, it draws the price action towards it like iron filings to a magnet!
There are some other interesting attributes to the expanding flat pattern. An overlay of fib-time-ratios has been a useful exercise. Fib-Time-Ratios are unlike conventional cycle-intervals or periodicities because they can connect to alternating highs/lows or some derivative of that, rather than adhering to a strict high-high/low-low pattern. They are more dynamic too – whereas cycle analysis maintains a constant 100% interval between a repeating high-high or low-low, fib-time-ratios extend the time-interval by 61.8% or inversely 161.8% in the same manner that fib-price-ratios do.
And so, in the monthly XOP chart, we can see three examples of this. The first connects cycle wave A’s low of 91.56 to the Oct.’11 low of 150.68 then extends this by a fib. 161.8% ratio to the low of primary wave 1 at 88.24 in Jan.’16 (small deviation). Then, connecting primary wave 1’s low at 88.24 to primary wave 3’s low at 29.48 then extending this by a fib. 61.8% ratio which projects a time-line for ending primary wave 4 in Sep.’22. And finally, extending primary wave 2 from 181.80 to wave 4’s projected high at 118.00 in Sep.’22 by a fib. 61.8% ratio projects a terminal low for wave 5’s low into March 2025!
Conclusion
This analysis is an academic study of a medium-term Elliott Wave forecast but it also has merit for trading over the next months too. Aligned to our current Crude Oil and Brent oil forecasts, even Natural Gas, there’s enough pattern correlation combined with price-analysis to benefit from rising prices over the next couple of years. It must be said that the current advance from March’s low of 29.48 looks temporarily exhausted with upside limitations (currently 53.62). But there’ll be another opportunity to buy into the XOP index/ETF once a correction has completed in the underlying energy contracts sometime within the next couple of months. After that, it’s up-and-away towards 118.00+/-.
To subscribe, click here:
Institutions
Comments
2 Responses to “XOP Oil and Gas Index/ETF – Advance”
Leave a Reply


May 13th, 2020 @ 1:00 pm
Wow, excellent analysis. Thanks for sharing that information.
May 13th, 2020 @ 1:17 pm
We are pleased that you find the analysis helpful. Wishing you a beautiful day. WaveTrack