GBP/AUD – BE THOROUGH, KNOW THE BIG PICTURE!
by WaveTrack International| July 24, 2017 | 2 Comments
GBP/AUD – Post-Brexit
The International Monetary Fund has just announced a downgrade in its growth forecasts for the U.K. economy. It is revising the 2017 expansion by 0.3% – from 2.0% per cent to 1.7% per cent. This is the first time it has adjusted the figures post-Brexit.
Sterling/British Pound has recently traded higher against the US$ dollar prior to the GDP release but this is more to do with US$ dollar weakness than sterling strength. The Pound is still struggling to gain upside momentum across several other currency crosses, including the Aussie Dollar – we thought to take a more in-depth look at the GBP/AUD.
Establishing Direction
The results of this Elliott Wave analysis reveals the current direction of the GBP/AUD but also something more interesting than this too. Yes, the direction is downwards at the moment. Shorter-term patterns show the October ’16 – May ’17 upswing ended a counter-trend zig zag pattern between 1.5791 and 1.7652. This explains why it has rapidly declined afterwards. The zig zag ended a 4th wave corrective upswing, the following decline has begun a 5th wave decline. But the real catch is inserting the larger five wave impulse decline that began from the earlier Sep.’15 peak of 2.2177 into the big picture. Knowing how this fits into the larger, longer-term pattern development will help you to avoid falling into certain traps later.
Know the Big Picture
The Elliott Wave Principle tells us that the direction of trend is determined by a five wave sequence. If you identify a five wave impulse pattern trading higher, that defines the direction of trend, vice-versa if the impulse pattern is declining. But there are exceptions – if the five wave impulse is in a terminal location, i.e. is itself a final 5th within the larger/aggregate pattern, or perhaps as wave C within a zig zag. In these cases, the direction of the impulse is about to go into reverse. There is another exception too, one which R.N. Elliott discovered that is actually, mostly underestimated because of its recurrence frequency – it’s the expanding flat pattern. This subdivides 3-3-5, so its third and final sequence unfolds into a five wave pattern, then following completion, trend changes into the opposite direction. The GBP/AUD weekly data-series provides us with an example of an expanding flat, but with an unusual twist.
Expanding Flat
Before taking a look at the expanding flat, let’s see how it fits into the long-term picture. The wave count of the GBP/AUD confirms its decline from the year-1865 period ended a five wave impulse pattern into the October 1976 low of 1.2840. A multi-decennial zig zag upswing has since begun where cycle wave A ended the initial advance into the Sep.’01 high at 3.0392. The quality of this advance which unfolded into a five wave diagonal remains the cornerstone or the foundation for the continuation of this long-term upswing. Wave B of the zig zag then ended its decline in March ’13 at 1.4381. This was a really deep correction, more than a typical fib. 76.4% retracement so there is a relative probability that wave B ended there with cycle wave C advances now underway.
Cycle wave C has begun lifting higher as primary wave 1 ending into the Jan.’14 high of 1.9187 – see fig #1. But after that, an unusual expanding flat has unfolded as primary wave 2 which is still working lower to this day. Unless you know the longer-term picture, it would be easy to misinterpret this advance from 1.4381 to the Aug.’15 high of 2.2177 as ending a counter-trend zig zag with trend now downwards – but it can’t be if the preceding uptrend was already established in cycle wave A’s five wave diagonal advance mentioned earlier – neither can cycle wave B extended lower because it was already very deep when it completed at 1.4381. And so, through a logical process of deduction, we arrive at this latest count where primary wave 1 of cycle wave C ended an initial advance to 1.9187 with wave 2 following but unfolding into an expanding flat.
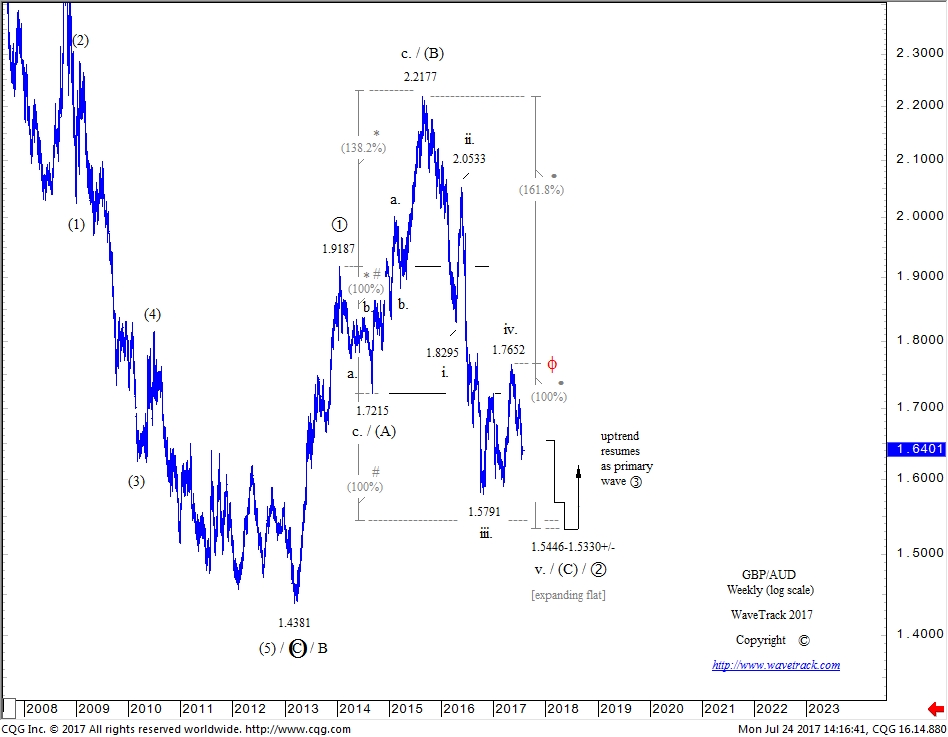
GBP/AUD – Weekly Chart
Fibonacci-Price-Ratios
There are common Fib-Price-Ratios that govern expanding flat patterns and these help identify their completion. For example, once the initial swing has unfolded as wave (A) of the pattern, extending this by a fib. 14.58%, 23.6% or 38.2% (subliminal) ratio, above and below, sets targets for completing waves (B) and (C). These tend to form the measured reversal levels about 80% per cent of the time. About 15% per cent end outside of this range at the fib. 61.8% ratio level and the remaining 5% per cent extend to what we describe as expansive ratios, i.e. 100%, 1.236%, 138.2%. In other words, the inverse of subliminal ratios. These are rare, but occasionally, we manage to identify one – and yes, this applies to primary wave 2 of the GBP/AUD count.
GBP/AUD and the Expanding Flat pattern
The origin of primary wave 2’s expanding flat begins from 1.9187 with intermediate wave (A) declining into a short retracement to 1.7215 – see fig #1 again. Wave (B) then staged a huge advance to 2.2177, extending wave (A) by a fib. 138.2% ratio whilst subdividing into a required three wave zig zag pattern. Then finally, wave (C) declines unfold into a five wave impulse pattern labelled in minor degree, i-ii-iii-iv-v. Note that minor wave iv. ended recently at 1.7652 as a zig zag with minor wave v. five in decline now. We haven’t entirely written-off the idea that minor wave iv. four is set to bounce higher now but range trade into a more complex pattern, i.e. triangle. However, what this wave count does prove is that the impulse decline as intermediate wave (C) remains incomplete. Downside targets are to min. 1.5446. This is derived from extending wave (A) by a fib. 100% ratio and the lowest of the two targets at 1.5330+/- is derived by extending minor waves i-iv one-four by a fib. 61.8% ratio.
GBP/AUD – Summary
Summing up, it seems that interpreting an expanding flat as primary wave 2 seems far-fetched because of the normal parameters that define the dimensions of the pattern. But when placed into the context of the longer-term pattern, we begin to see the true path of its ongoing development.
Ensure you’re tracking our forecasts – subscribe online for the EW-COMPASS REPORT.
Check out WaveTrack’s latest CURRENCY VIDEO @ CURRENCIES and INTEREST RATES VIDEO PART III and subsribe to our latest EW-COMPASS report!
Comments
2 Responses to “GBP/AUD – BE THOROUGH, KNOW THE BIG PICTURE!”
Leave a Reply

Recent Posts
Recent Comments
Archives
- June 2025
- March 2025
- February 2025
- January 2025
- December 2024
- August 2024
- July 2024
- June 2024
- May 2024
- April 2024
- February 2024
- January 2024
- December 2023
- August 2023
- July 2023
- June 2023
- March 2023
- February 2023
- January 2023
- December 2022
- November 2022
- October 2022
- August 2022
- July 2022
- June 2022
- May 2022
- March 2022
- February 2022
- January 2022
- December 2021
- August 2021
- July 2021
- June 2021
- March 2021
- February 2021
- January 2021
- December 2020
- November 2020
- August 2020
- July 2020
- June 2020
- May 2020
- April 2020
- March 2020
- February 2020
- January 2020
- December 2019
- October 2019
- September 2019
- July 2019
- June 2019
- May 2019
- April 2019
- March 2019
- February 2019
- January 2019
- December 2018
- November 2018
- September 2018
- August 2018
- July 2018
- June 2018
- May 2018
- April 2018
- March 2018
- February 2018
- January 2018
- December 2017
- November 2017
- October 2017
- September 2017
- August 2017
- July 2017
- June 2017
- May 2017
- March 2017
- February 2017
- January 2017
- December 2016
- November 2016
- October 2016
- September 2016
- August 2016
- July 2016
- June 2016
- May 2016
- April 2016
- March 2016
- February 2016
- January 2016
- December 2015
- November 2015
- October 2015
- September 2015
- August 2015
- July 2015
- June 2015
- May 2015
- April 2015
- March 2015
- February 2015
- January 2015
- December 2014
- November 2014
- October 2014
- September 2014
- August 2014
- July 2014
- June 2014
- May 2014
- April 2014
- March 2014
- February 2014
- January 2014
- December 2013
- November 2013
- October 2013
- September 2013
- August 2013
- July 2013
- June 2013
- May 2013
- April 2013
- March 2013
- February 2013
- January 2013
- December 2012
- November 2012
- October 2012
- September 2012
- August 2012
Categories
- ADXY Index
- Agnico Eagle Mines
- Alcoa
- Amazon
- AngloGold Ashanti
- Antofagasta
- APPL
- Apple
- ASX 200
- AUD vs USD
- AUDNZD
- AUDUSD
- Australia ASX 200
- Baltic Dry Index
- Banking
- Base Metals
- Biotechnology
- Bitcoin
- Bovespa
- Broadcom
- Catalexit
- central banks
- Christmas
- Commodities
- Commodities Video Outlook 2020
- Conference
- Copper
- Coronavirus Sell-Off
- CRB
- Crude oil
- crude oil price chart
- CryptoCurrency
- Currencies
- Currencies + Interest Rates Video Outlook
- Cycles
- Dax 30
- deutsche bank
- Dewey Cycle
- DJ Transportation Average
- DJ Utilities
- Dow Jones 30
- Dow Theory
- ECB
- economy
- Elliott Wave
- Elliott Wave Charts
- Elliott Wave Patterns
- Elliott Wave Principle
- Emerging Markets
- Ending-Diagonal Elliott Wave Pattern
- Equity
- EUR vs CHF
- EUR/USD
- Euro / US$
- Eurostoxx 50
- EuroStoxx50
- EuroStoxxBanks
- EURUSD
- Expanding Flat Pattern
- FAAMG
- FANG+
- fib-price-ratio
- Fibonacci Trading
- Fibonacci-Price-Ratio
- Financial Forecasting
- Fixed Income
- forex
- Freeport McMoran
- FTSE 100
- Fund Management
- FX
- FXStreet
- GBP/AUD
- GBP/USD
- GDX
- GDXJ
- Germany 10 year Euro Bund future
- Gilead Sciences
- Glencore
- Global Economy
- Gold
- Gold Mining
- Golden Ratio
- goldman sachs
- Google Inc.
- Google/Alphabeth
- Greek debt crisis
- Hang Seng
- Harbinger
- Hungarian Forint
- IBEX 35 Index Spain
- Independent Research
- India-CNX Nifty 50
- Interest Rates
- Interview
- IRP Independent Research
- kbw bank index
- Lonmin
- McDonald's
- MID-YEAR VIDEO UPDATE!
- Mifid II
- Mines
- Mining
- MSCI China
- MSCI Emerging Markets
- Nasdaq 100
- Nasdaq Biotechnology Index
- Nasdaq Composite
- Nasdaq100
- Netflix
- Newmont Mining
- Nikkei 225
- NVIDIA
- NYSE Composite Index
- Palladium
- Platinum
- Precious Metals
- Ralph Nelson Elliott
- Reversal-Signature
- Russell 2000
- Russia RTS
- S&P 500
- Sector
- Secular-Bull
- Sentiment Survey
- Shanghai Composite Index
- Silver
- Slanting Flat Elliott Wave Pattern
- SP100
- SP400 Mid-Cap
- SP500
- SPX 500
- STLG/AUD
- Stlg/US$
- STLG/USD
- STLG/YEN
- STLG/ZAR
- Stock Index
- Stock Index Tracking
- Stock Index Video
- Stock Indices
- Stock Indices Video Outlook 2023
- Stock Indices Video Outlook 2025
- Sugar
- Summary
- Tesla
- Tesla Inc
- Toyota
- Track Record
- trading
- Trusts
- Tutorial
- Uncategorized
- UniCredit
- US
- US Dollar Index (DXY) (USDX)
- US$ Index
- US-Dollar Index
- US10yrYields
- USD
- USD/ARS
- USD/CNY
- USD/IDR
- USD/INR
- USD/MXN
- USD/SGD
- USD/THB
- USD/YEN
- USD/ZAR
- Vale
- Value Line Index
- video
- VIDEO OUTLOOK 2018
- VIDEO OUTLOOK 2020
- VIX
- W.D. Gann
- WaveTrack International
- XAU Gold/Silver Index
- Xetra Dax
- XOP
- Yields
- Zig Zag
- Zinc
- ‘INFLATION-POP’
- ‘SHOCK-POP-DROP’
July 24th, 2017 @ 11:13 pm
Very interesting, Thanks. I’ve been struggling with GBPAUD for a while and this certainly helps.
August 3rd, 2017 @ 4:39 pm
Thanks you for your comment. We hope the GBPAUD information Peter provided was useful. Very best wishes. WaveTrack.