USD Dollar Index | EUR/USD – Fib-Price-Ratio Tutorial
by WaveTrack International| August 14, 2017 | No Comments
USD Dollar Index | EUR/USD
It is almost two weeks ago that we published an Elliott Wave example of how to measure the termination of a 5th wave extension. In this case a 5th wave within an ‘expanding-impulse’ pattern – read USD Index article here. Our chosen subject was the USD dollar index (DXY) and its five wave decline that began from 96.51 ending into the early August low at 92.55. The application of Fib-Price-Ratios and phi creating a ‘golden-section’ by using 61.8 and its reciprocal 161.8 is a common phenomenon. This Fib-Price-Ratio can be used on a daily basis to determine the terminal high or low of an ‘expanding-impulse’ pattern. In this earlier example, extending waves (i)-(iv) by a fib. 61.8% ratio projected the terminal low for wave (v).
In this latest example for the US$ dollar index and the EUR/USD, we use the reciprocal 161.8% ratio.
Fibonacci-Price-Ratios
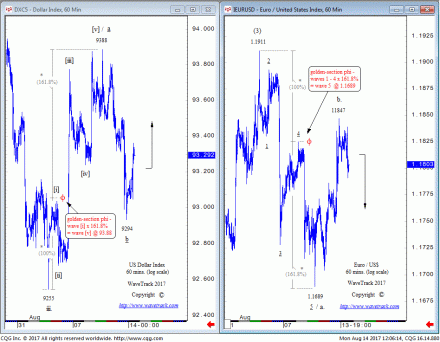
With the DXY low at 92.55 confirming the end of its five wave decline, the index begins a larger counter-trend upswing, beginning with a five wave advance as minute wave a – see fig #1, left. This five wave pattern is classified as an ‘expanding-impulse’ because one of its impulse sequences, [i]-[iii]-[v] has undergone ‘price-expansion’, one sequence being obviously larger than the other two, in this case, a common 3rd as minuette wave [iii].
Extending minuette wave [i] by a fib. 161.8% ratio projects within a few pips of the terminal high of wave [v] at 93.88, a common fib-price-ratio relationship.
By comparison, the EUR/USD declined synchronously from 1.1911 as the same five wave ‘expanding-impulse’ pattern ending at 1.1689 – see fig #1, right. In contrast, though, a slightly different application of the 161.8% ratio is used. Relative to wave 1, wave 4 is a very deep correction, even approaching the overlap of wave 1. When 4th waves unfold deeply like this, we tend to find a frequency recurrence where waves 1-4 is extended by a fib. 161.8% ratio – same ratio, different location for the measurement. This projected the EUR/USD to the exact low of 1.1689.
So there it is. Using a fib. 161.8% ratio to project the terminal high/low of an ‘expanding-impulse’ pattern but two slightly different concepts of expression! These are common ratios to watch for and they recur throughout the week. Now see if you can identify some!
Learn how to take advantage of WaveTrack’s Fibonacci-Price-Ratios!
Watch WaveTrack’s Fib-Price-Ratio videos on youtube to see how these measurements are applied. WaveTrack’s first Elliott Wave Academy video
Ensure you’re tracking our forecasts – subscribe online for the EW-COMPASS REPORT.
Visit us @ www.wavetrack.com and subsribe to our latest EW-COMPASS report!
Check out WaveTrack’s latest CURRENCY VIDEO @ CURRENCIES and INTEREST RATES VIDEO PART III and subsribe to our latest EW-COMPASS report!
Comments
Leave a Reply


