Crude Oil – Elliott Wave Tutorial – When is a diagonal not a diagonal?
by WaveTrack International| February 7, 2020 | 3 Comments
Elliott Wave Tutorial – Example Crude Oil
When is a diagonal not a diagonal?
The Elliott Wave Principle (EWP) wouldn’t be a tangible predictive methodology without rules and guidelines. Without these qualities, financial price development becomes a mass of random, subjective choices that can only lead the trader into blind alleys. Deviation from prescribed tenets is not advised, otherwise chaos rules. But there are times when a fixed set of precepts can, on occasion, be just as misleading if the observer is unbending. And this comes down to our very own perception of things, of the markets.
The trick is to maintain some sort of openness to variations of the theme. Nature is replete of examples of anomalies to the rule. And financial markets, Elliott Wave patterns, are no exceptions. These anomalies don’t come around every day of the week, but denying their existence is nothing other than a bad bout of cognitive dissonance!
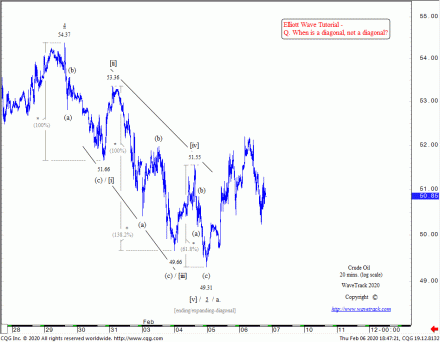
A good example of an exception to the ordained rule was visible in recent activity in Crude Oil – see fig #1.
You’re looking at the 5th wave within a declining five wave impulse pattern that began from January’s high of 65.65. It’s labelled minute wave 5 beginning from 54.37. The pattern has taken the form of an ending/expanding-diagonal. The Elliott Wave pattern is composed of a five wave subdivision, [i]-[ii]-[iii]-[iv]-[v]. The boundary lines connect waves [i]-[iii]-[v] and [ii]-[iv]. Each impulse sequence, [i]-[iii]-[v] can be seen subdividing into a required (a)-(b)-(c) zig zag – even fib-price-ratio measurements fit the diagonal perfectly, where wave [i] x 138.2% = [iii] and [iii] x 61.8% = [v].
The completion of the diagonal at 49.31 would then require a strong push higher afterwards to validate the count. And yes, it did that too. But there’s an Elliott Wave anomaly in the diagonal.
Question – When is a diagonal not a diagonal?
Can you see the anomaly? [pause here before reading on – the answer is just below]
Answer and Crude Oil Example
The anomaly is the fact that the diagonal does not contain overlapping 1st and 4th waves. For example waves [i] and [iv] do not overlap from the low of 51.66 and the high of 51.55. As a result, a slight margin of error.
Overlap is actually a function of diagnosing a diagonal. It’s a condition of the pattern itself. But does that mean this diagonal is invalidated?
Absolutely not. This is a minor infringement of the guidelines and it’s certainly a rare anomaly. However, there are just too many other conditions that have been satisfactorily adhered to.
Conclusion
Being open to variations of a theme is good practice. This isn’t an edict to discard solid rules and guidelines, principles that are at the very core of Elliott Wave Theory. It’s simply a lesson in keen observation – trust yourself.
Peter Goodburn is the senior Elliott Wave analyst at WaveTrack International and is the author of the monthly institutional Elliott Wave-Navigator report and the bi-weekly individual investor Elliott Wave-Compass report.
For information to subscribe to the annual 2020 VIDEO REPORTS – please click these links: alternatively, details @ www.wavetrack.com
PART I – Stock Index Video Outlook 2020!
PART II – Commodities Video Outlook 2020!
PART III – COMING SOON!
Comments
3 Responses to “Crude Oil – Elliott Wave Tutorial – When is a diagonal not a diagonal?”
Leave a Reply


February 14th, 2020 @ 12:57 pm
when is the next cycle low due in crude? I was thinking 2023?
February 14th, 2020 @ 1:07 pm
…agreed – the next monthly cycle time-series low is in July 2023. Best wishes.
February 15th, 2020 @ 11:27 pm
Great content! Super high-quality! Keep it up! 🙂