STOCK INDEX VIDEO – Code Word “Re-Synchronisation”
by WaveTrack International| May 26, 2016 | 2 Comments
ANNOUNCEMENT | 24th May 2016
MID-YEAR ELLIOTT WAVE VIDEO SERIES – PART I/III – STOCK INDICES
Elliott Wave Price Forecasts & Cycle Projections for 2016/17
Re-Synchronisation of Developed vs. Emerging Markets!
We’re pleased to announce the publication of WaveTrack’s mid-year video update of medium-term forecasts for STOCK INDICES!
Since the inaugural edition of the EW-Compass report was published, you’ve asked for accompanying medium/long-term analysis in gaining a broader perceptive of Elliott Wave pattern development for many of the world’s major indices. So we’ve taken many charts from our institutional Elliott Wave Forecast database and compiled them into a video series, publishing each December/January, exactly for this purpose in preparation for the coming year.
As the demand for more indices grew, so did our task in maintaining them to a sufficient standard – no problem! So now, we’ve set aside sufficient resources to ensure the medium/long-term outlooks are sent to you – not just once but TWICE a year!
There are over 120 charts being maintained round the clock so it’s necessary to split the videos into THREE parts – Part I STOCK INDICES, PART II COMMODITIES & PART III CURRENCIES & INTEREST RATES.
PART I Stock Indices VIDEO is available NOW!
This latest update of U.S., European and Global/Emerging market indices covers 40 newly illustrated Elliott Wave forecasts of the medium and long-term time-series. Our Chief Elliott Wave analyst and Founder of WaveTrack International, Peter Goodburn is again your host. Once again, he talks us through all of the main themes and up-coming changes that are apparent within the pattern development of the major markets. He also illustrates some of the major cycles for the benchmark S&P 500 index, expounding his articulate knowledge of cyclicity obtained from his 25-year study of luminaries such as Edward Dewey and W.D. Gann.
The stock index list includes medium/long-term Elliott Wave analysis for the following:
• Recap of S&P forecasts of last several years
– Performance – Secular-Bear vs. Secular-Bull
• Comparative Charts of Developed Markets vs. Emerging Markets:
– highlighting Re-Synchronisation
• Affirmation of last year’s S&P forecasts
– extended 3rd or 5th wave development
• Weekly S&P composite cycle and its trend for the next 12-18 month period
• S&P Elliott Wave counts for the next several months incl. specific target levels
• Another look at the 18yr and 43.5yr cycles
• S&P from the Great Depression lows and ultimate targets
• Dow Jones & Fibonacci perfection!
• Nasdaq 100 – positive correlation and 6-12 month price objectives
• Russell 2000 – small-cap outlook
• Sectors – KBW Banking Index
• Sectors – Nasdaq (NBI) Biotechnology
• Europe – Eurostoxx 50
• Europe – Xetra Dax
• MSCI Emerging Market Index – RE-SYNCHRONISATION
• MSCI BRIC (Brazil-Russia-India-China)
• Brazil – Bovespa Index
• Russia – RTS Index
• India – Sensex Index
• China – MSCI China Index
• Shanghai Composite
• China Enterprises
• MSCI Hong Kong
• Hang Seng
• Singapore Straits Times
• Australia – All-Ordinaries
• Japan – Nikkei 225 Index
Peter’s work is absolutely unique – you’ll be taking a look at Elliott Wave counts never seen anywhere else – GUARENTEED!
His 25-years of ground-breaking research into the seamless adherence of pattern development unfolding within specific geometric, Fibonacci dimensions provides the foundation for all the Elliott Wave forecasts shown in this video. This has enabled Peter to identify major directional changes ahead of time over the last sixteen years – for example:
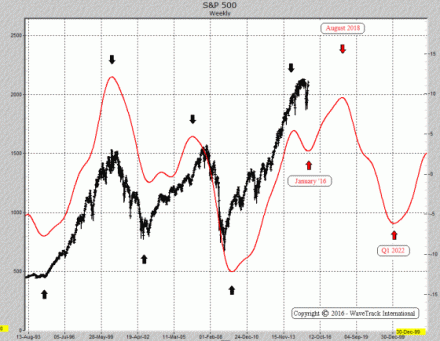
In last December’s Stock Index update, Peter described how major indices were trending lower but with the S&P’s cycle analysis signalling a major low in late-January/February – see this cycle analysis below…
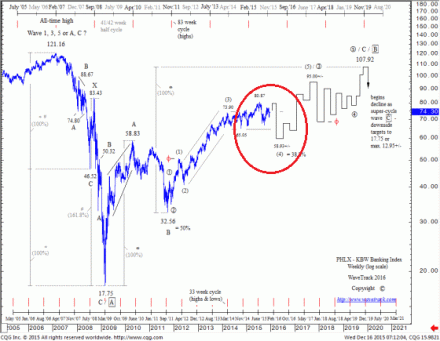
…and how the KBW Banking Index was finalising a major low before resuming its medium-term uptrend…
These were just two hints that markets were going to get off to a shaky start, but then turn around to resume larger uptrends!
Get Up-to-date on the next 6-month outlook – & beyond!
As an Elliott Wave Compass subscriber, we’ve ensured you have access to this Institutional–grade analysis at very modest expense.
PART I Stock Indices VIDEO is available now, at only $48.00!
We’ll send you a personal link so that you can watch the video, anytime at your convenience.
And if you’d like to subscribe to the up-coming COMMODITIES & CURRENCIES videos in PART II & PART III, you can receive ALL THREE for $96.00! – that’s a saving of 33% per cent!
• Single Video – $48.00
• Triple Package offer – $96.00 (saving 33%)!
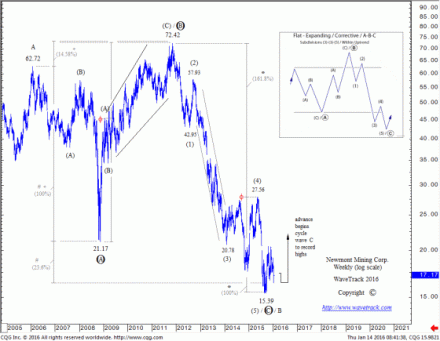
If you saw the EW forecasts for the COMMODITIES Video published in January’s PART II update, you’d find that downside targets were successfully achieved!…here’s an extract:
Since then, Newmont Mining has traded higher by an amazing +108% per cent!
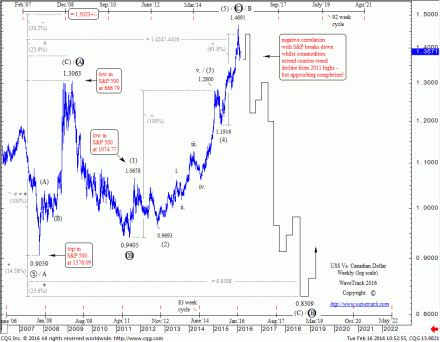
And if you followed the CURRENCY video in combination with the Emerging Market and Commodity outlooks, you would have been fully prepared for a big change in the US$ dollar, and related EM/Commodity Currencies, like the Canadian Dollar:
CONTACT US NOW VIA EMAIL – SELECT YOUR PACKAGE
Single Video – $48.00 – PART I STOCK INDICES
Triple Package offer – $96.00 (saving 33%)! – PART I – PART II – PART III
PARTS II & III will be available in a few weeks’ time – we’re working on it!
HOW CAN YOU RECEIVE THE VIDEO FORECAST?
To receive your VIDEO UPDATE please click here to contact us.
– Please state if you wish to purchase the SINGLE VIDEO for STOCK INDICES for USD 48.00?
– Or opt for the TRIPLE PACKAGE for USD 96.00 in total?
– Next we will send you a PayPal payment request and provide you with the video link & PDF report once confirmed.
We’re sure you’ll reap the benefits – don’t forget to contact us with any Elliott Wave questions – Peter is always keen to hear you views, queries and comments.
Most sincerely,
WaveTrack’s Elliott Wave Team
Visit us @ www.wavetrack.com
Comments
2 Responses to “STOCK INDEX VIDEO – Code Word “Re-Synchronisation””
Leave a Reply


May 27th, 2016 @ 2:52 pm
Hi,
one question. This video series was included for EW-Compass subscribers so far, Aren’t they going to be included any more ?
thanks and best Regards
Fran
May 27th, 2016 @ 3:40 pm
Hello Fran, Thanks for your message. The preparatory work for the video is enorm (data, analysis, chart prep etc.) for our EW-team and the production itself is over an hour which made it uneconomic withing the EW-Compass report. In order to keep the EW-Compass as low cost as possible our team decided to make a spin off rather then raising the EW-Compass cost altogether. So yes, the videos are not a part of the EW-Compass package anymore. We hope this answers your question and most of all wish you a great day.