SP500 – Symmetry in Motion – Expanding Flat
by WaveTrack International| January 23, 2020 | No Comments
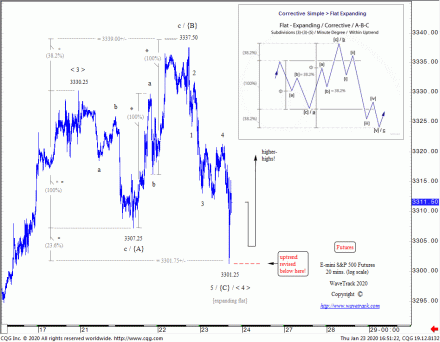
The SP500 has just completed a short-term {A}-{B}-{C}, 3-3-5 Expanding Flat pattern at 3301.25. This confirms a continuation to the upside over the next few trading-days
SP500 – Symmetry in Motion – Expanding Flat
The SP500 is closing-in on reaching upside targets for the completion of October’s five wave impulse uptrend. Activity so far this week is confirming one additional but final push higher following the completion of an {A}-{B}-{C}, 3-3-5 expanding flat pattern that ends a 4th wave correction from last Friday’s high of 3330.25 into today’s low, traded just a moment ago, at 3301.25.
SP500 and Fibonacci Price Ratios
Note the 3-3-5 wave structure of the expanding flat. Wave {A}’s decline unfolded into a typical zig zag ending at 3307.25. Wave {B}’s advance was another zig zag, this time, unfolding where waves a and c measure by a fib. 100% equality ratio into the high at 3337.50. And finally, wave {C}’s decline as a five wave impulse pattern ending at 3301.25.
And now, corroborating the expanding flat, fib-price-ratios can be overlaid to the pattern. For instance, extending wave {A} by a fib. 38.2% ratio projects the upside completion of wave {B} to 3339.00+/-. Also, extending wave {A} by a fib. 23.6% ratio projects wave {C} to 3301.75+/-. Not bad!
Conclusion
The completion of the expanding flat pattern confirms the prevailing uptrend is still engaged to the upside. However, it will be negated should the SP500 break more immediately below 3301.25. Looking ahead, any higher-high will most likely be the concluding sequence to October’s larger five wave uptrend.
Insights to WaveTrack’s SP500 longer-term forecasts you can get by purchasing PART I of our annual video-trilogy of long/medium-term ELLIOTT WAVE price-forecasts:
• PART I – STOCK INDICES Video Outlook 2020 – OUT NOW!
Click here to read more about the video – Part I.: STOCK INDICES
WaveTrack’s Elliott Wave Compass report
Get WaveTrack’s latest SP500 forecasts by subscribing to the Elliott Wave Compass report.
The ELLIOTT WAVE COMPASS report focuses on the shorter-term perspective of price development. The report is comprised of two online updates per week describing and illustrating a cross-section of market trends/counter-trends for stock indices, bonds, currencies and commodities from around the world. This report is ideal for professional and private clients trading a time horizon of just a few days to a few weeks ahead.
The bi-weekly EW-Compass report offer short-term perspective for global markets
· Stock Indices
· Bonds
· Currencies (FX)
· Commodities
If you like to know more details about the Elliott Wave Compass report click here, please click here
Comments
Leave a Reply

