SP500 and Nasdaq 100!
by WaveTrack International| May 13, 2019 | 5 Comments
REVERSAL-SIGNATURE!! – SP500 and Nasdaq 100 Decline in 5 Wave Impulse from May Highs – Multi-Month Corrective Downswing Underway
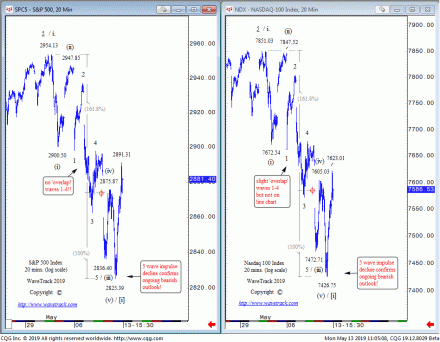
Both the SP500 and Nasdaq 100 cash indices have declined from their early-May highs into last week’s lows into a 5 wave impulse pattern. This confirms a larger, multi-month corrective downswing has begun minor wave ii. two, a regression following the completion of minor wave i. one’s uptrend that began last December. Sell into this week’s bounce!
Last week’s declines in the major U.S. indices have now developed lower into five wave impulse patterns. From the May 1st highs into last week’s lows. Friday’s EW-Navigator Supplemental report was unable to identify this Elliott Wave pattern in the futures but it is very evident in the cash indices – see fig #1 [SP500, left] & [ Nasdaq 100, right]. This is confirming December’s five wave uptrend ended minor wave i. one into the early-May highs. For the SP500 at 2954.13 and for the Nasdaq 100 at 7851.03. It also confirms a multi-month corrective downswing has begun minor wave ii. two.
For downside targets, please review Friday’s EW-Navigator Supplemental Report
Conclusion
The opening U.S. session has seen sharp declines following Friday’s late recovery upswing. It’s possible that these declines will be supplanted by another reattempt towards Friday’s late-session highs before larger declines resume to the downside. But this will be obvious within the next couple of hours because any failure to accelerate immediately lower would otherwise indicate a short-term upside recovery.
Learn more about WaveTrack’s Elliott Wave services and where to subscribe:
Institutions – subscribe here
Private Investors – EW-Compass report subscribe here
Comments
5 Responses to “SP500 and Nasdaq 100!”
Leave a Reply


May 13th, 2019 @ 11:17 pm
Looks like wave iv would now need to be moved up to 2891 in S&P based on todays price action. Todays low then is possibly wave v?
May 14th, 2019 @ 8:43 am
Hello Jay, Yes, our EW-team would agree with you! Especially, since the equivalent futures contract declined into a zig zag from last Friday’s high into the low. That makes the 4th wave as an expanding flat. Thanks again!
May 15th, 2019 @ 5:42 am
Can the move from the December low be one degree higher than what you seem to think? and Dow Industrial truncation? Such a combination would be so bearish. How do you eliminate such a possibility? Thanks
May 15th, 2019 @ 9:51 am
Hi Ganesh, Thanks for your question. Our EW-team had to interprete your question a little bit. We are hoping that we have understood correctly. The December low is labelled intermediate wave (4) with wave (5) set to continue higher into a minor degree impulse pattern over the next 2-3
year period. April’s high ended minor wave i. one, with ii. two now in downside progress. But December’s low is not considered +1 degree higher
because that would mean a major peak is forming, ending the secular-bull uptrend that began from 2009 low…that’s not probable…why?…a combination of aspects really.. Fib-price-ratio analysis helps to identify the wave counts correctly and these project much higher levels. Also, correlation studies with European indices, Asian indices and Emerging Markets all point much higher. All these aspects have to play together. Furthermore, the US$ dollar 15.6-year cycle turned down in 2017 and has a long way to fall. That will cause an ‘Inflation-Pop’ in commodity
prices. Most of these aspects form a concise picture of the future. What might be of interest to you is to review our Trilogy Video Series on these forecasts? We hope this was of some help to you and wish you much success!
May 14th, 2019 @ 12:01 pm
This is the obvious choice impulse and reversal, but looking at some market breadth indicators it is unlikely…. probably b/B.
For example McClellan Summation Index hitting extreme overbought level and expecting major top… it will not work.
Previous examples 2003/2009/2016 roughly 10 week up, 10 weeks flat/expanded flat 20 week cycle low and higher.
2003 – https://imgur.com/a/jspvoQz
2009 – https://imgur.com/a/LyiSarI
2016 – https://imgur.com/a/0SPvZ2H
Now look at DJ/RUT/NYSE – 1:1 time and price action as above… as I said more likely b/B.
P.S Monday looks like the bottom of w3 for this impulse