What has the SP500 and Nasdaq 100 in common?
by WaveTrack International| November 1, 2018 | 5 Comments
Three Wave Zig Zag Decline Completed for SP500 + Nasdaq 100
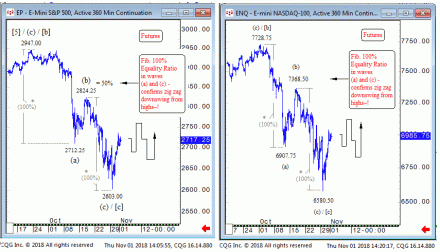
The SP500’s decline from September’s high has completed a three wave zig zag corrective pattern into last Monday evening’s low of 2603.00. This development changes this year’s expanding flat into developing triangle pattern. Turning this into a bullish outlook from current levels through to year-end and into H1-2019. The Nasdaq 100 follows the same pattern. Ending into zig zag from October high at 6580.50 and again turning this into a bullish outlook into year-end.
This year’s declines from January’s highs have been labelled as unfolding into an expanding flat corrective pattern as minute wave 4. However, it is now changing into a triangle. See latest EW-Compass Report.
The original expanding flat patterns were labelled [a]-[b]-[c], subdividing [3]-[3]-[5]. They were requiring a five wave downswing from the late-September/early-October highs. Hence, for the SP500 from 2940.91 (cash) and 2947.00 (futures) and for the Nasdaq 100 from 7700.56 (cash) and 7728.75 (futures). But we’ve detected a visible three wave zig zag pattern unfolding in wave [c]’s decline rather than a developing five wave sequence. The two downswings from 2947.00-2712.25 and from 2824.25-2603.00 measure equally. In case of the SP500 by a fib. 100% equality ratio (see SP 500 – inset left) and for the Nasdaq 100 from 7728.75-6907.75 and 7368.50-6850.50 (see Nasdaq 100 – inset right). This fits the characteristic of the zig zag. It therefore ends wave [c] but within a developing triangle because a triangle is labelled [a]-[b]-[c]-[d]-[e] but importantly, subdivides [3]-[3]-[3]-[3]-[3].
Conclusion
These zig zags confirm a good recovery can begin as wave [d] within the triangle. As a result, the SP500’s upside targets are aiming towards 2855.75+/- and Nasdaq 100’s towards 7544.00+/- into year-end, perhaps into January. Looking ahead, the triangle confirms minute wave 4 and upon completion, wave 5’s push to record highs.
Bi-weekly updates on the SP500, Nasdaq 100, US Dollar Index, Crude Oil, EuroStoxx, Russell 2000, Dow Jones 30, Dax, ASX200 and more! Don’t miss WaveTrack’s regular updates in our bi-weekly EW-Compass Report! Ensure you’re tracking our Forex forecasts – subscribe online for the EW-COMPASS REPORT.
Visit us @ www.wavetrack.com and subsribe to our latest EW-COMPASS report!
Comments
5 Responses to “What has the SP500 and Nasdaq 100 in common?”
Leave a Reply


November 1st, 2018 @ 3:12 pm
How are you labelling the October 3rd high? It fell short of the Sept.21 high.
November 1st, 2018 @ 6:16 pm
Hello Ja Sanderson, The Oct. 3rd high is probably a 2nd wave within the five wave declining sequence of sub-minuette wave (a)’s decline or perhaps a truncated 5th within the preceding impulse advance. Very best wishes
November 30th, 2018 @ 4:04 am
Looking back is it possible that a running flat correction ended in S&P at the Oct. 29 low of 2604? Wave C was within 3 points of wave A.
November 30th, 2018 @ 10:32 am
Hello Jay Sanderson, We presume you mean a running flat
from January’s high? – if, so the pattern must unfold [a]-[b]-[c] and subdivide 3-3-5…but wave [c]’s decline from late-September high into late-October low only unfolded into a THREE wave sequence (as you comment) and not a required FIVE. So from this standpoint the pattern should not be a running flat. We hope this is of help and wishing you a great day.
November 9th, 2018 @ 8:14 am
The triple nested extended flat crap did not played out…. I am shocked:)
There is no triangle either… how did you came up with that at all????
Either combination for wave 4 from 2009 or a-b-c January-April w4 from 2016 and ED wave iii of 5 running.
P.S. your Eurostoxx call for wave 1 wrong too , did you listen at all when I told you that w4 will not spend months below MA200?
Another “expert” on my list, which did not want to listen, next time more humble.