SP500 – End of Coronavirus Sell-Off
by WaveTrack International| March 23, 2020 | 4 Comments
SP500 – End of Coronavirus Sell-Off
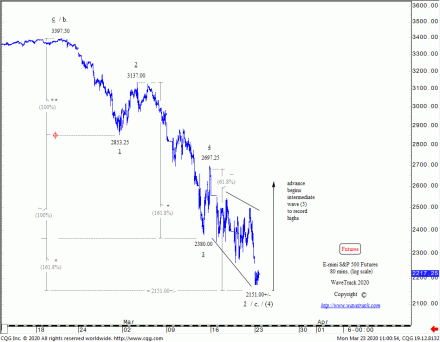
Last week’s downside targets of 2151.00+/- (futures) has been approached in overnight Asian/European trading to a low of 2174.00. This is in the price proximity for ending the entire five wave impulse downswing as minor wave c. from February’s high.
Meanwhile, an overnight sell-off in Japan’s Nikkei 225 traded to lower-lows. However, testing corresponding downside targets of 15722+/- to 15600 before staging a resounding bullish reversal-signature trading up to 18220.
In Europe, the benchmark Eurostoxx 50 and Xetra Dax indices have opened with a gap lower in the cash markets but have held above last week’s lows, triggering a bullish divergence with U.S. indices.
The US$ dollar index is testing overhead resistance around the 102.79+/- area. If all goes according to plan, last week’s high at 102.99 ended the entirety of the a-b-c zig zag correction that began from the Feb.’18 low of 88.26. A resumption of its 7.8-year cycle downtrend is about to begin.
Conclusion
The completion of multi-year expanding flat patterns across several global stock indices, including the benchmark SP500 is confirming the end of the coronavirus sell-off. A resumption of the secular-bull uptrend is about to get underway.
It will, of course, take longer for global economies to catch-up with gains in financial markets! However, the fact that major indices are already signaling a turn-around must be heralded as good news amidst the continuing efforts to stem the spreading of the coronavirus.
WaveTrack’s Elliott Wave Compass report
Get WaveTrack’s latest SP500 forecasts by subscribing to the Elliott Wave Compass report.
The ELLIOTT WAVE COMPASS report focuses on the shorter-term perspective of price development. Firstly, the report is comprised of two online updates per week. Secondly, it is describing and illustrating a cross-section of market trends/counter-trends for stock indices, bonds, currencies, and commodities from around the world. And above all, this report is ideal for professional and private clients trading a time horizon of just a few days to a few weeks ahead.
The bi-weekly EW-Compass report offers a short-term perspective for global markets
· Stock Indices
· Bonds
· Currencies (FX)
· Commodities
If you like to know more details about the Elliott Wave Compass report click here, please click here
Comments
4 Responses to “SP500 – End of Coronavirus Sell-Off”
Leave a Reply


March 24th, 2020 @ 3:34 pm
Is there going to be an minute abc pattern in this bottom pattern, where we test/ double bottom on a daily chart? Or has it already done that on a minut
basis… tia
March 24th, 2020 @ 9:04 pm
Hi Collin, Thank you for your message. We don’t expect any correction that makes a double-bottom ‘cos the decline was so rapid that this normally triggers a v-shaped reversal. Very best wishes