SP500 – Approaches Upside Targets!
by WaveTrack International| October 30, 2019 | 22 Comments
SP500 – Leading/Expanding-Diagonal Approaches Upside Targets!
What do U.S. and European stock markets have in common? Well, the list is extensive. However, from an Elliott Wave perspective, the most pertinent answer to this question is that both have evolved higher from their August lows into five wave impulse patterns. And even more important, they are completing just ahead of today’s Federal Reserve FOMC interest rate announcement – coincidence?
Nah, don’t believe in coincidences, especially when pattern alignments like this occur.
Yet, European indices have pulled higher from their August lows developing into five wave ‘expanding-impulse’ patterns whilst the benchmark SP500 index (futures) has developed into a five wave ‘diagonal-impulse’ pattern. The distinction between these two types of ‘impulse’ patterns is that one has a typical ‘extended’ wave, either 1-3-5. Whilst the other does not whilst exhibiting ‘overlapping’ sequences in waves 1-4. Tutorial over!
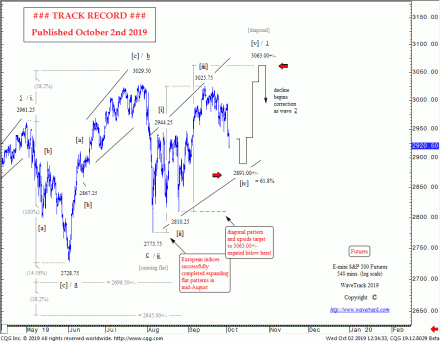
October 2nd ‘s report identified the SP500’s diagonal during its 4th wave correction – see fig #1. This is a leading/expanding-diagonal which is very difficult to identify. Unless you know the internal structure of the pattern and its relative proportional dimensions. The 4th wave was forecast ending
towards 2891.00+/- then turning higher to complete a 5th wave towards 3063.00+/-.
SP500 Fast-Forward
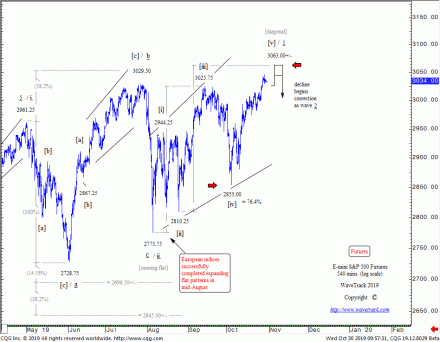
We can see how the 4th wave completed down to a momentary price-spike of 2855.00 but then turning higher to begin the 5th wave advance – see fig #2. Upside targets are being approached right now and could even have completed already into last night’s high of 3046.25.
SP500 – Conclusion
The approach to upside targets to complete the diagonal and the relative five wave uptrends in European indices can’t be a coincidence heading into today’s Federal Reserve FOMC interest rate announcement. However, it’s possible that once the rate decision hits the screens, the SP500 pops higher to 3063.00+/- but then declines afterwards. Buy the news, sell the fact! Either way, there’s a heightened risk of a reversal-signature today.
Find out what WaveTrack’s latest SP500 forecasts are and subscribe to the Elliott Wave Compass report.
The ELLIOTT WAVE COMPASS report focuses on the shorter-term perspective of price development comprising of two online updates per week describing and illustrating a cross-section of market trends/counter-trends for stock indices, bonds, currencies and commodities from around the world. This report is ideal for professional and private clients trading a time horizon of a just a few days to a few weeks ahead.
The bi-weekly EW-Compass report offer short-term perspective for global markets
· Stock Indices
· Bonds
· Currencies (FX)
· Commodities
If you like to know more details about the Elliott Wave Compass report and what contracts are covered please For more details, please click here
Comments
22 Responses to “SP500 – Approaches Upside Targets!”
Leave a Reply


October 30th, 2019 @ 3:57 pm
Is your wave count in AAPL also indicating a soon reversal? They report this afternoon, so it will be a key to future market direction.
October 30th, 2019 @ 5:08 pm
Wall Street analysts expect Apple to report
$62.9 billion in revenue and $2.84 in earnings per share, according to a Refinitiv analysis of over 33 analysts.
Elliott Wave: the two upswings from June’s low of 170.27 to late-July high of 221.37 and then from 192.58 up to yesterday’s high of 249.75 measure exactly equally (log scale), i.e. fib. 100% equality ratio – this is a measurement for a zig zag – also, if the April-June downswing from 215.31 to 170.27 is extended by a fib. 61.8% ratio, it projects a zig zag upswing to 248.52+/-. From this we can discern the possibility that an expanding flat is unfolding from May’s high where wave [a] ends at 170.27 and [b] into 249.75 – wave [c] has begun a larger five wave decline now – very short-term rally possible around the earnings release. Our EW-team hopes this is of help! Very best wishes, WaveTrack
November 4th, 2019 @ 3:52 pm
what woud be max overshoot above 249 on aapl?
November 13th, 2019 @ 3:52 pm
well its seems to be breaking the counts pattern extensionwise…
November 14th, 2019 @ 3:56 pm
I was looking at 263.5 as a possible target and then 274.
November 14th, 2019 @ 5:25 pm
Our EW-team had a look but they all agreed that AAPL is complex pattern…would take too long
to do analysis… as they are fully engaged in the end of year preparation… Normally, they are happy to take the time to check out patterns for blog question but at the moment this not possible. Very best wishes.
November 14th, 2019 @ 5:26 pm
Our EW-team had a look but they all agreed that AAPL is complex pattern…would take too long to do analysis… as they are fully engaged in the end of year preparation… Normally, they are happy to take the time to check out patterns for blog question but at the moment this not possible.
November 16th, 2019 @ 8:08 am
AAPL looks like impulse from the late August low 3=1,618×1 and 5=0,618x(1to3)
Before that it is challenging:)
If I have to bet I would say it is the same like the indexes a-b-c with triangle in the middle and two legs roughly the same size arithmetic scale or c=0,618xa logarithmic scale.
October 31st, 2019 @ 9:51 am
I am wondering which is more likely to see flying unicorn or expanding leading diagonal….. extremely rare to the power of extremely rare – good luck with that… wait and this is the start of wave 3 what a joke.
I will stick to simple a-b-c with a=c… like every other index in Europe and Asia or even US.
The big picture…. I do not know if I should cry or laugh – the bull market continues with 1-2 i-ii.
The bull market will not continue until we see w4 from 2009 finished in 2020 with 4 year cycle low. Quick look at every index and most of the shares and you will know what I am talking about.
For a while I was wondering if some trainee is writing this blog now I am sure:)
November 4th, 2019 @ 4:43 pm
w4 from 2009 finished?? Isn’t a wave 4 corrective? The market is up close to 600% from yhe 666 spx low of 2009… How does a corrective wave include a 6X00% reversal to the upside? Always thought up was impulsive… I can’t see that as corrective… why don’t you upload an image einstien?
November 5th, 2019 @ 10:07 am
Dear Collin, If larger upswing from Jan.’19 low of 142.00 is double zig zag, i.e. wave ‘b’ within complex correction, then first zig zag measures 100% equality to second zig zag upswing at 258.17+/-. Hope this is of help. Have a great day. EW-Team WaveTrack International
November 5th, 2019 @ 6:18 pm
Thanks for the rep[ly!
November 5th, 2019 @ 6:24 pm
You are most welcome! Have a beautiful day.
November 5th, 2019 @ 7:55 pm
Same to you an Team WaveTrack as well!
November 12th, 2019 @ 7:16 pm
= +/- 4-6 points i can assume or 2-4, or…?
November 12th, 2019 @ 10:41 pm
Each situation could vary depending on the subdivision of the pattern. Best wishes, WaveTrack
November 7th, 2019 @ 8:24 pm
Is there a slim chance that this current rally could lead in the short term to the finalization of primary wave 3 topping out at say 3500 level or is this intermediate wave of three of five or primary 3 topping out? Or am I off in all directions? Probably the later is my guess… 😉
November 7th, 2019 @ 8:27 pm
or is it the next iteration down??
November 16th, 2019 @ 9:24 am
Oh dear. Very difficult to get a grip on this markets count. Might need a count 2, 3 or even 4 for this one…..just won’t stop going up or to make head or tail of! Can it really be a series of 1-2, 1-2’s……?
November 18th, 2019 @ 6:21 am
It is not so complicated as you think.
Correction begun in Jan.2018 one zig-zag lower for 11 months, another zig-zag higher 11 months(top around the corner) and final sell of will follow to complete the correction.
From cycle perspective from mid-2015 we are seeing 4 year cycle high(Hurst 54 months) and from Feb.2016 4 year cycle low around mid-2020 is expected.
Just look at other indexes like NYSE DAX XLF and many others and you will see right away what is going on.
November 19th, 2019 @ 8:31 am
Very possible.
November 20th, 2019 @ 7:36 am
I actually posted a very long term chart of the Dow suggesting that we could be in an extended 5th of a 3rd of a 5th right now with more upside before any ensuing correction but the moderator removed it for some reason. It’s either that or you ABC….