S&P 500 weekly forecast
by m.tamosauskas| November 15, 2013 | 1 Comment
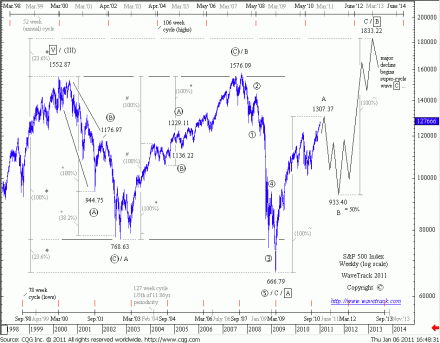
Back in the early 2011 we published this weekly S&P 500 forecast with ultimate upside target measured towards 1833.22. At that time it sounded a bit unrealistic taking into the account that S&P 500 had already made 600 points from the 2009 low. Well, now we are trading around 1790 and that translates into a 500 points advance. Now it seems like it was obvious, doesn’t it? 🙂
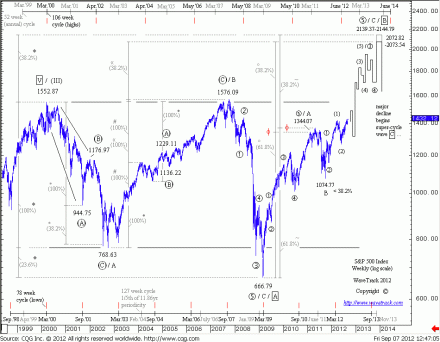
However, in 2012 we recognized a stronger fib. convergence at 2040 price level suggesting there is still enough upside potential left:
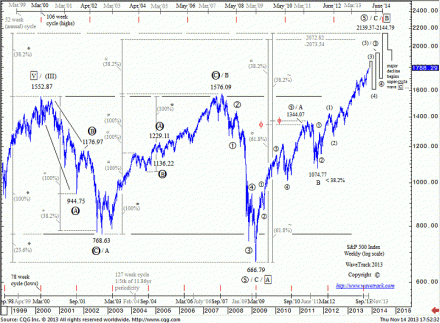
Even today the forecast remains the same and so far, there are no reasons to change it (of course, we will adapt to the market if it suddenly decides to do something crazy):
But the question is how do you feel now realizing that S&P 500 is headed for another 300 point boost? Sounds unrealistic as it was the case back in 2011. Momentum is obviously slowing (on a weekly basis), volume is waning, we are reaching extreme bullishness on various sentiment measurements and so on… But does it prevent from further upside continuation? Our opinion is no, unless we get a clear reversal. Quite opposite, we anticipate a panic spike up is set to follow once a healthy correction develops. A lesson to be learned – everything in the markets is possible!
Comments
One Response to “S&P 500 weekly forecast”
Leave a Reply


November 15th, 2013 @ 2:22 pm
I would say it (declining volume) rather confirms the view that S&P 500 is in a counter-trend upswing from the 2009 lows. Normaly, in a 5 wave expanding-impulse pattern the 3rd wave should be in the greatest volume.