REELIN’ IN THE YEARS! – A Look-Back to the Secular-Bull Uptrend of the 1990’s & New Updates!
by WaveTrack International| August 7, 2017 | No Comments
S&P 100 Index & Dow Jones 30 Index – Secular-Bull Uptrend Intact! – by Peter Goodburn
Mainstream Elliott Wave believe a financial collapse is imminent. However, WaveTrack’s analysis comes to a different conclusion. Let’s consider the arguments why a Secular-Bull Uptrend is still intact?!
‘Your everlasting summer
You can see it fading fast
So you grab a piece of something
That you think is gonna last’
I came across this chart of the S&P 100 whilst looking through our WaveSearch archives this w/end and thought how appropriate it would be to revisit a forecast of the past, somewhat forgotten, that I thought was gonna last!
Appropriate for two reasons – first, because it’s almost 18-years old and yet still remains valid to this day along with Fib-Price-Ratios et al. Second, it comes at a time when mainstream Elliott Wave analysis is forewarning of a similar approach to ending primary wave 5’s advance from the 2009 low. I’d like to comment on the qualities of the first and respond to the second.
Forecasting the end of the 1990’s Secular-Bull Uptrend
To gain confidence in forecasting the present, the future, we must rely on the timeless qualities of Natural Law applied in the past. If we can discover a consistent method within these Laws, then we increase the probability of understanding the path that lies ahead, in the future.
The final phase of the S&P 100’s secular-bull uptrend of the 1990’s is of particular interest because it embodies the concept of Fibonacci Ratio and Proportion as a complementary methodology to the Elliott Wave Principle (EWP). Applied correctly, it goes far beyond the subjective nature of the human mind that creates concepts according to its own belief system. Indeed, it adds empirical objective evidence, a combination of the quantitative qualities of geometric ratio and proportion along with the qualitative aspects of the EWP.
Fibonacci-Price-Ratios
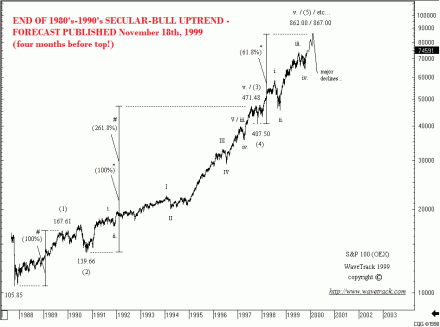
This chart, published on November 18th, 1999 labelled the entire 1990’s advance as unfolding into a five wave ‘expanding-impulse’ pattern. But more importantly, approaching a major, terminal high towards 862.00-67.00+/-. See fig #1.
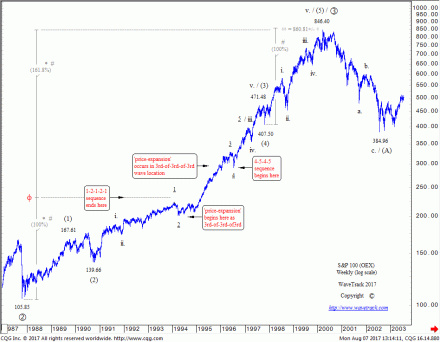
Labelled in intermediate degree, (1)-(2)-(3)-(4)-(5), wave (5) upside targets were derived where it unfolds by a fib. 61.8% ratio of wave (3). You may also notice that wave (3) unfolded by a fib. 261.8% ratio of wave (1) – whilst this fib-price-ratio can sometimes occur, we have since discovered this to be a rare recurrence. More likely, the initial 1-2-1-2-1 sequence between 105.85-223.60 is best extended by a fib. 161.8% ratio in order to project the final peak – alternatively, the final fifth wave unfolds by a fib. 100% equality ratio of the 1-2-1-2-1 sequence – see fig #2. The result is the same, however, with FIB-PRICE-RATIOS corroborating the approach of a TERMINAL PEAK.
History has since told the ongoing story. The end of the 1990’s BOOM eventually went BUST four months later from a peak of 846.40, just 16 points from the projection! The following collapse was later known as the dot.com BUST! And initiating the beginning of a primary degree, 4th wave correction that ultimately ended in March ’09.
An Imminent Top for Primary wave 5? – No!
Correlation studies feature as a main part of our Elliott Wave assessment. This has been instrumental in forecasting the correct pattern sequence unfolding for major global indices over the last several years (including the S&P 500 and the Dow Jones).
For example, global indices will end their respective Elliott Wave patterns and each form major peaks and troughs at approximately the same time. Actually, within several months of each other. This was the case when stock markets reached peaks in October 2007 ahead of the financial-crisis. And also at the end of its decline in Oct.’08 and March ’09. This was true when comparing U.S. indices against very different Elliott Wave patterns that were at terminal locations for European and Asian indices. It was also replicated across different asset classes, like Emerging Markets and Commodities.
Mainstream Elliott Wave
Mainstream Elliott Wave analysts are forecasting that there is a more imminent peak being approached by the major U.S. indices in the months ahead, in 2017. Would it not be more reasonable to expect similar terminal patterns being approached in European indices, Asian indices, Emerging Markets and Commodities? Because, if a terminal peak is being approached as primary wave 5, it would open the way for a systemic collapse. Why? Because it also ends a 5th wave in cycle degree that dates back to the Great Depression low of 1932. But are those other stock indices, Emerging Markets and Commodities in pattern alignment?
No, they are not.
Dow Jones 30 and why the Secular-Bull is still intact
In our annual report of 2015, published Dec.’14, we cited why the secular-bull uptrend of primary wave 5 would last into the end of the current decade. There were compelling reasons attributed to W.D. Gann’s 90-year cycle, a geometric Fib-Price-Ratio convergence-matrix in the Dow Jones index far above current levels. And just as important, the fact that other major indices, asset classes like Emerging Markets and Commodities were not in EW pattern alignment.
Since that report, we have updated the progress of these asset classes each month in the institutional EW-Navigator report and at 6-month intervals in our special Video Series, the last published in June (2017).
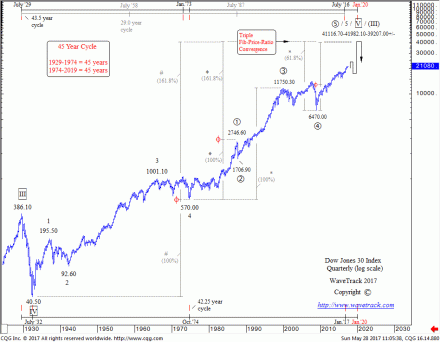
In these reports, we cited that the Dow Jones (DJIA) was still engaged in primary wave 5’s advance. This advance would ultimately prolong the secular-bull uptrend into the end of Gann’s 90-year cycle and with upside price targets to forty-thousand 40,000.00+/-. See fig #3. Three fib-price-ratio measurements were used over differing degrees of trend and each projected a convergence-matrix towards the 40,000.00+/- level. When a convergence like this occurs, it attracts the price activity towards it. Call it Fibonacci-Price-Ratio magic. Or in more scientific terms a ‘high-frequency recurrence‘.
Prolonging Primary wave 5’s Secular-Bull Uptrend
Let’s assume our analysis is correct. Then primary wave 5 IS NOT heading towards a terminal peak in the next few months. We are labelling primary wave 5’s advance from the March ’09 low of 6470.00 in intermediate degree, (1)-(2)-(3)-(4)-(5). This confirms the approach to a terminal high for intermediate wave (3) sometime into year-end (2017) or latest into Q1-2018.
The reason for not labelling this as a terminal peak for wave (5) is because other asset classes, Emerging Markets and Commodities only began the final phase of the ‘INFLATION-POP’ advance last year. Starting from the ‘RE-SYNCHRONISATION’ lows of Jan/Feb.’16. They are still in the relatively early stages of a 3-4 year uptrend. This doesn’t fit at all with mainstream perma-bear forecasts for an imminent collapse that begins a secular-bear decline. It’s far too early.
This year’s upside forecast projecting a terminal high as intermediate wave (3) is right on track. Once completed, it opens the way for a -20% or -25% per cent correction in major U.S. indices as wave (4). However, this is not nor can it be, the beginning of a secular-bear downtrend. It’s only a 4th wave correction, significant as it will be!
Learn how to take advantage of WaveTrack’s Fibonacci-Price-Ratios!
Watch WaveTrack’s Fib-Price-Ratio videos on youtube to see how these measurements can be applied. WaveTrack’s first Elliott Wave Academy video
Ensure you’re tracking our forecasts – subscribe online for the EW-COMPASS REPORT.
Visit us @ www.wavetrack.com and subsribe to our latest EW-COMPASS report!
Check out WaveTrack’s latest CURRENCY VIDEO @ CURRENCIES and INTEREST RATES VIDEO PART III and subsribe to our latest EW-COMPASS report!
Comments
Leave a Reply


