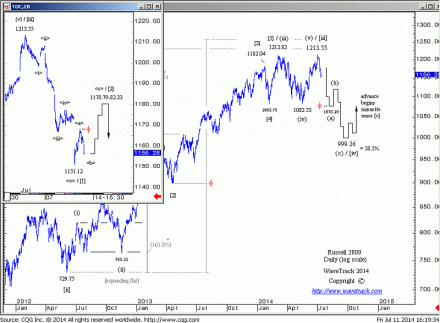
The Russell’s 2000 decline unfolds into a five wave seqence
by m.tamosauskas| July 11, 2014 | 3 Comments
The advance from the mid-May low of 1082.53 clearly subdivides into a five wave pattern into the recent high at 1213.55 that marks the conclusion of the larger five wave impulse pattern that began from the June ’12 low. Furthermore, the subsequent decline from 1213.55 has unfolded into a clearly visible five wave expanding-impulse pattern to Thursday’s low at 1151.12. This increases the probability that a multi-month downside correction is underway (see main chart). A shorter-term counter-trend rally has begun from 1151.12 with immediate upside targets measuring towards 1178.79-82.33. This could be exceeded if an initial zig zag pattern extends as a double, in which case, an attempt towards 1200.00+/- would be tested before an accelerative decline resumes. Even though European indices are recovering and ultimately expecting higher highs during the next week or so, the Russell is unlikely to trade back above its 1213.55 high.
Comments
3 Responses to “The Russell’s 2000 decline unfolds into a five wave seqence”
Leave a Reply


July 18th, 2014 @ 12:50 am
HI,
RUT is 1133 level. Is your wavecount still valid? Please update on today’s market action.
Thx
July 18th, 2014 @ 6:58 pm
WTI,
Fine. Here’s another view point. IWM that tracks Russel reached 112.5 and retraced back and moving towards 117.5 where decision will be made to go higher (or) go down further.
All of these prices are VWAP Prices and derived from MegaPhone.
Is it possible to use this in conjunction with EW and FIBs , to get more accuracy on target confluence?
Just with FIB’s + EW , target was measured up to 1144 level which is close , ,but not quite accurate.
Thx
July 18th, 2014 @ 7:41 am
Dear Kiran,
the Russell 2000 will be updated in tonight’s EW-Compass report.
All the best,
WaveTrack International