Reversal-Signature and Price-Rejection – The Golden Rule
by WaveTrack International| May 5, 2017 | 3 Comments
Many of our clients asked us over the years how WaveTrack defines a ‘reversal-signature’? And, when do we know that a ‘price-rejection’ takes place? As this is indeed a crucial factor in understanding the ‘golden rule’ of Elliott Wave trading we wrote this short excerpt to give you a quick insight on this important topic.
In short, a ‘reversal-signature’ follows the initial ‘price-rejection’ from a pre-determined fib-price-ratio measurement target level.
Reversal-Signature Measurements
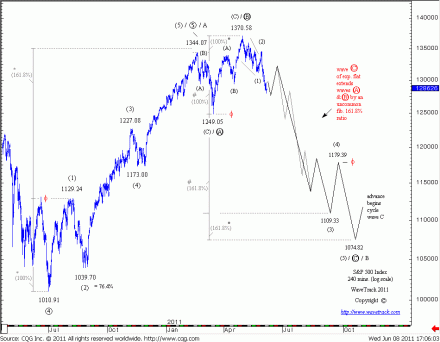
The reversal-signature commonly consists of a 12-15% swing in the opposite direction as measured from the beginning of the preceding pattern. For example (see fig #1) the decline for the S&P began from 1370.58 with downside projection to 1074.82…total 295 points…

S&P 500 – Reversal-Signature
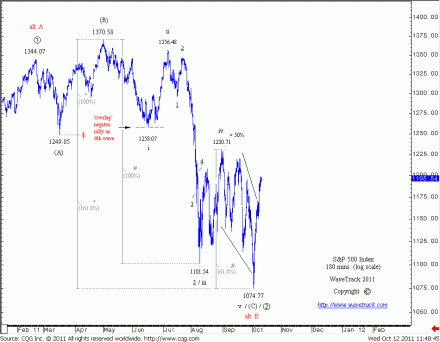
The price-rejection occurred at 1074.77 (see fig #2). This takes a 15% value of 295 points (44 points plus 1074 = 1118.00). As a result, an attempt to this level would be indicative of a reversal-signature.
Furthermore, this would be corroborated if a preceding high would be broken, and/or the upswing develops into a five wave sequence. However, the 12-15% levels are a guideline only though but they can be accompanied with more conventional reversal patterns such as – key reversal, closing reversal, island reversal plus more from the candlestick charts such as ‘bullish-engulfing’, bullish-hammer’, ‘morning star’ etc.

S&P 500 – Price-Rejection
But the ‘golden rule’ is to await price-rejection then a reversal-signature before taking a position in the opposite direction. If you are neutral heading into a transition/reversal point, ensure you see some form of price rejection at or close to the pre-determined price area. This increases the probability that the pattern identified is correct. So that as a result your trading position can be adequately protected beyond the price extremity that ended the pattern.
Here are more examples on the topic of ‘Reversal-Signatures’ and ‘Price-Rejections’ (see links):
Flash Crash (see fig #4)
Gold-Silver News Alert
Learn more how to determine Fibonacci-Price-Ratios to prepare for ‘Reversal-Signatures’!
Watch WaveTrack’s Fib-Price-Ratio videos on youtube to see how these measurements can be applied. These videos are gems of know-how for those who have eyes to see! WaveTrack’s first Elliott Wave Academy video
Keep tuned for more updates!
Ensure you’re tracking our forecasts – subscribe online for the EW-COMPASS REPORT.
Visit us @ www.wavetrack.com
Comments
3 Responses to “Reversal-Signature and Price-Rejection – The Golden Rule”
Leave a Reply

May 16th, 2017 @ 6:40 am
Excellent stuff. Enjoy thoroughly.
May 16th, 2017 @ 6:45 am
Thank you for your feedback, TAJ. Much appreciated!
May 30th, 2024 @ 3:50 pm
After looking into a number of the articles on your web page, I truly like your technique of blogging. I saved as a favorite it to my bookmark webpage list and will be checking back soon. Please check out my website too and tell me your opinion.