Yield Inversion Coming to an End
by WaveTrack International| March 27, 2019 | No Comments
Fixed Income Service – US3mth Eurodollar-US10yr Yield Spread
Rising expectations of a global recession have resurfaced over the last week. Especially, since the US$ dollar yield curve inverts for the first time since Dec.’07. Back then, the inversion actually began in Oct.’7. Just two months before the stock market peak of Oct.’07 that began the financial-crisis sell-off.
Investor’s perception is that an interest rate inversion precedes a global recession. Although, in a recent research note from Canaccord Genuity wealth management, it says there’s a time lag between the two events. It quotes ‘even if the yield curve inverts…over the past seven economic cycles, the median S&P 500 gain from the initial inversion to ‘the’ cycle peak is 21% per cent, with a recession a median 19 months after the initial inversion. If you look at the previous three most similar cycles, the S&P 500 gains to peak rises to 34% and recession is 25 months later’.
Obviously, there’s a distinct difference between the performance of the S&P 500 and what qualifies as a recession following a yield curve inversion. We know that recessions follow the price action. However, more often lagging by several months. That was certainly the case during the financial-crisis sell-off.
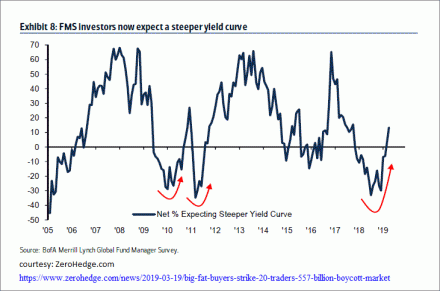
One of the interesting statistics from the latest Bank of America/Merrill Lynch survey was that fund managers economic growth expectations was actually improving, not worsening over the last month – see fig #1 [courtesy of ZeroHedge.com]. It states ‘growth expectations rebounding…net 25% of FMS investors expect global growth to weaken over the next 12 months, up 22ppt (percentage points) MoM and 36ppt from the low of 60% in January ’19 (which was consistent with 2000/01 & 2008/09 recessions), despite biggest 2-month improvement since Dec.’16 growth expectations still remain v (sic. very) vs. FMS history’.
Yield Inversion Coming to an End
We wonder if lowered expectations of a recession are because the S&P 500 has just traded to a new post-December ’18 high (2866.00)? Most probably, in which case, with the onset of a steep corrective downswing which is forecast developing over the next few months, at least from an Elliott Wave perspective [wavetrack.com], these expectations will most likely rise again, heading back to January’s figure of 60% per cent.
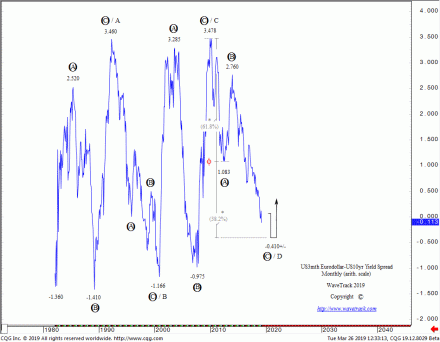
The long-term chart of the US 3mth Eurodollar-US10yr Yield Spread is fascinating to see – fig #2. It depicts a constant range-trade between +3.478 and -1.410 since the early-1980’s. This covers the period of the yield inflation-peak of January 1981 through to the major lows of years-2012/16. Each major upswing/downswing are labelled unfolding into primary degree zig zags. These are probably part of a multi-decennial triangle pattern, A-B-C-D-E.
The narrowing phase which began wave D’s downswing from the Dec.’09 high of 3.478 has since unfolded into a primary degree zig zag. Labelled as A-B-C where wave A ended an initial decline at 1.083 in July ’12. Using WaveTrack International’s proprietary technique of measuring a zig zag pattern, wave A is extended by a fib. 61.8% ratio to project a terminal low for wave C towards -0.410+/-.
Conclusion
With current levels trading around -0.113, it seems that we’ll not have too long to wait! Soon the validity of -0.410+/- in determining the end of the zig zag and the beginning of a new widening/steepening cycle will be tested. And whether that translates into an S&P 500 downturn sometime into the future is another interesting question.
Find out what WaveTrack’s latest US 10yr Yields forecast is subscribe to the EW-Compass report.
SP500 and 3 Degrees of Trend
by WaveTrack International| February 26, 2019 | 2 Comments
SP500 – Three Degrees of Trend Ends December’s Impulse Upswing @ 2814.00
Read more «SP500 and 3 Degrees of Trend»
NYSE Composite Index + Wilshire 5000
by WaveTrack International| February 20, 2019 | 15 Comments
NYSE Composite Index + Wilshire 5000 – December’s Five Wave Uptrend Tests Upside Targets – Preparing for Counter-Trend Downswing!!
The following is an extract from our Institutional Stock Index Report published Thursday January 17th 2019
Read more «NYSE Composite Index + Wilshire 5000»
Currencies and Interest Rates 2019 Video Outlook | PART III/III
by WaveTrack International| February 17, 2019 | 1 Comment
Currencies & Interest Rates 2019 Video Series | PART III/III
INCLUDES ANALYSIS ON MAJOR US$ DOLLAR PAIRS/CROSSES – ASIAN/EM CURRENCIES – MEDIUM-TERM CYCLES – LONG-DATED YIELDS US/EUROPE/JAPAN + SPREADS
US$ Dollar Continues Higher into Mid-Year 2019 before 7.8-Year Cycle Reasserts Downtrend – Long-Dated U.S./European Yields Heading Lower until June/July then Resuming Medium-Term Uptrend – Inflation Lower, then Surges Higher until 2021-24
We’re pleased to announce the publication of WaveTrack’s CURRENCIES & INTEREST RATES 2019 video updating medium-term ELLIOTT WAVE price-forecasts.
• PART I – STOCK INDICES – out now!
• PART II – COMMODITIES – out now!
• PART III – CURRENCIES & INTEREST RATES – out now!
CURRENCY REVIEW – 2018
In last year’s June ’18 mid-year EW-Forecast Video, several key CURRENCY & INTEREST RATE events were highlighted –
Read more «Currencies and Interest Rates 2019 Video Outlook | PART III/III»
‘SHOCK-POP-DROP’ & ‘INFLATION-POP’ Explained!
by WaveTrack International| February 2, 2019 | 1 Comment
INFLATION-POP and SHOCK-POP-DROP Explained!
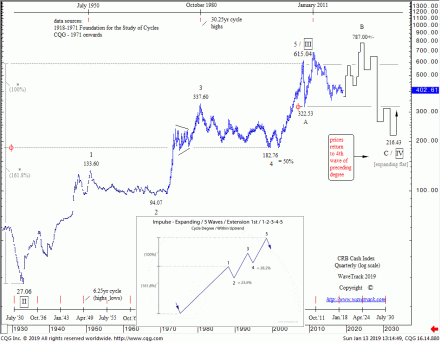
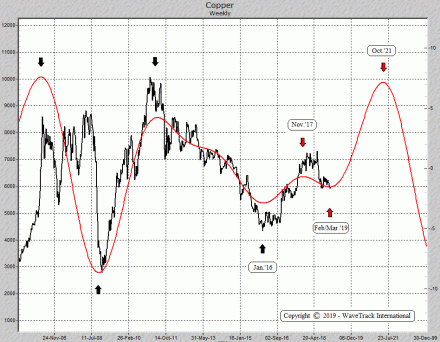
Almost all commodities ended their ‘SUPER-CYCLE’ uptrends around the year’s 2006-2008. We define the super-cycle uptrend not from the 1999 lows as is generally considered in the financial industry but from the ‘GREAT DEPRESSION’ lows of 1932. This is because most commodities reached all-time lows at that time. Even lower than levels traded several hundred years earlier and this provides a strong basis for historical Elliott Wave analysis. The subsequent uptrends from the 1932 lows unfolded into five wave impulse patterns. Consequently completing the ‘Super-Cycle’ into the 2006-08 highs, for benchmarks like the CRB-Cash index, Copper, Crude oil and Emerging Market indices – see fig #1.
Shock-Pop-Drop – Deflationary Cycle
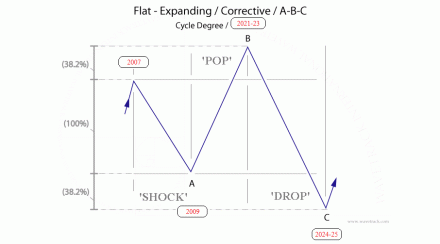
The SHOCK-POP-DROP is a term that describes how various Commodities, Emerging Markets and other major Stock Indices are unfolding as the ‘corrective’ or ‘balancing’ phase in the aftermath of ending their super-cycle uptrends. In Economics, this is designated as a multi-decennial ‘DEFLATIONARY PERIOD’. In Elliott Wave terms, the same period is designated taking the form of an ‘EXPANDING FLAT’ pattern lasting over several decades, heading into the next major cycle low due in the years 2024-2025. This is composed of three main price-swings. This is composed of three main price-swings, labelled A-B-C. In this case wave A as the ‘SHOCK’ phase, wave B as the ‘POP’ or Inflation-Pop and finally wave C as the final deflationary ‘DROP’ phase – see fig #2.
The ‘Financial-Crisis’ or ‘Great Recession’ developed between 2007-2009. It is simply the 1st phase of this multi-decennial corrective price decline that ended into the late-December/early-March lows of 2008/09. This is labelled as wave A, i.e. the ‘SHOCK’ phase.
The post-financial-crisis recovery is the 2nd phase of the corrective deflationary cycle. Yet, this phase is capable of pushing many commodities into new record highs. This phenomenon is not recognised in conventional fundamental/economic or even technical analysis. Because analysts see this as part of the previous super-cycle uptrend. However, the Elliott Wave Principle (EWP) specifically identifies such price developments alongside pattern identification methods as the 2nd sequence of the expanding flat pattern, i.e. wave B.
Inflation-Pop
This 2nd sequence of the expanding flat as wave B can be broken-down or ‘subdivided’ into a three price-swing event. More specifically, an Elliott Wave Zig Zag pattern, up-down-up until prices reach new record highs. We know markets adhere to ‘fractal’ qualities of subdivision and this is a good example. The Zig Zag is therefore labelled A-B-C and given the term of the INFLATION-POP. Mainly because it will undoubtedly trigger a resurgence of inflationary pressures by the time prices reach new record highs.
Wave A represents the 1st stage of the INFLATION-POP and wave C as the 2nd phase – see fig #3 [left].
Grand Re-Synchronisation
The 2nd phase of the INFLATION-POP began in January/February 2016 when corrective declines in Commodities and Emerging-Markets formed synchronous lows with major Developed Market Stock Indices. We termed this as the grand ‘RE-SYNCHRONISATION’ lows. This is why significant price rises have since followed. Continuing the secular-bull uptrend for stock markets (see fig #3, right) whilst beginning the next but final phase of inflationary price rises for Commodities and Emerging Markets.
2nd Phase of Inflation-Pop – Base Metals
This second phase of price rises is typical. But it is not exclusively unfolding into five price-swings or waves, 1-2-3-4-5 over a period of several years, into the culmination of the next cyclical peak due around the early part of the next decade, years-2021-24. So far, wave 1 ended its advance in Base Metals having taken two years to develop into January/February 2018’s highs. This has since given way to a period or regression or correction in wave 2. This is a necessary function before prices can resume higher in wave 3 and so on. Wave 2 is currently in downside progress from the 2018 highs, for Copper, and the rest of the base metals group.
The upside progress of the ‘Inflation-pop’ for precious metals is somewhat different. It too will succumb to the gradual build-up of inflationary pressures. However, maintaining it within the overall schematic. Yet its Elliott Wave pattern progress is different to base metals which means it has already begun its next surge higher from Q3-2018, onwards.
Performance Measures – Precious Metals
There exists some alternate long-term bearish counts for Gold and Silver which otherwise depict the end of their super-cycle uptrends into the year-2011 highs. These forecasts can be viewed in the Elliott Wave Forecast database (Institutional clients, please contact us for details). Or via the annual Elliott Wave Video Series (private clients, please contact us for details) – or see these links below:
Institutional Clients please click here
Private Clients please click here
When comparing underlying industrial commodities like Copper and inflationary sensitive measures like Gold with economic driven commodities like Crude/Brent oil, we again see some short-term pattern-dislocation but overall, fitting the ‘Inflation-Pop’ schematic.
Energy – Crude/Brent Oil
Crude/Brent oil are ultimately heading for new record highs as part of the 2nd phase of the inflation-pop. But this isn’t expected to resume until sometime after mid-year 2019. It began this sequence from the grand ‘RE-SYNCHRONISATION’ lows of January/February 2016. However, is unfolding into a seven price-swing sequence which is labelled A-B-C-X-A-B-C, or in Elliott Wave terminology, a double zig zag. The first cycle degree zig zag, or A-B-C ended last October (2018) and is currently being balanced by an ‘X’ wave correction into Q2 2019. Once completed, the next A-B-C zig zag pattern can get underway lasting through to the next cycle-peak due in 2021-22, attaining record highs.
The Deflationary Drop
Looking further ahead, the final phase of the ‘Shock-Pop-Drop’ is the ultimate period when rapid, accelerative price declines unfold. The ‘DROP’ sequence when deflationary pressures exert into the end of the next decade. This will be a ‘generational’ decline. Mainly because it will most likely wipe-out stock market and commodity values by around -80% per cent. Just as it did in the last comparable period which was the Great Depression collapse of 1929-1932. See Copper cycle, fig #4.
It will be a very difficult period for humanity. Both economically and spiritually because it will test us all, throughout our entire planet. But like all things justful, the phoenix does rise from the ashes. And and this no exception – we will rise again. It may take 20-25 years to recover from whatever lows develop, just as it did back in the 1930’s. But what emerges afterwards will resonate at higher frequencies for the generations that follow.
Get the New Elliott Wave Commodities Video Outlook 2019
by WaveTrack International| January 28, 2019 | No Comments
Commodities Video Outlook 2019 released
Commodities Prices to Resume ‘Inflation-Pop’ Uptrends in 2019 – After Shaky Drop!
INCLUDES ANALYSIS ON MEDIUM-TERM CYCLES & EQUITY MINERS
We’re pleased to announce the publication of WaveTrack’s annual Commodities 2019 video Outlook of medium-term ELLIOTT WAVE price-forecasts. Today’s release is PART II, COMMODITIES. Part I was released last month and Part III will be published in February.
• PART I – STOCK INDICES – out now!
• PART II – COMMODITIES – out now!
• PART III – CURRENCIES & INTEREST RATES – coming soon!
Commodities – Forecasts for 2018 – REVIEW
In last years’ annual 2018 EW-Forecast Video, several key commodity events were highlighted –
How did these Elliott Wave price-forecasts pan out?
The main drivers that permeated most asset classes in 2018 also affected commodity prices too – to begin with, the US$ dollar staged a successful turn-around last February, heading higher to begin a counter-trend correction following a -15% per cent drop in 2017. That pulled Base and Precious Metals lower in-line with forecasts.
Copper was late in beginning its counter-trend decline, although others in the group, Lead and Zinc topped-out right on cue. Copper has since declined by -22% per cent!
The Base/Precious metal miners began to fall rapidly as the U.S. stock markets staged a strong decline late-January/early-February, triggered by the emergence of a tariff trade war between the U.S. and its global trading partners. Despite a recovery from April through to late-September, the overall sell-off resumed in October, pulling the miners even lower although Gold and Silver have since formed important lows in August/November.
Gold was forecast down to interim targets of 1157.65+/- from 1303.00 and ultimately towards 1123.00+/-. The August low was 1160.24.
Silver was trading at 16.96 in January ’18 with downside targets to complete a 2½ year correction towards 14.04+/-. The November ’18 low was 13.89.
Palladium was singled-out in last year’s forecasts as maintaining its uptrend – it went on to gain +20% per cent into December’s high.
The Energy markets were in a slightly different timing-rhythm to other commodities although upside targets for Crude Oil towards 78.90+/- ran slightly shy to end a 2½ year zig zag upswing at 76.90. But the Elliott Wave zig zag was perfectly formed into the early-October high – it has since declined by -44% per cent!
The Next 6-12 Months (2019)
When stock markets declined in early-2018, many large investment houses were caught out. Mainly because analyst’s economic outlooks remained on a growth path without any interruptions – a big linearly-extrapolated mistake. The next peak in late-September was more ‘telegraphed’ but still, asset managers were overly committed in their long portfolio positioning.
It makes you wonder what has to happen before liquidation occurs? – the answer – a severe sell-off! That doesn’t sound logical if the idea is to buy low and sell high as the maxim goes. But it’s tough to change human habits unless you’re trained to look at things differently, as many do who practice the Elliott Wave Principle over many years. But even those that do can often fall into the traps.
Mainstream EW practitioners are labelling the U.S. stock market’s uptrend from the financial-crisis lows of 2009 as ending a five wave impulse pattern into the 2018 highs. Even though we sympathise, this doesn’t make sense when taking a macro-view alongside so many other global indices, those traded in Europe, Asia and many Emerging Markets. It neither fits together with other asset classes like COMMODITIES.
Elliott Wave and the Final Commodities Cycle
Since early-2010, following several months of stock and commodity market gains, we’ve identified an upcoming ‘INFLATION-POP’ within the multi-decennial deflationary cycle. That would ultimately see many U.S. and global stock markets make new record highs into the next decade along with commodity markets. Well, that process hasn’t finished yet!
Commodities markets are forecast significantly higher in 2019 into the next few years, extending the next phase of the ‘INFLATION-POP’. For this reason this next phase is going to be HUGE because it’s the final sequence of the cycle. Consequently it’s going to be important to sift through the different commodities and their equities to see which maintain outperformance and those which will simply limp higher. But rest assured, this next huge advance is coming!
New Commodities 2019 Video – PART II/III
We’ve amassed over 75 commodity charts from our EW-Forecast database in this year’s Commodities 2019 video. As a result each one provides a telling story into the way Elliott Wave price trends are developing in this next INFLATION-POP’ phase of cycle development. Also we’re taking a look at some very specific patterns that span the entire SUPER-CYCLE. Explaining why the super-cycle began from the GREAT DEPRESSION lows of 1932 and not from the lows of 1999 and how this ended in 2006-2008. And why the multi-decennial corrective downswing that began soon afterwards is taking the Elliott Wave pattern form that it is.
Furthermore, we’re updating some amazing cycles in the US$ dollar that you’ve simply got to see. Plus others for the CRB-Cash index which begins from the year-1760 (yes, 259 years ago!), Copper, Zinc, Gold, Silver and Crude Oil. Now that’s an amazing outlook. Last year’s forecasts were so accurate, it’s like having your very own crystal ball! And there are huge implications for the price development of Energy prices in 2019. Above all the real give-away that corroborates our theme is revealed in the Elliott Wave pattern development of the XLE Energy index – it’s a must-see!
We invite you to take this next step in our financial journey with us. Video subscription details are below. Just follow the links and we’ll see you soon!
Most sincerely,
Peter Goodburn
Founder and Chief Elliott Wave Analyst
WaveTrack International
Contents: 69 charts
• CRB-Cash index + Cycles
• Copper + Cycles
• Aluminium
• Lead + Cycles
• Zinc + Cycles
• Nickel
• Tin
• XME Metals & Mining Index
• BHP-Billiton
• Freeport McMoran
• Antofagasta
• Anglo American
• Kazakhmys Copper
• Gold + Cycles
• GDX Gold Miners Index
• Newmont Mining
• GoldCorp Inc.
• Barrick Gold
• Agnico Eagle Mines
• AngloGold
• Silver + Cycles
• XAU Gold/Silver Index
• Palladium
• Platinum
• Crude Oil + Cycles
• Brent Oil
• XLE Energy SPDR Index
CONTACT US NOW VIA EMAIL – SELECT YOUR PACKAGE
Single Video – *$48.00 – PART II Commodities Video 2019 (Jan. ’19)
Triple Package offer – *$96.00 (saving 33%)! – PART I – PART II – PART III (Jan. – Feb. ’19)
*(additional VAT may be added depending on your country – currently US, Canada, Asia have no added VAT but most European countries do)
PART III will be available in a few weeks’ time (February/March 2019!) – we’re working on it!
HOW CAN YOU RECEIVE THE VIDEO FORECAST?
To receive your VIDEO UPDATE please click here to contact us.
– Please state if you wish to purchase the SINGLE VIDEO – Commodities Video 2019 for USD *48.00?
– Or opt for the TRIPLE PACKAGE for USD *96.00 in total?
– Next we will send you a PayPal payment request and provide you with the video link & PDF report once confirmed.
– Alternatively, we can process credit card payments for you as well – please contact us. Thank you.
*(additional VAT may be added depending on your country of residence. Currently, the US, Canada, Asia have no added VAT. However, most European countries do)
We’re sure you’ll reap the benefits – don’t forget to contact us with any Elliott Wave questions – Peter is always keen to hear you views, queries and comments.
Visit us @ www.wavetrack.com
New Stock Index Video 2019 Released! Part I/III
by WaveTrack International| January 1, 2019 | No Comments

Stock Index Video 2019 Part I/III
2018’s 4th WAVE CORRECTION APPROACHING A TERMINAL LOW IN Q1 2019!
This report combines ELLIOTT WAVE with updated SENTIMENT & ECONOMIC INDICATOR STUDIES
We’re pleased to announce the publication of WaveTrack’s Annual 2019 video updates of medium-term ELLIOTT WAVE price-forecasts. Today’s release is PART I, Stock Index Video – Parts II & III will be published during January/February.
• PART I – STOCK INDICES
• PART II – COMMODITIES
• PART III – CURRENCIES & INTEREST RATES
2019 Begins With More Declines – Terminal Lows by Q1-2019!
It looks like 2018 set quite a few records! The exponential advance that carried over from December 2017 into January ’18 finally reached a terminal peak on January 31st at 26616.70, Dow Jones (DJIA) and 2872.87, the S&P 500 – both then staged an inverted ‘V’-shaped reversal decline that initially shaved -4.6% off values. CNN reported it was the ‘scariest day on Wall Street in years…the biggest decline since August ’11…the Dow plunged almost 1,600 points – easily the biggest point decline in history during a trading day’. That was only the beginning though! – declines continued through February until it formed a low 2-weeks later but by that time, indices were down by -11.8% per cent.
Volatility continued afterwards – it only took another 2-weeks for the S&P 500 to trade up by +10% per cent – which was just prior to a downswing into the early-April lows, a decline of -8.8% per cent! By that time, sentiment turned really bearish – Investors Intelligence reported that ‘Bulls’ declined from 47.6 to 42.2 which was the lowest bullish reading since right before the US presidential election of November 2016. The number of ‘Bears’ rose marginally but remained at a low historical figure of 18.6.
What did the markets do next?
They ran higher albeit at a more modest pace but advancing by +15.0% per cent until it reached the late-September/early-October highs – then bam! The Dow and S&P collapsed lower.
USA Today reported ‘the U.S. stock market suffered its biggest October decline since the 2008 financial crisis, prompting shaken investors to reassess the staying power of a bull run that began more than nine years ago’. Following rallies into November, markets declined again in early-December. London’s Financial Times reported ‘Volatility leaves Wall Street set for worst December since Great Depression’. Christmas Eve’s (December 24th’s) decline was particularly severe as the Dow (DJIA) gapped lower by 667 points delivering a -19.8% per cent psychological punch from October’s high. The S&P 500 registered a decline of -20.2% per cent, the threshold that many economists define as a ‘bear market downtrend’.
Since those lows, the major indices have recovered by +7.5% per cent.
Drivers & Sentiment
The volatile price-swings of 2018 and the net declines from January’s peak are blamed on the Federal Reserve’s continued monetary tightening and interest rate hiking programme, U.S. President Trump’s trade war with China and its allies and concerns of a global economic recession forewarned by the severe flattening of the U.S. yield curve.
We know just how scared the markets are right now through various sentiment readings. The latest data from AAII showed bulls collapsing 17pts to only 20.9 from the previous week’s level of 37.9. That was the lowest figure since May ’16 – wow! Then on Dec. 19th, Investors Intelligence reported Bulls declined from 46.7 to only 38.3 although most of this downsizing went to the middle-voting with Bears rising 1pt to 21.4.
Snippets of Bank of America/Merrill-Lynch’s fund manager survey for December have appeared on the internet. Highlights include a reading of ‘extreme bearishness’ in equities, a huge jump from long-equities which is now negative -15ppt to long bonds at +23ppt and defensive trades in Consumer Staples at +13ppt (approx.). What does this tell us? – it suggests the equity/stock market is priming itself for a major low although the report itself says that it does not consider its readings as bearish enough to trigger a buy signal!
Review – 2018
With such volatile price-swings over the last year, you might think they’re impossible to predict, but in actual fact, the opposite is true! – THEY ARE PREDICTABLE!
Ray Dalio, the American billionaire and hedge fund manager of Bridgewater Associates sent out an e-mail to clients in December. It had this to say: ‘As you probably know by now, I believe that everything (i.e., all reality) works like a machine with cause-effect relationships that drive what happens, and that to be effective it’s essential to have a good mental model of how those machines/realities work and to have good principles for dealing with them well’. Sounds like an Elliott Waver to me! – ha! But in reality, Ray Dalio looks through the economic lens model – productivity growth, the short-term/long-term debt cycles in coming up with his concept of how the future looks.
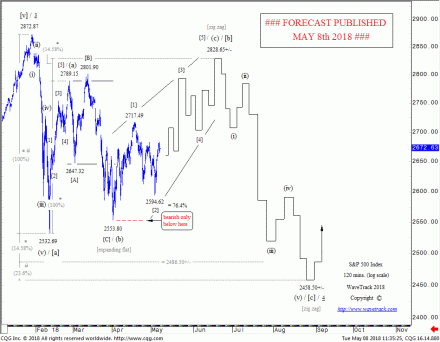
But our resonance-signature prefers to work with the same mechanistic principles of ‘cause-effect’ using a more fluid, non-linear/fractal methodology – the ELLIOTT WAVE PRINCIPLE. This model has correctly identified almost all the price-swings of 2018 –
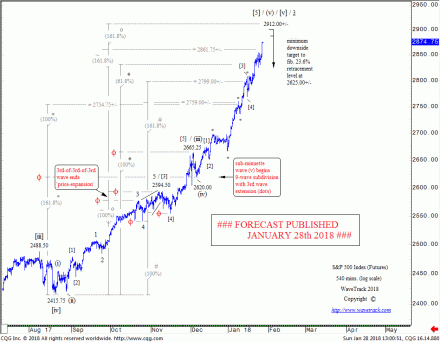
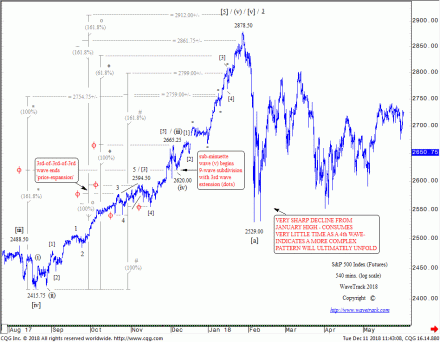
fig #1 Jan. 28th – S&P 500 running exponentially higher but already into upside target range of 2861.75+/- to max. 2912.00+/- that ends the entire advance from July ’16
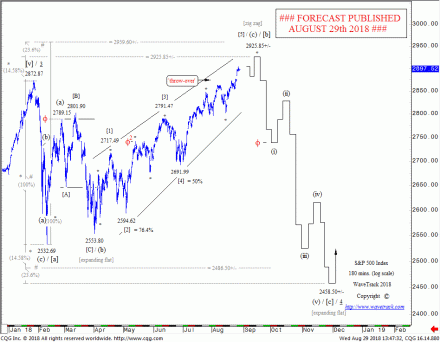
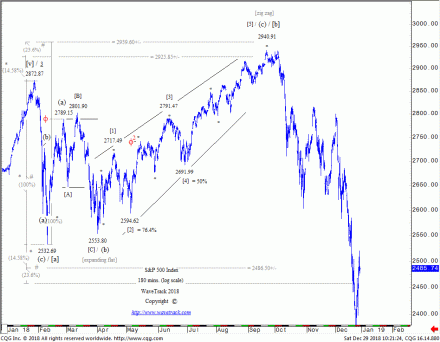
fig #4 August 29th – S&P 500 trading higher but approaching upside targets towards 2925.85+/- then forecasting collapse lower to 2458.50+/-
What Next? Preview for 2019 – U.S. Benchmark Indices
There’s a lot of competing aspects to consider this year and to gain a realistic glimpse of what’s to come, we’re going to have to separate the proverbial wheat from the chaff. That means being unbiased and relying on the facts.
The dominant Elliott Wave theme is that September/October’s highs ended a five wave impulse uptrend that began from the financial-crisis lows of Oct.’08/March ’09 – but is this correct? If the S&P 500 and Dow Jones indices are analysed in isolation, then there is a reasonable chance this ended a five wave ‘structure’. But when examining the same pattern in log-scale and overlaying Fibonacci-Price-Ratio analysis to verify, the pattern begins to degrade – no confirmation is forthcoming.
Back in year-2000 at the height of the dot.com boom and several years later at the highs of October 2007, developed market indices formed corresponding terminal highs with Emerging Markets and Commodities – positive corrections combined with terminal Elliott Wave uptrends formed at the same time. They declined together in corrective synchronisation in the sell-offs that followed. But synchronised EW-pattern highs never happened in 2018. In fact, Emerging Markets and Commodities are still engaged in five wave uptrends that resumed in early 2016 and are far from complete. Yes, they began corrective downswings in 2018 but that’s all. But that means the secular-bull uptrend for U.S. and other global indices is still in upside progress!
This Year’s Stock Index Video Forecast Focus
This year’s 2019 Elliott Wave forecasts takes an updated look at these disparities but aligning them into a synchronised process over the next two-year period. Over 60 charts illustrate the intricate relationships between the U.S., European and Asian/Emerging markets. They combine to tell the same story – we’ve haven’t seen a major peak in the secular uptrend just yet! And even if you have doubts, take a look at some of the sentiment and economic indicators that form part of the holistic viewpoint – the Elliott Wave overlay is pretty convincing!
Worst-Case Scenario
The Stock Index Video 2019 wouldn’t be balanced without a look at the more obvious Secular-Bear scenario. As a result, we’ve added some important slides into the mix. What this does is focus the negation levels at which point a nemesis decline is confirmed. For U.S. indices, price levels would need to break below the Feb.’16 lows whilst unfolding into a five wave impulse pattern to confirm the secular-bear scenario. So let’s see!
European Indices
One of the key aspects to the continued secular-bull uptrend is realised from examining the benchmark Eurostoxx 50 index. Its 2015-16 decline unfolded into a typical THREE WAVE CORRECTIVE PATTERN, i.e. a zig zag. Hence, the following advance into the Nov.’17 high didn’t break above the 2015 high. Consequently, this means there’s still a lot of upside potential to come over the next 18-24 month period, albeit European indices underperforming in 2018.
Emerging Markets + Asia – Australia – Japan
Emerging Markets along with many benchmark commodity markets are unfolding into the ‘INFLATION-POP’ schematic first postulated in these reports back in year-2010. Some indices haven’t broken above the old 2010-11 highs yet. However, this is again another strong indicator that secular-bull uptrends remain engaged to the upside.
New Stock Index Video 2019 – PART I/III
This ANNUAL 2019 VIDEO UPDATE for STOCK INDICES is like nothing you’ve seen anywhere else in the world. It’s unique to WaveTrack International, how we foresee trends developing through the lens of Elliott Wave Principle (EWP) and how its forecasts correlate with Cycles, Sentiment extremes and Economic data trends.
We invite you to take this next step of our financial journey with us – video subscription details are below. Just follow the links and we’ll see you soon!
Most sincerely,
Peter Goodburn
Founder and Chief Elliott Wave Analyst
WaveTrack International
Contents for the Stock Index Video – 68 charts
Read more «New Stock Index Video 2019 Released! Part I/III»
Merry Christmas and Joyous, Prosperous and Peaceful 2019
by WaveTrack International| December 19, 2018 | 2 Comments
Merry Christmas & a Joyous New Year 2019!
We share one sacred planet,
the warmth and light of one beautiful sun,
the same air, earth, water and fire…
we are but timely custodians of these finite resources for the next generation to come…
Yet, in this season we are reminded that one resource we all share and need multiplies by giving…
LOVE
So we hope that wherever you are and whatever your faith, that your Festivities and New Year will reveal the many treasures of Peace, Love and Abundance.
P.G. & the WaveTrack Team
Announcement for our EW-Compass Subscribers
Christmas/New Year Schedule
This week’s Elliott Wave Compass Reports will be the last reports published for 2018!That’s Wednesday/Friday’s reports, Dec. 19th/21st ahead of the Christmas Festivities. The next EW-Compass will be published on Wednesday 2nd January 2019. If you have any questions next week, please send them in. We’re still here but working to meet deadlines for the publication of our annual 2019 Elliott Wave forecasts.
The extent of tracking all four asset classes, so many contracts has expanded exponentially over the last few years. Mainly, driven by the demand from you, our customers! This has necessitated creating all the Elliott Wave charts into a THREE PART VIDEO SERIES. As a result Part I will focus on Stock Indices, Part II Commodities & PART III Currencies & Interest Rates.
Seems like Part I might even be ready before year-end. Therefore, watch out for another e-mail message from us soon! Parts II & III will be published in January/February!
SP500 + Nasdaq 100 = Bullish!
by WaveTrack International| December 10, 2018 | 1 Comment
SP500 and Nasdaq 100 holding above Oct/Nov. lows – Bullish!
Read more «SP500 + Nasdaq 100 = Bullish!»
Elliott Wave Theory Bullish – Dow Theory Bearish
by WaveTrack International| November 27, 2018 | 6 Comments
Dow Theory vs. Elliott Wave Theory
Read more «Elliott Wave Theory Bullish – Dow Theory Bearish»
« go back — keep looking »