EW-Commodities Outlook Oct/Nov. 2022
by WaveTrack International| October 7, 2022 | No Comments
EW-Commodities Outlook – Base Metals & Energy set for Rebound Rally – Precious Metals Bottomed, Beginning New Multi-Year Uptrend
EW-Commodities Outlook covering Central Bank impact on Commodity Prices
There’s been a noticeable pick-up in Central Bank activity over the last month with rate hike acceleration becoming the mandate amongst most of the developed countries across the world. The U.S. Federal Reserve are leading the assault higher with aggressive 75bps basis point increases with expectations of more on the way. Just this week, Chicago Fed President Charles Evans, St. Louis Fed President James Bullard and Minneapolis Federal Reserve Bank President Neel Kashkari said the central bank will need to raise interest rates to a range between 4.50% and 4.75%.
Other Central Banks are not far behind the Fed. However, this lag means the US$ dollar has remained on an upward trajectory, weakening all of the G10 currencies in its wake – see fig #1. And a few Commodities too!
Fig #1 – Central Bank Hikes – Source: Refinitiv Data
British Pound collapsed against the US$ Dollar
Earlier this week, the British Pound collapsed against the US$ Dollar, causing the Bank of England to implement a support mechanism that prevents further declines for the Pound whilst creating a ceiling in long-dated Gilt yields. These emergency measures are also being considered in continental Europe. Japan is already restraining inflationary pressures by holding JGB 10yr yields below a threshold level of 0.25% per cent. Clearly, monetary policy changes in non-U.S. Central Banks will ultimately cause a US$ Dollar peak as they catch-up with inflation pressures. That’s not too far off, at least from an Elliott Wave perspective.
Fig #2 – Recession odds still rising – Source: BofA Global Fund Manager Survey
Recession?
Fears of a global recession have risen over the last month. This is weighing heavily on monetary policy decision-makers, both in the U.S. but more so in Europe – see fig #2. So much so that sentiment has now entered extreme bearish territory, as shown in stock market surveys – see fig #3.
Fig #3 -FMS Asset Allocation – Source: BofA Global Fund Manager Survey
Interestingly though, a majority of global fund managers think inflation has peaked – see fig #4.
Fig #4 -FMS Has Inflation peaked – Source: BofA Global Fund Manager Survey
Ordinarily, surveys like these provide really important information when they’re measuring historical extremes. They’re contrarian indicators. And these suggest risk-assets are currently approaching important lows. That’s something can confirm that from an Elliott Wave perspective.
Stock markets are retesting or modestly breaking below the March/July lows. Although we’re expecting a big turn-around, lifting prices back inside the last 6-month range for a revisit back to August’s highs. Meanwhile, commodities like Copper which completed the first stage of corrective declines last July is expected to resume higher for another month or two. Crude oil, another bellwether of the economy has just completed the first stage of its own correction that began last March and is now about to head higher for another month or two.
And look at Gold! Prices have now declined into long-standing downside targets just above $1600.00 dollars. This ends a 2-year correction from the Aug.’20 high of 2072.00. That’s really exciting when we look at its upside potential alongside Silver and Platinum…
Get more insights in our latest EW-Commodities Outlook report and video update!
Commodities Trading Opportunities
by WaveTrack International| August 22, 2022 | No Comments
The ELLIOTT WAVE COMMODITIES OUTLOOK
September 2022 Report
Largest Commodities Risk-Off 2022!
The largest declines in this year’s risk-off, inflation surge environment has been in Base and Precious Metals. Copper is down -35% per cent and Gold is down -18% per cent whilst Energy contracts like Crude Oil are down by -34% per cent from March’s high.
Contrastingly, the benchmark S&P 500 was down -24% into June’s low although recovering so much since. It’s only down -10% per cent now. There’s a definitive, positively-correlated link in the commodity markets where Copper, Gold and Crude oil all topped-out last March. There were notable lows in July for Copper and Gold too. Crude oil is still trading at this year’s lows which breaks its correlation somewhat.
Overall, we expect to see further performance disparities going forward. Whilst inflationary pressures have been rising exponentially, it’s highly unlikely that pace will continue at this juncture. A pause is more likely through to year-end, into Q1 2023.
Energy Commodities Crude Oil and Brent Oil
This is mainly due to the downside price potential in Energy markets. Crude/Brent oil completed five wave uptrends from the pandemic lows into March’s highs and corrective declines so far represent only partial retracement levels.
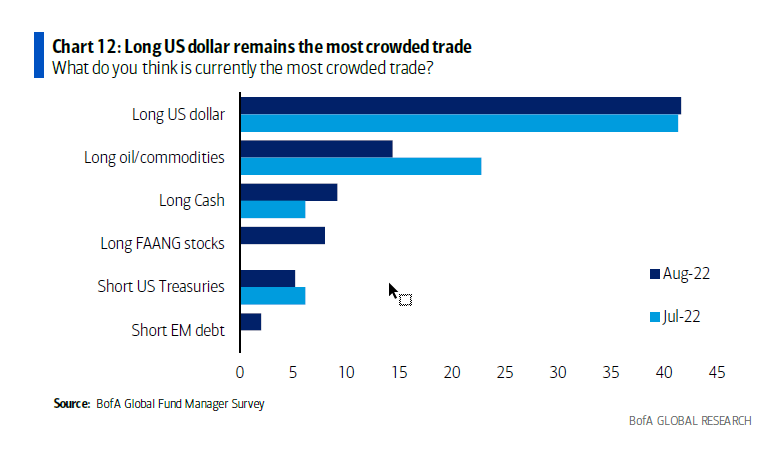
Fig #1 – US Dollar Long Position – Source: Bank of America
Bank of America’s latest Global Fund Manager’s Survey shows the US$ dollar and long oil/commodities are the biggest positioning trades out there – see fig’s #1 (Chart 12) and fig #2 (Chart 19) – good reason why there’s still a lot of downside potential ahead.
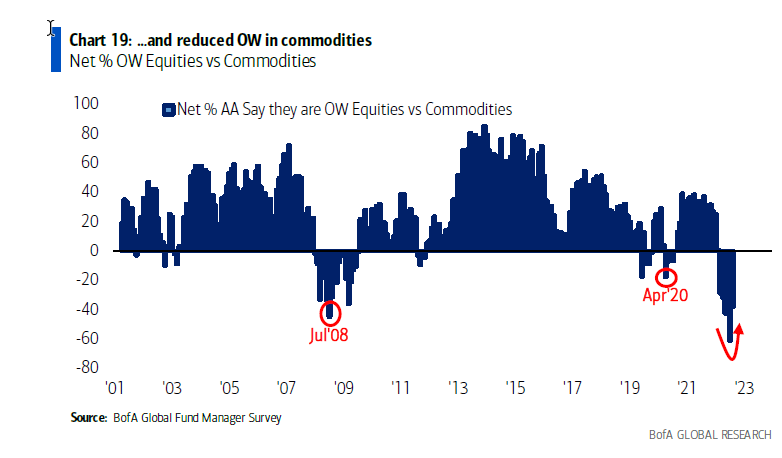
Fig #2 – OW Equities vs. Commodities – Source: Bank of America
Commodities Proxy Copper
Copper, a proxy for measuring the macro-economic twists and turns has reached original downside targets. However, exceeding them slightly which opens the door for more declines later this year but not before sizable counter-trend rallies finish sometime in September. This dove-tails with the more bearish stock market outlook we have for the remainder of this year. European indices are providing concise Elliott Wave pattern development. Now, showing how the current upside rallies from July’s lows will end in September, then followed by some dramatic declines lasting through to year-end.
Commodities Bullish Signals
The most bullish news comes from the Precious Metals industry. Gold and Silver complete 2-year corrective downswings into July’s lows and are already heading higher to begin new multi-year uptrends. Gains are expected to be underpinned by a weakening US$ dollar which itself has signalled an important peak into July’s high.
Commodities Mid-Year Video Update 2022
The mid-year 2022 Commodities Outlook Report published last month highlighted the expected outperformance of Silver over Gold, Platinum over Silver and even Palladium over Platinum. This month’s report confirms Platinum’s correction that began from the Feb.’21 peak also ended in July with a very bullish outlook going forward.
Get more insights in our latest EW-Commodities Outlook report.
Forex + Bonds Mid-Year Video Part III/III
by WaveTrack International| August 12, 2022 | No Comments

Forex + Bonds Mid-Year Video 2022 | PART III/III
INCLUDES ANALYSIS ON MAJOR US$ DOLLAR PAIRS/CROSSES – ASIAN/EM CURRENCIES – MEDIUM-TERM CYCLES – LONG-DATED YIELDS US/EUROPE/ITALY/AUSTRALIA/JAPAN + MANY SPREADS
Forex + Bonds Highlights
Forecast Preview – H2 2022
Rising Inflationary Pressures. Central Banks (CB’s) have been wrong-footed by rising inflation this year with the Federal Reserve only last December, realising rising costs were not ‘transitory’ but ‘persistent’ instead. The delay in responding quickly to rising inflationary pressures has caused a significant jump higher in CPI levels as years of suppressing interest rate rises during a time of asset price recovery has triggered market normalisation in its natural function.
History repeats! – Paul Volker failed to respond early to rapid price increases during the 1970’s once the gold standard was replaced with a fiat monetary system. Again, normal market mechanisms were suppressed resulting in a surge in inflation. Now we see the same ‘catch-up’ scenario by the Federal Reserve and other central banks from around the world.
Fig # 217 – World CPI – Rising Inflationary Pressures
U.S. inflation is running at around 9.1% per cent – Europe at 8.1% per cent – by contrast, China at 2.4% per cent and Japan at 2.0% per cent – see fig #217. Get all Forex + Bond insights in our latest video including PDF with all charts!
G10 Forex
With a US$ dollar peak in July at 109.29, almost all other G10 dollar currency pairs are inversely forming major lows and are set for multi-year gains.
The Euro/US$ has featured this year with declines of -13% per cent and -19% per cent from the Jan.’21 high of 1.2350 into July’s low of 0.9952 although ending the final sequence of its intermediate-term corrective downswing from the pre-financial-crisis-high of 1.6040 as cycle wave B – see fig #228. It’s taken exactly 14 years to complete cycle wave B’s correction but its now opening the way for a new multi-year uptrend as cycle wave C where targets are towards min. 1.9024+/- to max. 2.0699+/-.
Fig # 228 – EUR/USD Forecast by WaveTrack International – Forex + Bonds Mid-Year Video Content
AUD vs. USD – Forex Forecast Mid-Year Video Preview
AUD/US$’s medium-term outlook remains very bullish with a primary degree A-B-C zig zag pattern in advance from the April ’01 low of 0.4776. Primary wave C’s advance began from the pandemic low of 0.5507 with intermediate wave (1) ending at 0.8008 in Feb.’21. The trend now resumes to the upside. Ultimate targets over the next several years remain towards 1.5287+/-. See fig’s #249-251.
Fig # 251 – AUD vs. USD – Daily Forecast – Forex + Bonds Mid-Year Video Content!
Watch the complete explanation for the AUD vs. USD forecast with Monthly chart in our latest Elliott Wave Video Mid-Year forecast.
Be Prepared!
Our EW-team worked hard to put this information together in a way that is comprehensive to ensure that you are prepared for the major Forex moves to come in 2022 and beyond. Check out the table of contents below and if you are trading Currencies – don’t miss it!
We invite you to take this next step in our financial journey with us – video subscription details are below – just follow the links and we’ll see you soon!
Most sincerely,
Peter Goodburn
Founder and Chief Elliott Wave Analyst
WaveTrack International
What you get
Contents: 139 charts | VIDEO DURATION: nearly 3 hours 7 mins.
The contents of this CURRENCIES & INTEREST RATES VIDEO include Elliott Wave analysis for:
Forex (91 charts):
• US$ Index + Cycles
• Euro/US$ + Cycles
• Stlg/US$
• US$/Yen
• US$/CHF
• US$/NOK
• US$/SEK
• AUD/US$
• US$/CAD
• NZD/US$
• Euro/Stlg
• Euro/Yen
• Euro/CNY
• Stlg/YEN
• Stlg/AUD
• Stlg/ZAR
• AUD/YEN
• AUD/Renminbi
• AUD/NZD
• Asian ADXY
• US$/Renminbi
• US$/KRW
• US$/SGD
• US$/INR
• US$/TWD
• USD/THB
• US$/MYR
• US$/IDR
• US$/PHP
• USD/BRL
• USD/RUB
• US$/ZAR
• US$/MXN
• US$/TRY
• Bitcoin
• Ethereum
Interest Rates (48 charts):
• US CPI
• US10yr Real Yield
• US30yr Yield + Cycles
• US10yr Yield + Cycles
• US5yr Yield
• US2yr Yield
• US2yr-10yr Yield Spread
• US10yr-30yr Yield Spread
• 3mth EuroDollar-US10yr Yield Spread
• Comparison US10-DE10yr vs S&P 500
• US10yr TIPS Break Even Inflation Rate
• US10-DE10yr Yield Spread
• DE10yr Yield
• ITY10yr Yield
• Italy10-DE10yr Yield Spread
• Australia 10yr Yield
• Japan 10yr Yield
How to buy the Forex + Bonds Mid-Year Video Update 2022
Simply contact us @ services@wavetrack.com to buy the CURRENCIES + INTEREST RATES Mid-Year Video Update 2022 for USD 48.00 (+ VAT where applicable) or alternatively our Triple Video Offer for USD 96.00 (+ VAT where applicable) – Review the content of WaveTrack Stock Indices Video PART I here and the Commodities Video PART II here.
*(additional VAT may be added depending on your country – currently US, Canada, Asia have no added VAT but most European countries do)
We’re sure you’ll reap the benefits – don’t forget to contact us with any Elliott Wave questions – Peter is always keen to hear you views, queries and comments.
Visit us @ www.wavetrack.com
New Mid-Year COMMODITIES Video Update available
by WaveTrack International| July 13, 2022 | No Comments
‘COMMODITIES CORRECTION WELL UNDERWAY’ – ‘PAUSE WITHIN INFLATION-POP’ CYCLE’ – ‘BASE METALS REACH INTERIM LOWS’ – ‘PRECIOUS METALS CONTINUING DOWNWARD CORRECTION’ – ‘ENERGY, CRUDE/BRENT OIL BEARISH’
We’re pleased to announce the publication of WaveTrack’s Mid-Year Video Update of medium-term ELLIOTT WAVE price-forecasts. Today’s release is PART II, COMMODITIES – Part I was released last month and Part III will be published in late-July / beginning of August 2022…
• PART I – STOCK INDICES – out now!
• PART II – COMMODITIES – out now!
• PART III – CURRENCIES & INTEREST RATES – coming soon!
Commodities Forecast Highlights
This year’s bearish forecasts for commodities are in full swing but there are correlation disparities between sectors and other asset classes which is causing confusion amongst investors.
Commodities Outperformers
The outperformers are generally those in the Energy industry with equities in this sector only beginning to decline from June peaks, several months later than in Base/Precious metals.
Commodities Expected Underperformers
Energy is expected to underperform for the remainder of this year as it attempts to catch up in its corrective decline.
Commodities Super-Cycle
The Commodity Super-Cycle beginning from the Great Depression lows of year-1932 ended in 2006-08. Since then, a multi-decennial corrective downswing has begun a new deflationary era but with pockets of rising inflationary pressures.
One of those pockets of rising inflationary pressures resumed in early 2016 but gained momentum in 2021 resulting in huge rises since, into this year’s current levels over 8% per cent. A pause in this uptrend of inflation is expected to begin now. Expected to last into year-end. And perhaps Q1 2023 but resuming higher again afterwards resulting in a final peak due in 2023/24, latest 2025 – this is the final phase of the ‘Inflation-Pop’ cycle.
CRB Cash Index – Commodities Indicator
The completion of the super-cycle uptrend in July ’08 opens the door to a multi-decennial correction which ultimately demands prices return back towards ‘fourth wave preceding degree’ basis R.N. Elliott’s original tenet.
Fig #1 – CRB Cash Index – Quarterly Forecast by WaveTrack International
This CRB Cash Index forecast unfolding into a cycle degree expanding flat pattern, A-B-C where the initial downswing as cycle wave A unfolds into a smaller expanding flat, ending into the COVID-19 low of 316.67 last March 2020. Cycle wave B is now engaged in a multi-year rally targeting the fib. 38.2% extension ratio at 787.00+/-. Once completed, the final stage of an expanding flat pattern can develop, shown here as a five wave expanding-impulse. Extending cycle A by a fib. 61.8% ratio ultimately projects a terminal low for the zig zag towards 216.43+/-. Latest: The data for this index are not available any more, it discontinued by the end of January ’21. We keep this chart for the past price development. See Fig #1
Commodities – Themes of the Video
This video is Part II and we’ll be taking a look at over 117 individual commodity contracts and cycles within three main sub-sectors, Base Metals, Precious Metals and Energy.
The central themes we’ll be discussing in this video include how rising inflationary pressures have gripped most parts of the world. Moreover, how central banks are responding with revised monetary policies and what impact this is having on commodities?
We’ll begin by taking a look at the very long-term commodity cycle from the Great Depression lows into major peaks during the last decade – and how that began the ‘inflation-pop’ cycle, a term we conceived back in 2011 to describe the up-coming inflation surge which has now become a reality. And much more…
This is WaveTrack’s state of the art video -only available twice a year- if you are trading commodities this is a must have.
Sincerely,
Peter Goodburn & EW-team
Commodities Video Part II
Contents: 117 charts
Time: 2 hours 47 mins.
• CRB-Cash index + Cycles
• US 30yr Corporate Bond Yield Cycle
• US CPI
• US 10yr TIPS Break Even Inflation Rate
• Food and Agriculture Index
• DB PowerShares Agriculture Fund
• US Dollar index + Cycles
• Copper + Cycles
• Aluminium
• Lead
• Zinc
• Nickel
• Tin
• Iron Ore
• Uranium
• Rare Earths
• XME Metals & Mining Index
• BHP-Billiton
• Freeport McMoran
• OZ Limited Copper
• Antofagasta
• Anglo American
• Glencore
• Rio Tinto
• Teck Resources
• Vale
• Fortescue Metals (Iron Ore)
• Metals X (Tin)
• Gold
• Gold-Silver Ratio
• Silver
• Platinum/Silver Ratio
• Platinum
• Palladium/Platinum Ratio
• Palladium
• GDX Gold Miners Index
• Newmont Mining
• Amer Barrick Gold
• Agnico Eagle Mines
• AngloGold Ashanti
• XAU Gold/Silver Index
• Fresnillo Silver
• Crude Oil + Cycles
• Brent Oil
• Gasoline RBOB
• Natural Gas
• UK NBP Natural Gas
• TTF Natural Gas
• XLE Energy SPDR
• XOP Oil and Gas Index
How can you purchase the video?
1. Contact us @ services@wavetrack.com and ask for a PayPal payment link (please state if you like to purchase the Commodities Single video or the Triple Video?).
2. Ask for an individual credit card payment link (in case you do not wish to pay via PayPal).
*(additional VAT may be added depending on your country – currently US, Canada, Asia have no added VAT but most European countries do)
We’re sure you’ll reap the benefits – don’t forget to contact us with any Elliott Wave questions – Peter is always keen to hear you views, queries and comments.
Visit us @ www.wavetrack.com
We’re sure you’ll reap the benefits. Don’t forget to contact us with any Elliott Wave questions. Our EW-team is always keen to hear your views, queries, and comments.
Visit us @ www.wavetrack.com
Stock Indices Mid-Year Video Update PART I/III
by WaveTrack International| June 14, 2022 | No Comments
STOCK INDICES MID-YEAR VIDEO UPDATE 2022 Part I/III
2022’s Correction Hits Interim Targets – Final Lows in October-December
Stock Indices Report PART I
This year’s stock market trends have certainly been impacted by the new rate hike cycle. The S&P 500 is down -20% per cent from January’s high into May’s low whilst the Nasdaq 100 is down -30% per cent. ETF’s like the Fangs+ technology index is down -42% per cent with individual component equities down by -77% per cent. In terms of performance, it’s a very mixed affair. On the other side of the scale, outperforming sectors like Consumer Staples (XLP) held up pretty well, trading to a new post-pandemic high last April, and only then staging sharp declines that begin multi-month corrections.
What next?
So far, the annual Stock Indices Report PART I published last December ’21 called this market downturn perfectly – see Fig #1 – but what next?
Fig #1 – Stock Indices Track Record December 2021 Outlook 2022 Video Report by WaveTrack International
U.S. indices have declined from their November/January highs into ‘a-b-c’ zig zag patterns that ended into the May lows. Sentiment was registering bearish extremes at the time and this pessimism was also seen in various Fund Manager surveys. But as prices recover higher. So analysts are now questioning whether this is simply a counter-trend rally or the resumption of the prevailing secular uptrend?
In this mid-year Stock Indices PART I report, we’ll show clues suggesting May’s recovery is most likely a counter-trend bounce ahead of more declines later this year.
Stock Indices World – Bovespa Brazil Forecast
Fig #2 – PREVIEW – Bovespa – Daily – Forecast Stock Indices 2022 Mid-Year Report by WaveTrack International
Supporting this outlook, we’ll be taking a look at a very different type of corrective pattern that began unfolding from last November’s high in Europe from February’s high in Australia. These establish critical archetypes and Elliott Wave price forecasts for other major indices from around the world, in Brazil, Saudi Arabia, India, Singapore, Taiwan and Japan – and in China, Hong Kong, a few surprises too!
New Stock Indices 2022 Video – PART I/III
This 2022 MID-YEAR VIDEO UPDATE for STOCK INDICES is like nothing you’ve seen anywhere else in the world. It’s unique to WaveTrack International, how we foresee trends developing through the lens of Elliott Wave Principle (EWP) and how its forecasts correlate with Cycles, Sentiment extremes and Economic data trends.
We invite you to take this next step in our financial journey with us – video subscription details are below – just follow the links and we’ll see you soon!
Most sincerely,
Peter Goodburn
Founder and Chief Elliott Wave Analyst
WaveTrack International
Contents Stock Indices Mid-Year Video Update 2022
Charts: 91 | Video: 2 hours 40 mins.
Read more «Stock Indices Mid-Year Video Update PART I/III»
Commodity Highlights
by WaveTrack International| May 4, 2022 | No Comments
‘COMMODITY CORRECTION DURING NEXT 6-8 MONTHS’ – ‘PAUSE WITHIN INFLATION-POP’ CYCLE UPTREND’ – INFLATIONARY PRESSURES EASE – Base Metals Turning Down – Energy Resuming March’s Decline – Precious Metals Testing Important Support Levels – Gold Miners Remain Bullish
Extract from May’s Elliott Wave Commodity Outlook Report
Commodity May Report – In This Edition
Base Metals
Commodity prices have continued to trade near relative post-pandemic highs. But they’ve also remains below the March peaks in a sign of directional change. Base Metals are trading lower over the week following last month’s short-term corrective rallies. Prices for Copper, Aluminium, Lead and Zinc are all heading lower. Negative headwinds are centered around a strong US$ dollar. However more recently, the impact from China’s latest city-wide coronavirus lockdowns are raising concerns.
Inflationary pressures remain in focus as long-dated U.S. interest rates remain stubbornly high although there are several signs of an imminent interim peak forming within this inflation-pop cycle.
U.S. headline Consumer Price Index (CPI) continued to break records with the March ’22 data at 8.5% per cent whilst the Fed’s PCE headline numbers are at 6.6% per cent, core at 5.2% per cent. The Federal Reserve remains on track to deliver a 50bps hike in rates this week to 0.75-1.00% per cent although it remains far behind the curve. Its quantitative tightening programme is too little, too late with the bond market pricing-in too much at current levels. One elevator is rising whilst the other is declining.
US Dollar
The US$ dollar has exceeded our upside expectations although the longer-term picture remains bearish. A dollar peak sometime this month would represent an ensuing decline as inflation-trade long-positioning is unwound.
Precious Metals and Miners
Precious metals have been declining over the last month. This trend is in-line with Elliott Wave analysis with downside risk in focus. But there are alternate bullish counts which show an imminent low forming just below current price levels in gold and silver that could, if held, turn things around. Several of the gold miners are approaching important support levels, turning bullish.
Energy
In the Energy markets, Natural Gas has been the commodity that has continued higher over the last month. Although it too has hit some important upside levels and is now edging lower. Crude and Brent oil completed their five wave impulse post-pandemic uptrends into the March highs and is set to accelerate lower this month in a continuation of multi-month corrections. The XLE Energy ETF and the XOP Oil & Gas ETF’s are also set to head lower.
DB-Agriculture Fund ETF
Inflation-led commodities like grains and other foodstuffs are trading into upside resistance levels as measured in the DB-Agriculture Fund ETF. An ensuing corrective downswing is expected to begin now, lasting into year-end. A correction is also signalled for the FAO’s Food & Agriculture index.
The Food and agriculture sectors have been in focus once again as inflationary pressures continue to rise. Ukraine is a major producer of grains to the world (see graphic in last month’s Elliott Wave Commodity April 2022 report – fig #2) and as the war with Russia rolls on, so has there been talk of major shortages due to disruptions in the spring planting season. There’s also problems with supplies of fertilizers which rely on natural gas for conversion. And natural gas prices have risen exponentially over the last couple of years. China is apparently hoarding over half of the world’s grain. This year, China will have 69% per cent of the world’s corn, 60% per cent of its rice and 51% per cent of its wheat. The question is why? Are they expecting some catastrophic event?
Commodity Spotlight China
Beginning in 1999/2000, China implemented grain policies to reduce its excessive stocks. By early 2004, with global stocks at a more normal level relative to use, global rice prices began to slowly increase. Prices then rose exponentially higher. However, China secured a long-term lease with Madagascar back in 2008 to grow rice ensuring supplies when prices had just reached an all-time-peak. In hindsight, that was a really bad trade as prices collapsed lower in subsequent years. Which means the build-up of its current stockpile might simply be due to a hard learning curve from the rice explosion of a decade earlier.
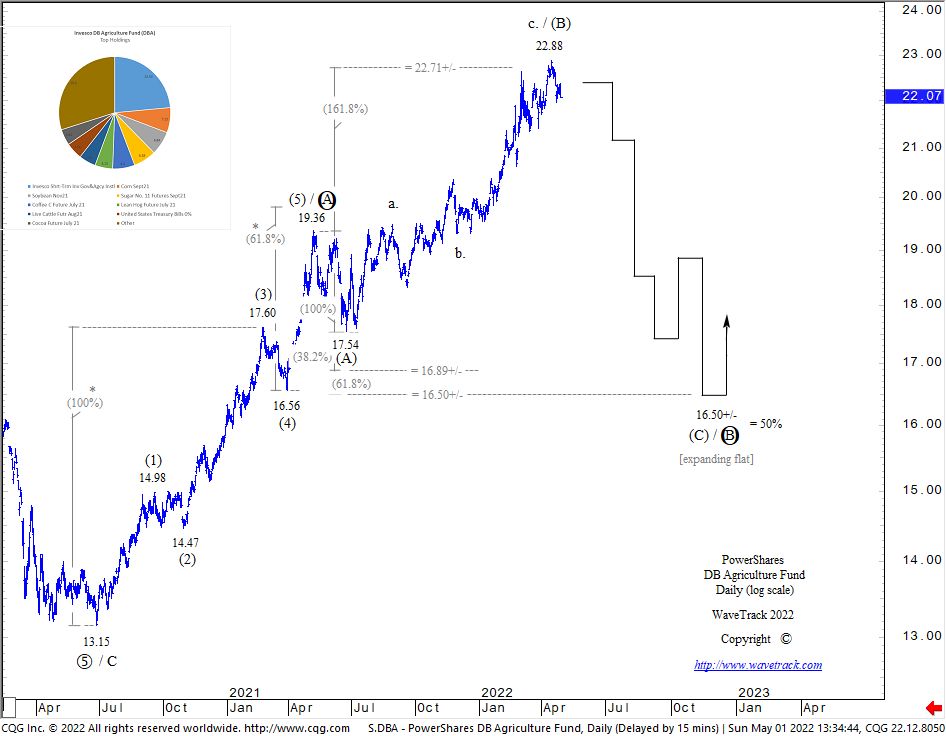
Fig #1 – PowerShares DB Agriculture Fund – Daily by WaveTrack International
The DB Agriculture Fund (ETF) has unfolded higher from the pandemic low of 13.15. Now, completing a five wave impulse pattern into the May ’21 high of 19.36 as primary wave A – see fig #1. This is an important date as will become apparent later. It’s the same date that ended the post-pandemic five wave impulse uptrend for the US10yr Breakeven Inflation Rate (TIPS) and for LME 3mths Copper. All three contracts have since begun corrective downswings in the form of expanding flats. For the Agriculture Fund, this is labelled in intermediate degree, (A)-(B)-(C) where wave (B) has just completed into April’s high of 22.88. Wave (C) is set to decline over the coming months. Ultimate targets remain unchanged towards 16.50+/-.
Food & Agriculture Index
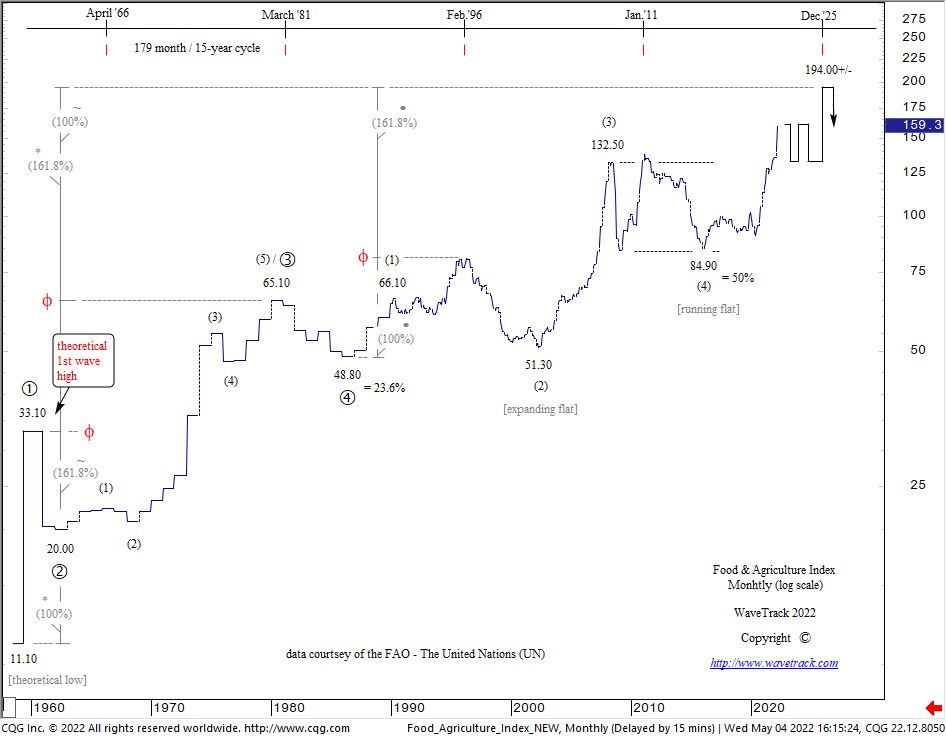
Fig #2 – Food and Agriculture Index – Monthly by WaveTrack International
The Food & Agriculture Organisation, a division of the United Nations posted latest data for the Food & Agriculture Index – see fig #2. Intermediate wave (5)’s advance within the long-term primary degree uptrend began from grand ‘Re-Synchronisation’ low of 84.90 of late-2015/early-2016. This advance is developing nicely, into a smaller degree five wave impulse pattern, i-ii-iii-iv-v where its 3rd wave is peaking now at 159.30. Note, a corrective 4th wave is forecast over the next 6-8 month period. This is an indication that the current scarcity narrative being broadcast in mainstream media is overcooked. A correction would also mean inflationary pressures are set to pause for a while.
Special Coverage of Base Metals, Precious Metals, Energy and Metal Miners in WaveTrack’s latest Elliott Wave Commodity Report
Available here EW-Commodity Report Subscription for USD 240 per month.
Currencies + Interest Rates Video Outlook 2022 | PART III/III
by WaveTrack International| March 1, 2022 | No Comments
Currencies + Interest Rates Video Outlook 2022 | PART III/III
Currencies – US$ Dollar Index Approaching 14-Month Corrective Upside Target – Next Declines Begin Multi-Year Downtrend – US$ Dollar Devaluation Ahead – Loss of Confidence as Reserve Currency – G10 Currency Pairs Begin New Uptrends Due to US$ Weakness – Commodity Currencies Bullish Despite Underlying Commodity Correction – Asian ADXY Currencies Begin New Uptrends – U.S. Long-Dated Interest Rates Form Important Highs – Begin Multi-Month Corrective Downswings – Shorter-Dated Yields Mixed/Trending Higher But Mature – Flattening Continues – European Long-Dated Interest Rates Hit Tops – Downside Corrections – Flattening Curve – Italy/Australia/Japan All Confirm Corrective Declines Ahead – Inflationary Pressures Ease/Decline
INCLUDES ANALYSIS ON MAJOR US$ DOLLAR PAIRS/CROSSES – ASIAN/EM CURRENCIES – MEDIUM-TERM CYCLES – LONG-DATED YIELDS US/EUROPE/ITALY/AUSTRALIA/JAPAN + MANY SPREADS
Currencies EW-Forecasts for 2022
The US$ dollar index is engaged in a 15.6-year to max. 16-year cycle that connects troughs-to-troughs or lows-to-lows over the last several decades going back to the 1960’s – see fig’s #227 & #229 in the Currencies and Interest Rates report. The corresponding peaks are ‘centrally translated’, a cycle term we use to describe the time-interval that marks the half-way point of the full cycle period, i.e. half of 15.6-years is 7.8-years. But it’s more than that – centrally translated actually means dividing the 15.6-year interval in half so that there are approximately equal periods of upward/rising dollar strength versus downward/declining weakness.
The 15.6-year and 16-year cycles both project the US$ dollar lower during the next several years, into lows due around 2024-27. The Elliott Wave modelling provides some idea of the amplitude of this decline.
Currenies + Crypto-Currencies
Bitcoin’s long-term uptrend remains in progress from its inception trade of $0.08 back in 2010 – ultimate upside targets during next several years towards 295.400+/-. A trading-range triangle is continuing to develop April ’21 high of 64858.10 with another upswing during next months – Review Daily Bitcoin forecast – Fig #326. Ethereum set to outperform Bitcoin during next few years basis Ethereum/Bitcoin Ratio widening from 0.07127 out to 0.45000+/-.
Fig #326 – Bitcoin – Daily Elliott Wave Forecast by WaveTrack International
Currencies – The Next 6-8 Months
Once the US$ dollar index ends last year’s correction, it then begins a new downtrend, resuming primary wave 3 as minor wave iii. three within intermediate wave (3). From an Elliott Wave standpoint, that evokes an accelerative 3rd-of-3rd wave decline which will be devastating for the dollar. What could trigger such a decline?
The most probable driver is rising costs and inflationary pressures. Whilst we expect a pause in inflationary pressures this year, central banks are ‘behind-the-curve’, are late in responding to the last year’s rising inflationary pressures. They are ready to hike interest rates, borrowing costs at a time when those very inflationary measures are about to turn down for 6-8 months. However, the Federal Reserve in particular, is panicking.
If they begin hiking/tightening at a time when long-dated yields are declining because of an economic correction, then an unwinding of the inflation-trade positioning would see the dollar decline for the remainder of this year. And in 2023, continuing to trend lower because deflating the dollar is the only way out for the U.S. government and the Federal Reserve to lessen its dollar payment obligations.
Highlights – Interest Rates
The 60-year cycle in Corporate AAA Bond Yields formed a major low in July 2016 which ordinarily translates into a new sustained half-cycle uptrend of 30+/- years – but the COVID-19 coronavirus pandemic has forced more monetary accommodation from central banks, prolonging the previous 30-year cycle downtrend even longer – but the March ’20 lows are finally secure, confirming a new 30+ year uptrend for interest rates has begun.
Inflation – U.S. CPI is running at 40-year highs at 7.5% per cent. However, this is perfectly in-line with our long-term ‘Inflation-Pop’ cycle that peaks around 2024-27. CPI is completing a five wave impulse uptrend from the March ’20 pandemic low indicating a pause in the in inflationary pressures for the remainder of this year. US10yr Real Yields have begun to trend higher from last year’s low of -1.190%. Whilst the outlook continues rising inflationary pressures, a shorter-term correction is due to begin. US10yr TIPS also trending higher over the medium/long-term although a dip shorter-term. US10yr Breakeven Inflation Rate is forecast lower during next several months from 2.493 to 1.723+/- again indicating a pause in inflation expectations. The U.S. Fed Funds rate is currently at the 0.00-0.25% per cent band but is pricing-in several rate hikes this year as the Federal Reserve change to a tightening policy.
This is WaveTrack’s most comprehensive Currencies and Interest Rates Video Outlook to date. Check out the table of contents below and if you are trading Currencies – don’t miss it!
We invite you to take this next step in our financial journey with us – video subscription details are below – just follow the links and we’ll see you soon!
Most sincerely,
Peter Goodburn
Founder and Chief Elliott Wave Analyst
WaveTrack International
What you get!
Contents: 150 charts | VIDEO DURATION: nearly 3 hours 30 mins.
The contents of this CURRENCIES & INTEREST RATES VIDEO include Elliott Wave analysis for:
Currencies (101 charts):
• US$ Index + Cycles
• Euro/US$ + Cycles
• Stlg/US$
• US$/Yen
• US$/CHF
• US$/NOK
• US$/SEK
• AUD/US$
• US$/CAD
• NZD/US$
• Euro/Stlg
• Euro/NOK
• Euro/Yen
• Euro/CNY
• Stlg/YEN
• Stlg/NOK
• Stlg/ZAR
• AUD/YEN
• AUD/Renminbi
• AUD/NZD
• Asian ADXY
• US$/Renminbi
• US$/KRW
• US$/SGD
• US$/INR
• US$/TWD
• USD/THB
• US$/MYR
• US$/IDR
• US$/PHP
• USD/BRL
• USD/RUB
• US$/ZAR
• US$/MXN
• US$/TRY
• US$/PLZ
• Bitcoin
• Ethereum
Interest Rates (49 charts):
• US CPI
• US PCE
• US10yr Real Yield
• US30yr Yield + Cycles
• US10yr Yield + Cycles
• US5yr Yield
• US2yr Yield
• US2yr-10yr Yield Spread
• US10yr-30yr Yield Spread
• 3mth EuroDollar-US10yr Yield Spread
• Comparison US10-DE10yr vs S&P 500
• US10yr TIPS Break Even Inflation Rate
• US10-DE10yr Yield Spread
• DE10yr Yield
• ITY10yr Yield
• Italy10-DE10yr Yield Spread
• Australia 10yr Yield
• Japan 10yr Yield
How to buy the Currencies + Interest Rates Video Outlook 2022
Simply contact us @ services@wavetrack.com to buy the CURRENCIES + INTEREST RATES Video Outlook 2022 for USD 48.00 (+ VAT where applicable) or alternatively our Triple Video Offer for USD 96.00 (+ VAT where applicable) – Review the content of WaveTrack Stock Indices Video PART I here and the Commodities Video PART II here.
*(additional VAT may be added depending on your country – currently US, Canada, Asia have no added VAT but most European countries do)
We’re sure you’ll reap the benefits – don’t forget to contact us with any Elliott Wave questions – Peter is always keen to hear you views, queries and comments.
Visit us @ www.wavetrack.com
Russia RTS Index Update!
by WaveTrack International| February 25, 2022 | No Comments
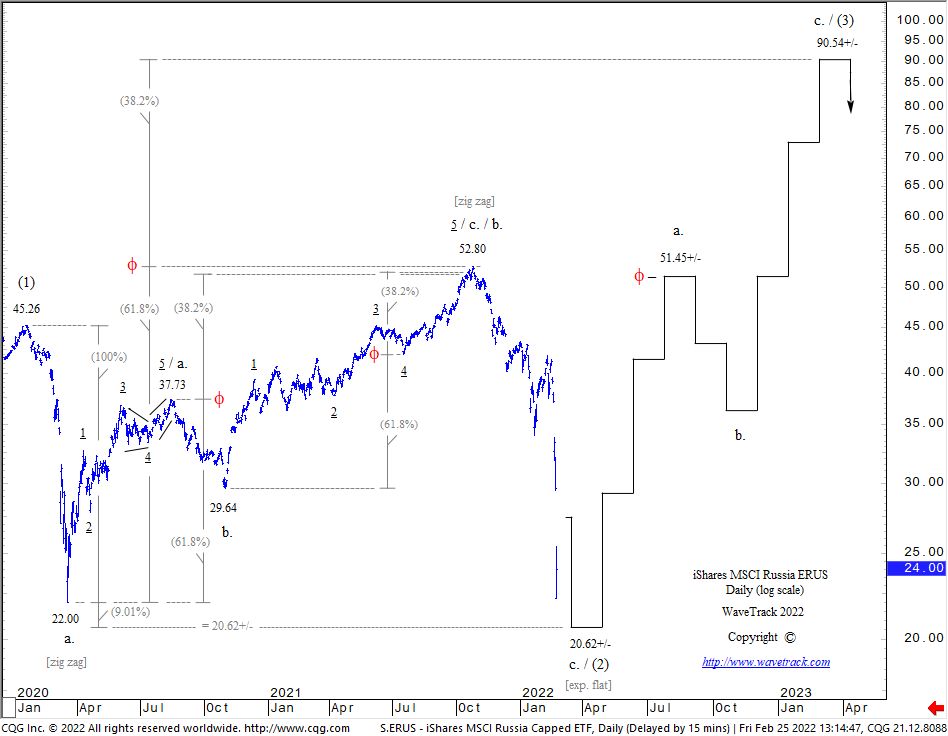
Fig #1 – Russia RTS Index financial forecast by www.wavetrack.com
Russia RTS Plunge Over!
The Russia RTS Index shows that intermediate wave (2) is approaching a downside completion as an a-b-c Elliott Wave expanding flat pattern (ETF symbol ERUS) – see Fig #1.
The larger uptrend is amazing!
Special Coverage of the Russia RTS Indices in tonight’s Elliott Wave Compass Report
See tonight’s EW-Compass Report for more details.
COMMODITIES VIDEO OUTLOOK 2022 Part II
by WaveTrack International| January 28, 2022 | No Comments

We’re pleased to announce the publication of WaveTrack’s annual 2022 video outlook of medium-term ELLIOTT WAVE price-forecasts. Today’s release is PART II, COMMODITIES – Part I was released last month and Part III will be published in late-February
• PART I – STOCK INDICES – out now!
• PART II – COMMODITIES – out now!
• PART III – CURRENCIES & INTEREST RATES – coming soon!
Inflation-Pop within Deflationary Cycle
Commodities have been the largest contributor of rising inflationary pressures over the last year as Consumer Prices (CPI’s) from around the world surge to 30-year highs – in the U.S., headline CPI has recently printed levels to 7.1% whilst Fed Funds have remains stuck at the Fed’s current all-time-low of 0.00%-0.25% per cent – US10yr yields only 1.900%.
These huge price rises have been expected though, part of the second stage of the ‘Inflation-Pop’ cycle that began from the grand ‘Re-Synchronisation’ lows of 2016. Many commodities like Copper forged secondary lows at the beginning of 2016, others like Crude/Brent oil joined the inflation-pop cycle much later and from much lower, comparable levels, at the pandemic lows of March ’20. But all have one thing in common – these price advances, although huge, are part of a much longer term ‘deflationary cycle’ that is balancing the end of the ‘Commodity Super-Cycle’ that unfolded from the Great Depression lows of 1932 into the orthodox end in 2006-08.
Rising Inflationary Pressures – Food & Energy
Recent investment bank surveys show the biggest concern amongst large asset funds is rising inflationary pressures – it’s not surprising the Federal Reserve having seen CPI above 7.0% per cent have panicked, reversing policy that inflation was transitory into its current persistent dialogue. It seemed obvious last year the Fed would end up chasing their own tail in a catch-up situation of rising inflation whilst holding back on interest rate rises – we now see the central bank unwinding its bond-buying programme in preparation for interest rate rises in March this year. With commodities expected to undergo severe corrections this year, inflationary pressures are forecast to pull back from recent highs prior to resuming higher in 2023/24. See fig #1
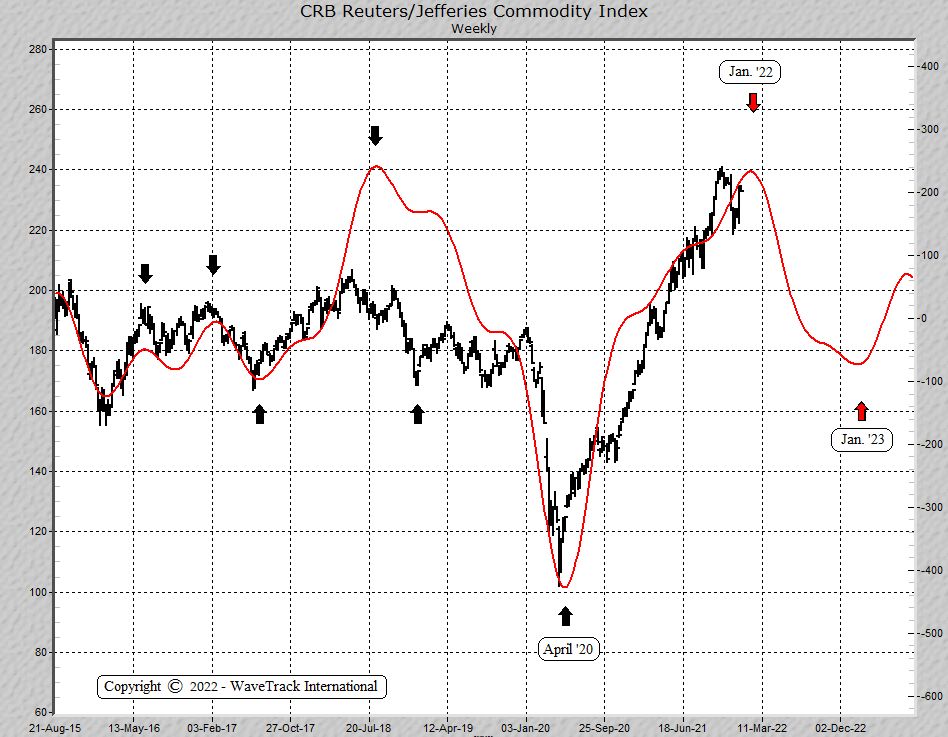
Fig #1 – CRB Index Cycle by WaveTrack International
Commodity Correction During Next 6-8 Months
Whilst commodity prices have surged higher from the pandemic lows of March ’20, many have unfolded higher into five wave impulse patterns, either ending last May ’21 like Copper, or into more recent highs like Crude/Brent oil, depending on the commodity. These disparative highs are not uniform which makes it difficult to pinpoint when exhaustion tops occur, but when some underperform, i.e. Copper pulls lower from last year’s highs whilst Crude/Brent oil make higher-highs, this sets-up bearish divergences across many technical signals – a bearish warning of impending price declines.
Rare Earth Metals
Rare Earth Metals have seen exponential price rises from pandemic lows – this report features price forecasts for the VanEck Vectors Rare Earth ETF and analysis of MP Materials Corp. who owns and operates he Mountain Pass mine, the only operating rare earth mine and processing facility in the United States. See fig #2
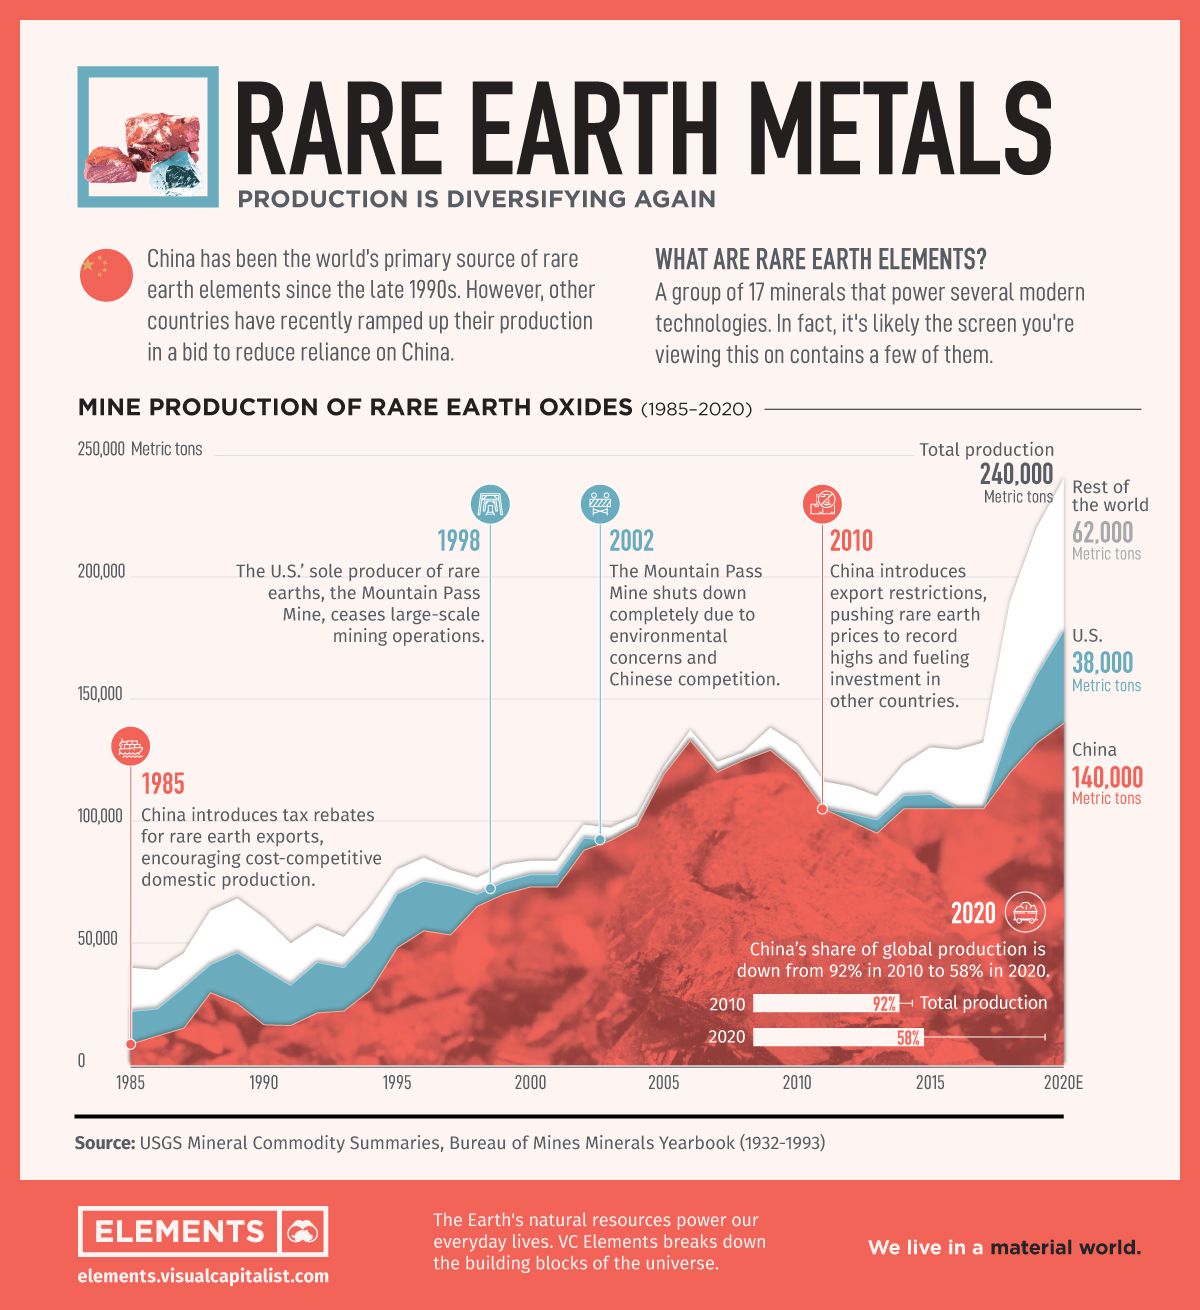
Fig #2 – Rare Earth Metals – Worldwide by courtesy of Elements.visualcapitalist.com
Commodities Video Part II
Contents: 125 charts
Time: 2 hours 47 mins.
• US PCE Inflation
• US CPI
• Food and Agriculture Index
• Lumber
• CRB-Cash index
• US Dollar index + Cycles
• Copper + Cycles
• Aluminium
• Lead
• Zinc
• Nickel
• Tin
• XME Metals & Mining Index
• BHP-Billiton
• Freeport McMoran
• Antofagasta
• Anglo American
• Glencore
• Rio Tinto
• Teck Resources
• Vale
• Gold + Cycles
• GDX Gold Miners Index
• Newmont Mining
• Amer Barrick Gold
• Agnico Eagle Mines
• AngloGold Ashanti
• Fresnillo Silver
• Silver + Cycles
• Silver/Copper Correlation
• XAU Gold/Silver Index
• Gold-Silver Ratio
• Gold/Platinum Spread
• Platinum
• Palladium
• Rare Earths
• Iron Ore
• Uranium
• Crude Oil + Cycles
• Brent Oil
• XLE Energy SPDR
• XOP Oil and Gas Index
• Natural Gas
How can you purchase the video?
1. Contact us @ services@wavetrack.com and ask for a PayPal payment link (please state if you like to purchase the Commodities Single video or the Triple Video?).
2. Ask for an individual credit card payment link (in case you do not with to pay via PayPal).
*(additional VAT may be added depending on your country – currently US, Canada, Asia have no added VAT but most European countries do)
We’re sure you’ll reap the benefits – don’t forget to contact us with any Elliott Wave questions – Peter is always keen to hear you views, queries and comments.
Visit us @ www.wavetrack.com
We’re sure you’ll reap the benefits. Don’t forget to contact us with any Elliott Wave questions. Our EW-team is always keen to hear your views, queries, and comments.
Visit us @ www.wavetrack.com
STOCK INDICES VIDEO OUTLOOK 2022 Part I
by WaveTrack International| December 29, 2021 | No Comments
STOCK INDICES VIDEO OUTLOOK 2022 Part I/III
SEVERE CORRECTION in 2022
Post-Pandemic Advance Set to Take a Pause within Final Stage of Secular-Bull Uptrend – Risk of minus -30 to -40% Correction in Benchmark Indices during next 6-8 Months – Inflationary Pressures Ease but Not Over – European Indices set for Significant Correction – Technology/FANGS+ Undergo Severe Sell-Off in 2022 – Secular-Bull Uptrend Peak On-Track for 2023-24
Stock Indices Video Update
The post-pandemic advances from the March ’20 lows are reaching interim peaks in their overall development within the final stages of the secular-bull uptrend. These interim uptrends have in many cases, already ended into November’s highs. However, there are other indices/sectors that can stretch to higher-highs during the next month, into early new year, 2022. This largely depends on asset allocation and rotation, but any higher-highs are likely to be short-lived.
A repeat of 2020’s sell-off from the January/February peaks are expected this year, in 2022. Furthermore, declines in U.S./European indices are expected to undergo corrections of between minus -30% to -40% per cent. This is more limited in many Emerging Market indices and especially China where declines are relatively modest by comparison.
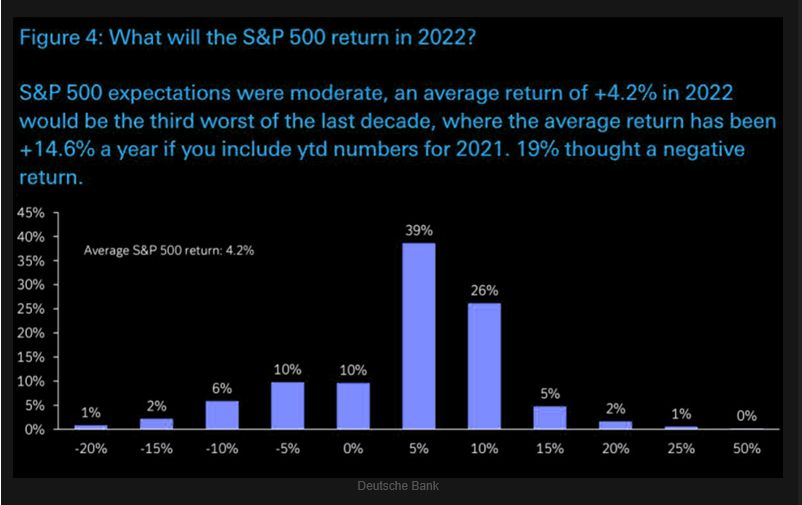
Fig #1 – What will the SP500 return in 2022? Source: Deutsche Bank
Deutsche Bank conducted a survey to its clients, asking what expected return for the SP500 is forecast for 2022 – see fig #1. The result predominantly shows most, 39% expects a positive return for next year at +5% per cent – 26% expects a gain of +10% per cent and 5% per cent expects a gain of 15% per cent. Contrastingly, 26% expect declines of between 0.0% or max. -10% per cent.
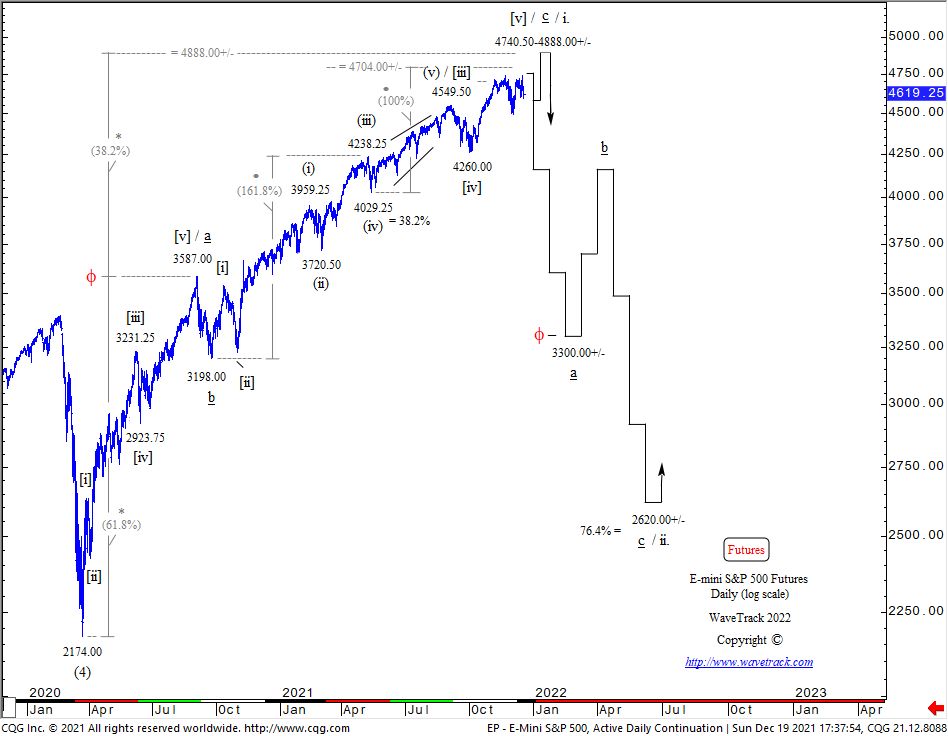
Fig #2 – E-Mini SP500 Futures – Daily by WaveTrack International
The predominant bullish calls are what we’d expect near the top of a stock market uptrend. Mainly, from a contrarian standpoint, it heightens the probability of a correction next year. However, it also shows the current complacency in the market – no one is expecting a correction of between minus -30% to max. -40% as Elliott Wave analysis predicts – see fig #2.
Inflation
Rising inflationary pressures have dominated financial markets during 2021 and this is expected to continue during the first month or two into the new year, 2022. The headline U.S. Consumer Price Index has surged higher to 6.8% in November with Food rising by 6.1% year-on-year whilst Energy has risen by 33.3% per cent. However, all these are expected to stage an interim peak during the next month or two, then beginning corrective declines. Rising inflationary pressures don’t resume higher until Q3/Q4 2022.
Annual 2022 Forecasts – Report/Video
Our annual 2022 Stock Indices report/video is PART I of a three-part trilogy series of Elliott Wave analysis, an outlook for the next year and into the final stages of the secular-bull ‘Inflation-Pop’ cycle.
We’ll be taking a close introspective look across many U.S. indices, the large-cap and small-cap trends. But also across many different sectors too including the FANGS+ index, U.S./European Banks, Biotechnology, Technology and many more. We’re also updating some fascinating Elliott Wave counts for several economic data points too, including Consumer Sentiment, Consumer Confidence, Price to Book Ratio, Price-Sales Ratio! There’s some interesting results from the recent upsurge in inflationary pressures too!
New Stock Indices 2022 Video – PART I/III
This ANNUAL 2022 VIDEO UPDATE for STOCK INDICES is like nothing you’ve seen anywhere else in the world. It’s unique to WaveTrack International, how we foresee trends developing through the lens of Elliott Wave Principle (EWP) and how its forecasts correlate with Cycles, Sentiment extremes and Economic data trends.
We invite you to take this next step in our financial journey with us – video subscription details are below – just follow the links and we’ll see you soon!
Most sincerely,
Peter Goodburn
Founder and Chief Elliott Wave Analyst
WaveTrack International
Contents Stock Indices Video Outlook 2022
Charts: 98 | Video: 2 hours 40 mins.
Read more «STOCK INDICES VIDEO OUTLOOK 2022 Part I»

Recent Posts
Recent Comments
Archives
- February 2026
- December 2025
- August 2025
- July 2025
- June 2025
- March 2025
- February 2025
- January 2025
- December 2024
- August 2024
- July 2024
- June 2024
- May 2024
- April 2024
- February 2024
- January 2024
- December 2023
- August 2023
- July 2023
- June 2023
- March 2023
- February 2023
- January 2023
- December 2022
- November 2022
- October 2022
- August 2022
- July 2022
- June 2022
- May 2022
- March 2022
- February 2022
- January 2022
- December 2021
- August 2021
- July 2021
- June 2021
- March 2021
- February 2021
- January 2021
- December 2020
- November 2020
- August 2020
- July 2020
- June 2020
- May 2020
- April 2020
- March 2020
- February 2020
- January 2020
- December 2019
- October 2019
- September 2019
- July 2019
- June 2019
- May 2019
- April 2019
- March 2019
- February 2019
- January 2019
- December 2018
- November 2018
- September 2018
- August 2018
- July 2018
- June 2018
- May 2018
- April 2018
- March 2018
- February 2018
- January 2018
- December 2017
- November 2017
- October 2017
- September 2017
- August 2017
- July 2017
- June 2017
- May 2017
- March 2017
- February 2017
- January 2017
- December 2016
- November 2016
- October 2016
- September 2016
- August 2016
- July 2016
- June 2016
- May 2016
- April 2016
- March 2016
- February 2016
- January 2016
- December 2015
- November 2015
- October 2015
- September 2015
- August 2015
- July 2015
- June 2015
- May 2015
- April 2015
- March 2015
- February 2015
- January 2015
- December 2014
- November 2014
- October 2014
- September 2014
- August 2014
- July 2014
- June 2014
- May 2014
- April 2014
- March 2014
- February 2014
- January 2014
- December 2013
- November 2013
- October 2013
- September 2013
- August 2013
- July 2013
- June 2013
- May 2013
- April 2013
- March 2013
- February 2013
- January 2013
- December 2012
- November 2012
- October 2012
- September 2012
- August 2012
Categories
- ADXY Index
- Agnico Eagle Mines
- AI Artificial Intelligence
- Alcoa
- Amazon
- AngloGold Ashanti
- Antofagasta
- APPL
- Apple
- ASX 200
- AUD vs USD
- AUDNZD
- AUDUSD
- Australia ASX 200
- Baltic Dry Index
- Banking
- Base Metals
- Biotechnology
- Bitcoin
- Bovespa
- Broadcom
- Catalexit
- central banks
- Christmas
- Commodities
- Commodities Video Outlook 2020
- Conference
- Copper
- Coronavirus Sell-Off
- CRB
- Crude oil
- crude oil price chart
- CryptoCurrency
- Currencies
- Currencies + Interest Rates Video Outlook
- Cycles
- Dax 30
- deutsche bank
- Dewey Cycle
- DJ Transportation Average
- DJ Utilities
- Dow Jones 30
- Dow Theory
- ECB
- economy
- Elliott Wave
- Elliott Wave Charts
- Elliott Wave Patterns
- Elliott Wave Principle
- Emerging Markets
- Ending-Diagonal Elliott Wave Pattern
- Equity
- EUR vs CHF
- EUR/USD
- Euro / US$
- Eurostoxx 50
- EuroStoxx50
- EuroStoxxBanks
- EURUSD
- Expanding Flat Pattern
- FAAMG
- FANG+
- fib-price-ratio
- Fibonacci Trading
- Fibonacci-Price-Ratio
- Financial Forecasting
- Fixed Income
- forex
- Freeport McMoran
- FTSE 100
- Fund Management
- FX
- FXStreet
- GBP/AUD
- GBP/USD
- GDX
- GDXJ
- Germany 10 year Euro Bund future
- Gilead Sciences
- Glencore
- Global Economy
- Gold
- Gold Mining
- Golden Ratio
- goldman sachs
- Google Inc.
- Google/Alphabeth
- Greek debt crisis
- Hang Seng
- Harbinger
- Hungarian Forint
- IBEX 35 Index Spain
- Independent Research
- India-CNX Nifty 50
- Interest Rates
- Interview
- IRP Independent Research
- kbw bank index
- Lonmin
- MAG-7
- McDonald's
- MID-YEAR VIDEO UPDATE!
- Mifid II
- Mines
- Mining
- MSCI China
- MSCI Emerging Markets
- Nasdaq 100
- Nasdaq Biotechnology Index
- Nasdaq Composite
- Nasdaq100
- Netflix
- Newmont Mining
- Nikkei 225
- NVIDIA
- NYSE Composite Index
- Palladium
- Platinum
- Precious Metals
- Ralph Nelson Elliott
- Reversal-Signature
- Russell 2000
- Russia RTS
- S&P 500
- Sector
- Secular-Bull
- Sentiment Survey
- Shanghai Composite Index
- Silver
- Slanting Flat Elliott Wave Pattern
- SP100
- SP400 Mid-Cap
- SP500
- SPX 500
- STLG/AUD
- Stlg/US$
- STLG/USD
- STLG/YEN
- STLG/ZAR
- Stock Index
- Stock Index Tracking
- Stock Index Video
- Stock Indices
- Stock Indices Video Outlook 2023
- Stock Indices Video Outlook 2025
- Sugar
- Summary
- Tesla
- Tesla Inc
- Toyota
- Track Record
- trading
- Trusts
- Tutorial
- Uncategorized
- UniCredit
- US
- US Dollar Index (DXY) (USDX)
- US$ Index
- US-Dollar Index
- US10yrYields
- USD
- USD/ARS
- USD/CNY
- USD/IDR
- USD/INR
- USD/MXN
- USD/SGD
- USD/THB
- USD/YEN
- USD/ZAR
- Vale
- Value Line Index
- video
- VIDEO OUTLOOK 2018
- VIDEO OUTLOOK 2020
- VIX
- W.D. Gann
- WaveTrack International
- XAU Gold/Silver Index
- Xetra Dax
- XOP
- Yields
- Zig Zag
- Zinc
- ‘INFLATION-POP’
- ‘SHOCK-POP-DROP’