S&P 500 Daily reversal
by m.tamosauskas| January 24, 2014 | No Comments
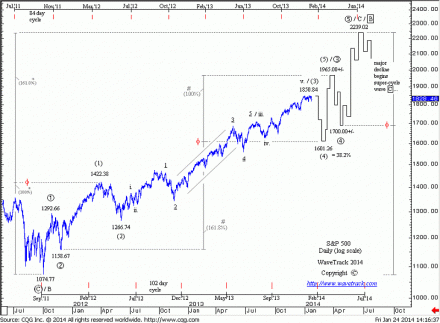
A break below the mid-January low now looks inevitable for the S&P. This is an important support level that requires penetration to confirm a final high for intermediate wave (3) at the recent 1850.84 high. There is an increasing probability that the 1850.84 print has now completed the entirety of wave (3) that began from the June ’12 low of 1266.74. Looking ahead, a fib. 38.2% correction for intermediate wave (4) projects down to 1601.26.
Inverted VIX
by m.tamosauskas| January 24, 2014 | No Comments
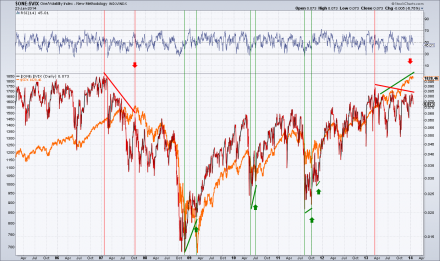
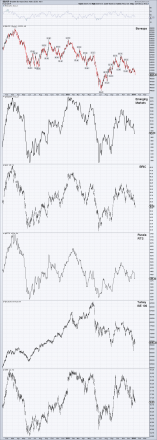
This chart is showing an updated correlation between S&P 500 and invertded VIX index. As can be seen the correlation is possitive and a negative divergence between these two creates a trend change event. The last negative divergence occoured in 2007. It took about one year to unfold but the SELL (S&P 500) signal proved to be right. Today we have very simmilar situation – a negative divergence is developing for about one year. However, S&P 500 is still in an uptrend since all the way back from 2012 there is no a single intermediate lower low. It needs to break below the December ’13 low of 1767.99 to confirm the signal.
S&P 500 Weekly
by m.tamosauskas| January 17, 2014 | No Comments
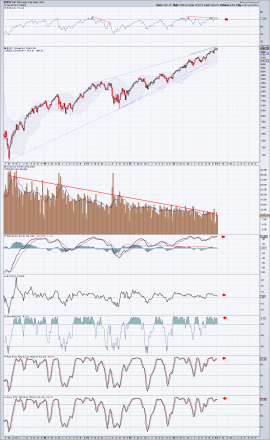
S&P 500 is stretching to incredible overbought levels. Feels like this market is never going to decline more than a few per cents down. Traditional TA indicators are diverging for quite some time, volume declining all the way down from the early 2009. Talking about limits:
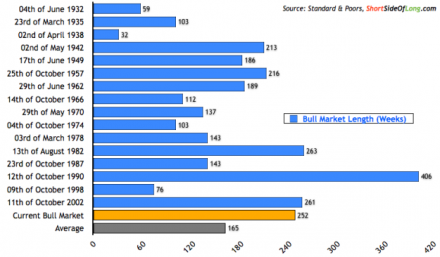
Shortsideofthelong.com observes that the current bull market after a few more weeks will be the second longest during the last 80 years. Incredible indeed!
Emerging Markets
by m.tamosauskas| January 10, 2014 | No Comments
Let’s get back to the bussiness! 🙂 First of all, happy New Year! Operating our business is about both teamwork, and friendship. We have proved this by working together this past year, and look forward to the year ahead.The coming year, 2014, is expected to be the most important year for a generation. Dramatic trend changes are forecast into late 2014. The ‘Inflation-Pop’ phase that began from the post financial-crisis lows of 2008/09 remains in force. Prices are again forecast higher this year but into a finalising peak due mid/late-2014 – the exact timing depending on cycle studies and pattern development. Some dislocation of upward price amplitude occurred during the second half of 2013 – this means that Asian and Emerging Market indices will attempt to ‘catch-up’ with U.S. equivalents in 2014 resulting in outperformance. Some are expected to advance in excess of +100% per cent. Looking for opportunities, we have to revise which markets have been underperforming. Here are our candidates. Some of these markets are expected to stage impressive rallies during 2014. What is your favorite? 😉
Announcement
by m.tamosauskas| December 19, 2013 | No Comments
It’s time to rest again 🙂
Today we are publishing the last update before the Christmas holiday festivities begin. We shall all take the opportunity to rest a little during the following week or so. The next blog post is scheduled early next year, 8th January 2014.
Season’s greetings and wishing you success for 2014 – Peter Goodburn, Kamil & Martynas.
Copper/EM to surge higher in 2014
by m.tamosauskas| December 19, 2013 | No Comments
The base metal Copper is commonly named ‘Doctor Copper’. The definition is a result of its ability to diagnose and predict turning points in the global economy. Copper is widely used in most sectors of the economy – from homes and factories, to electronics and power generation. The demand for copper is often viewed as a reliable leading indicator of economic health and this demand is reflected in the market price of copper. Generally, rising copper prices suggest strong copper demand and hence a growing global economy, while declining copper prices may indicate sluggish demand and an imminent economic slowdown. So, by trying to forecast the future price of copper, we may gain some insight as to the strength of the global economy.
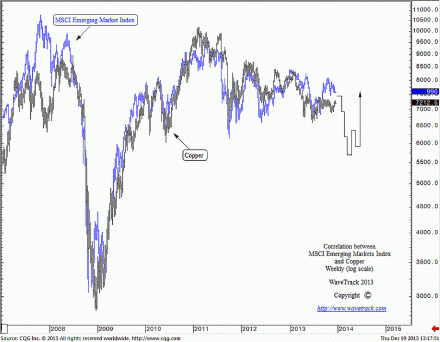
Copper prices are positively correlated to the stock market, specifically the S&P 500. But there was a price dislocation breaking this relationship last June ’13 onwards where copper continued its counter-trend decline from the Feb.’11 highs, whilst the S&P 500 continued its upward march to new record highs. This can be explained as many emerging market stock indices that are positively correlated to copper were continuing to trend lower. This relationship can be observed between LME Copper and the MSCI Emerging Market Index – see chart below.
Both declined sharply during the financial-crisis of ‘07-’08, subsequently staging an impressive upside recovery during ’09-’10. But, beginning from early 2011, copper and the MSCI Emerging Markets Index began a counter-trend decline that remains in progress. By extrapolating the Elliott Wave count for one, we will have much better chances in determining the direction of the other. In this special EW-Compass issue we are introducing our primary Elliott Wave count for copper and the correlation between this base metal and MSCI Emerging Markets Index. Both suggest a finalising sell-off begins in early 2014 so as to complete the overall counter-trend decline that began three years earlier. But once completed, Copper and the MSCI EM are expected to surge higher beginning the last phase of the ‘inflation-pop’ with price expectancy to new record highs.
In tomorrow’ss EW-Compass report we will introduce additional chart showing our primary count for the Copper with downside targets in early 2014 and upside targets that would follow.
Hang Seng Index
by m.tamosauskas| December 13, 2013 | No Comments
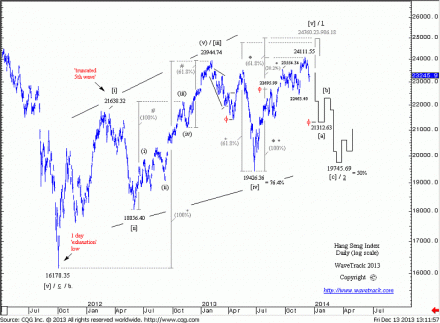
The Hang Seng continued lower which is a positive sign that the current outlook is on track. As the downswing from 24111.55 is seen to be a counter-trend correction to the entire advance from the Oct.’11 low of 16170.35, ultimate targets are measured to 19745.69, the fib. 50% retracement. Cutting this by the ‘golden-section’ fib. 61.8% ratio, interim support is projected to 21312.63. Although the chances of a possible upside extension towards 24850.00+/- are considered very low, the ‘alternate’ solution (drawn in grey) is still shown.
Slanting Flat
by m.tamosauskas| December 6, 2013 | No Comments
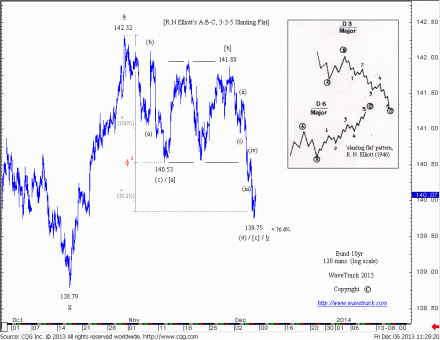
Everybody familiar with the Elliott Wave Theory can recognize these flat patterns –expanding, running and horizontal, however, have you ever heard of ‘Slanting Flat’ pattern? It is extremely rare but was originally discovered by R.N. Elliott. We think we found one just recently unfolding in 10 year Bunds contract:
Flats are subdividing into a 3-3-5 waves sequence, for any kind of usual flat wave ‘B’ must trade below wave ‘A’ starting point that creates a new price extreme, but in a case of slanting flat, wave ‘B’ ends in the price territory of wave ‘A’. As can be seen on this particular example (Bund 10yr, 120 mins.) minuette wave [a] ended at 140.53 and was followed by minuette wave [b] that completed at 141.88 – in a range of minuette wave [a]’s territory (142.32-140.53). Finally, the subsequent decline unfolded into a five wave expanding-impulse pattern as minuette wave [c] with a completion at 139.75. This pattern is complicating to predict but we hope to record more of these examples and do a research to improve predictability in the future.
by m.tamosauskas| November 29, 2013 | No Comments
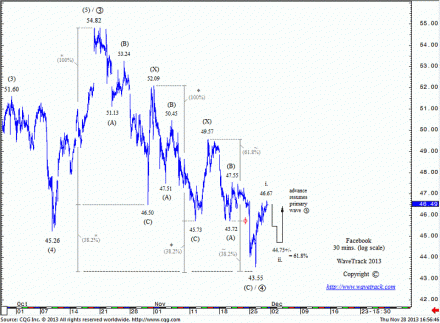
Facebook’s price development is displaying a concise Elliott Wave patterning whilst adhering to geometric ratio and proportion measurements. The focus of this chart is to emphasise the close convergences of various fib-price-ratio measurements at precisely the same price levels – also, the strong price rejection that followed. These were derived by using three different measurements: 1) extending the first zig zag sequence (54.82-46.50) by a fib. 38.2% ratio to 43.32 – 2) extending the secondary zig zag (52.09-45.73) by a fib. 38.2% ratio to 43.30 – 3) extending intermediate wave (A) of the third zig zag sequence by a fib. 61.8% ratio to 43.34. The actual low traded late November at 43.55. We can even the 4th measurement – it tested the fib. 38.2% retracement level of primary wave 3. Ultimate upside targets and the larger picture will be introduced in today’s bonus EW-Compass section! Good luck and have a great weekend!
Cycles
by m.tamosauskas| November 22, 2013 | No Comments
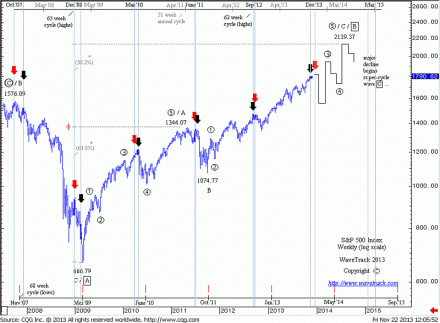
This weekly chart that depicts the larger upswing from the March ’09 low of 666.79 has been incorporated because it emphasizes the cyclic structure of the S&P’s price action. Especially a 62- and a 65-week cycle have been of great value during the last four years as they coincided with important tops. The interesting observation is that both the 62- and 65-week cycle indicate a high in the time band between now and mid-December.
