A little bit of practice
by m.tamosauskas| April 4, 2014 | No Comments
Dear Elliott Wave Enthusiasts!
I’d like to tell you that we’ve just published a BONUS REPORT on Precious Metals into the Elliott Wave Compass report. But first, I’d like to ask you a question. How good are your eyes at recognising and identifying Elliott Wave patterns?
R.N.Elliott documented 13 specific price-patterns that form his Theory – they are composed into two groups, ‘impulse’ (action/growth/expansion/progress etc. ) and ‘corrective’ (reaction/decay/contraction/regress etc.) – they are,
IMPULSE:
Five wave ‘expanding-impulse’
Five wave ‘contracting diagonal-impulse’
Five wave ‘expanding diagonal-impulse’
CORRECTIVE:
Zig Zag – single
Zig Zag – double
Zig Zag – triple
Flat – horizontal
Flat – expanding
Flat – running
Triangle – contracting
Triangle – ascending
Triangle – descending
Triangle – expanding
You can check these out here:
https://www.wavetrack.com//tutorials/the-wave-principle.html#Thirteen-Patterns
TEST YOUR KNOWLEDGE
But when it comes to applying the Elliott Wave Principle in real-time, can you transform the chaotic ‘noise’ into one of those patterns he described? We have a good example to test you.
You’ve perhaps noticed that Gold has changed direction again since forming a high in Mid-March. Take a look at this chart in fig #1 below – this is the GDX Gold Miners ETF – what pattern do you see?

Don’t scroll immediately lower, or you’ll see the result, test your knowledge first by selecting one of the above patterns in R.N.Elliott’s list (do you remember what they look like? – if not, refer to the website graphics in the link above). Once you have your answer, scroll down to see the result!
THE ANSWER IS BELOW
The answer is a RUNNING FLAT – see fig #2 below. The running flat is a ‘corrective’ pattern, unfolding in the opposite direction to the prevailing trend – in this case downwards. It is composed of three main price-swings and we have labelled this in intermediate degree, (A)-(B)-(C). Notice its subdivides 3-3-5, so that wave (A) unfolds into a three wave zig zag, wave (B) as another zig zag and finally wave (C) as a five wave ‘expanding-impulse’ pattern.

The RUNNING FLAT is distinguished from an expanding flat because wave (C) does not exceed the termination (high) of wave (A) – this means it effectively ‘truncates’ and is a sign of a weakening condition – buyers into the high are not strong enough to push prices above the more common price target level above wave (A).
Did you recognise it?
From an Elliott Wave perspective, this is a picture-perfect example of the archetypal running flat pattern, not only from the structural aspect, but also from the geometric Fibonacci-ratio aspect.
SPECIAL BONUS REPORT – Precious Metals
We have just updated this pattern into our current forecasts for precious metals and have now published the results into a special BONUS REPORT that is added to the EW-Compass subscription. The report shows how the running flat pattern fits into the larger/aggregate pattern developing from the 2011 highs for the GDX but also for the XAU Gold/Silver index, and of course for GOLD & SILVER bullion.
This report is invaluable because it describes the finalisation of declines within the up-coming ‘INFLATION-POP’ scenario. We have posted a lot of analysis on this subject on our website at wavetrack.com – just type in INFLATION POP into the text search function and take a look for yourself. I can’t stress how important it is to track the precious metals at the moment.
The latest PRECIOUS METALS BONUS report is refers to previous reports – you can compare these forecasts and see how well they have performed – just go the ‘SPECIALS TAB’ in the EW-COMPASS software to download them FREE, as part of your subscription.
And one last thing – WaveTrack International’s 2014 price-forecasts can also be viewed in two hour-long videos, PART I and PART II. These Elliott Wave forecasts remain valid, and are vitally important especially when we follow the path that precious metals are unfolding into during the next several years.
So don’t delay – take a look at the latest short-term price forecasts, but also how the medium and long-term forecasts are corroborating something spectacular is developing. And don’t forget to send us your feedback! Just use the Help-Desk located in the main-page of wavetrack.com.
All the very best to you!
Peter Goodburn
Chief Elliott Wave Analyst
WaveTrack International
geometric beauty and harmony (AMAZON)
by m.tamosauskas| March 28, 2014 | No Comments
R. N. Elliott’s monograph entitled ‘Nature’s Law’ published in 1946 dedicated an entire chapter to the geometric ratio and proportion qualities of the Elliott Wave Principle. This was the result of his earlier introduction to the Fibonacci Summation Series by Charles J. Collins. Its application was ‘work in progress’ but unfortunately, R. N. Elliott passed away two years later. Despite this however, he left a legacy for us to continue its development and discovery. The use of modern-day computers has accelerated our understanding and our realisation of its frequency within developing EW patterns. This adherence of fib-price-ratios has increased pattern identification whilst helping to minimise the inherent ‘subjectivity’ of human pre-conception that so often results in erroneous wave counting.
We’d like to introduce you to an excellent example of fib-price-ratio adherence within an action-reaction process, an impulse wave followed by a progressive corrective wave. The equity Amazon.com Inc. has recently completed a text-book five wave expanding-impulse pattern into the Jan.’14 high whilst unfolding into archetypal fib-price-ratio measurements.
The complete analysis is added to this month’s Bonus Chart in the latest edition of the EW-Compass report – so don’t miss this chance to explore the geometric beauty and harmony embedded within the price development of Elliott Wave Principle.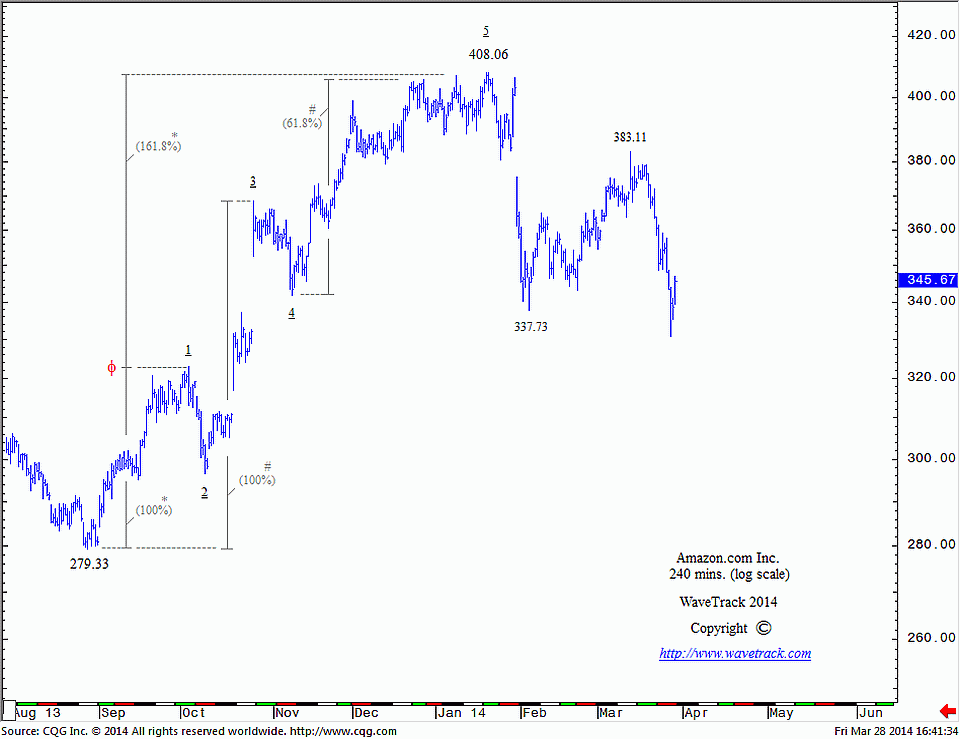
EW-Compass improvements!
by m.tamosauskas| March 19, 2014 | No Comments
Following on the results of the questionnaire (see EW-Compass announcement, March 13th), and in response to your feedback, we’ve decided to make some improvements to the report. We introduced and will rotate additional contracts that you voted for inclusion U.S. Russell 2000 index, Australian ASX200 and China’s Shanghai Composite index – we will also add to this list the Aussie/US$ currency, US$/CAD$, US$/Swiss Franc and something else time from time depending on market activity and your interest!
S&P 500 major resistance level
by m.tamosauskas| March 14, 2014 | No Comments
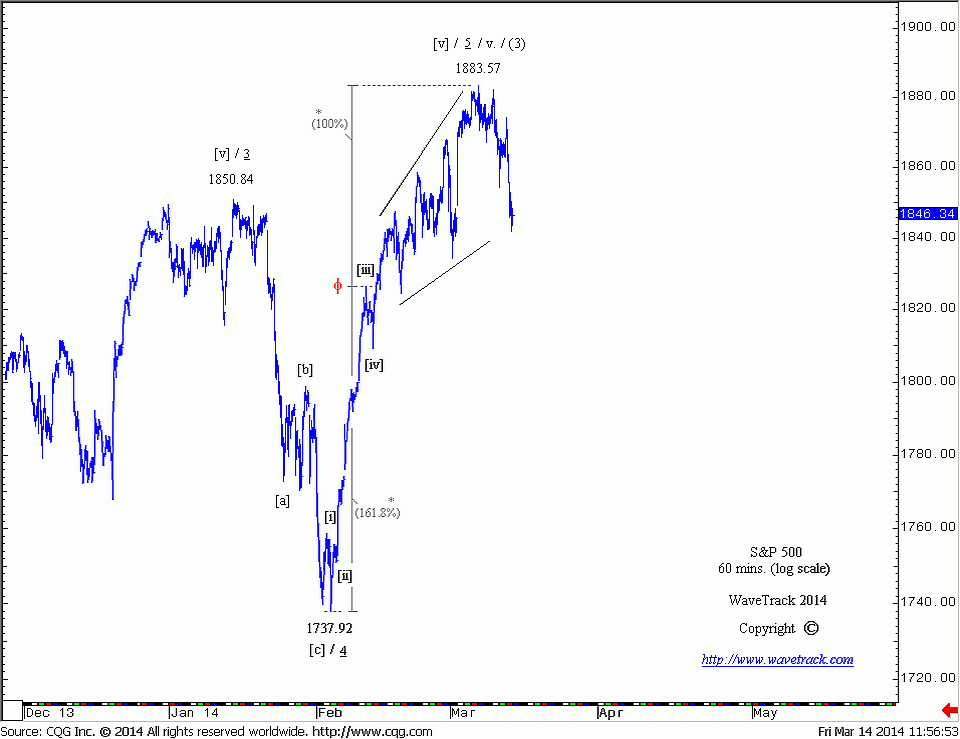
The advance that began from the early Feb.’14 low of 1737.92 unfolded into a five wave expanding-impulse pattern, labelled in minuette degree, with a completion into the recent high of 1883.57. Extending the next advance between waves [i] and [iii] by a fib. 61.8% ratio it depicts the exact high of wave [v] at 1883.57. Precisely to the point! Moreover, there is another hidden golden ratio – extending minor wave i. (1266.74-1475.51) by a fib. 161.8% ratio, upside targets was measured towards 1885.26, less than 2 points to the exact high. Now, it becomes a double convergence and an additional proves S&P 500 has reached a strong resistance level. The following decline began a balancing process of the preceding advance. Become an EW-Compass subscriber and find out the next fib-price-ratios and there the next major support level is located!
Russia RTS
by m.tamosauskas| March 3, 2014 | No Comments
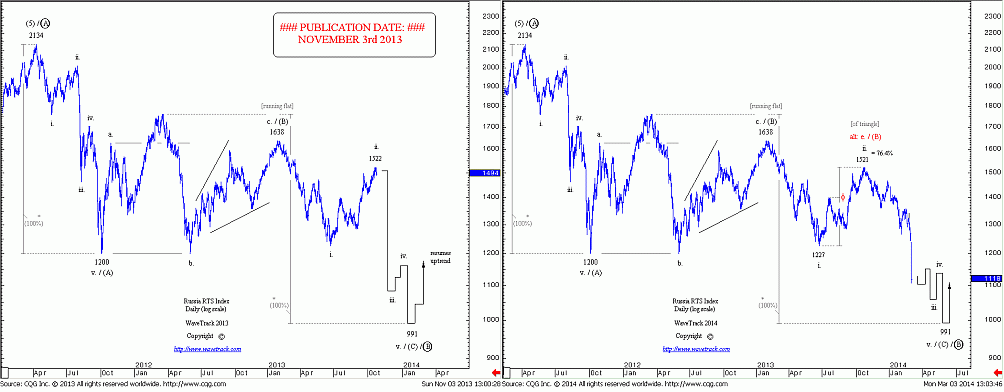
By no means we were projecting this downside target basen on current fundamental news, but the forecast published November ’13 remains in progress. The good news about that – the worst part for the Russia RTS index (wave 3rd of 3rd) hasn’t produced anything catastophic, so let’s hope only a downside momentum has left.
Peter Goodburn on CNBC
by m.tamosauskas| February 28, 2014 | No Comments
Today Peter Goodburn was attending in CNBC and explaining the big story developing in Emerging Markets and industrial metals. Check this video by clicking this link:
http://video.cnbc.com/gallery/?video=3000248332
Tomorrow live on CNBC
by m.tamosauskas| February 27, 2014 | No Comments
CNBC – Live Interview with Peter Goodburn -tomorrow- 7 a.m. GMT, London time – 28th February 2014.
This is a unique opportunity to listen to Peter Goodburn’s views for the base metals market on CNBC’s flagship show Squawk Box.
Link in & watch the show live tomorrow!
http://www.cnbc.com/id/15838652
New record high – S&P 500 Update
by m.tamosauskas| February 24, 2014 | 12 Comments
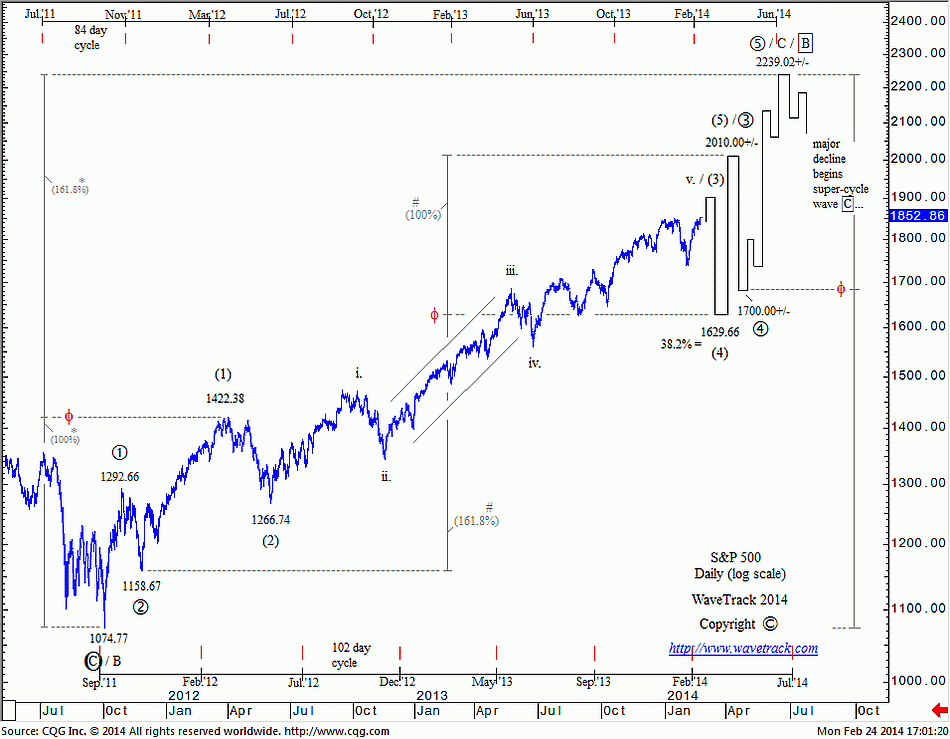
Cycle wave C is in upside progress beginning from the Oct.’11 low of 1074.77. It is taking the form of a five wave expanding-impulse pattern with several degrees of subdivision in its expanding 3rd wave as primary wave 3 that began from the secondary low of 1158.67. Intermediate wave (3) is shown with immediate upside potential to 1900.00+/- prior to a sustained sell-off as wave (4) to the fib. 38.2% retracement at 1629.66+/-.
Silver
by m.tamosauskas| February 14, 2014 | No Comments
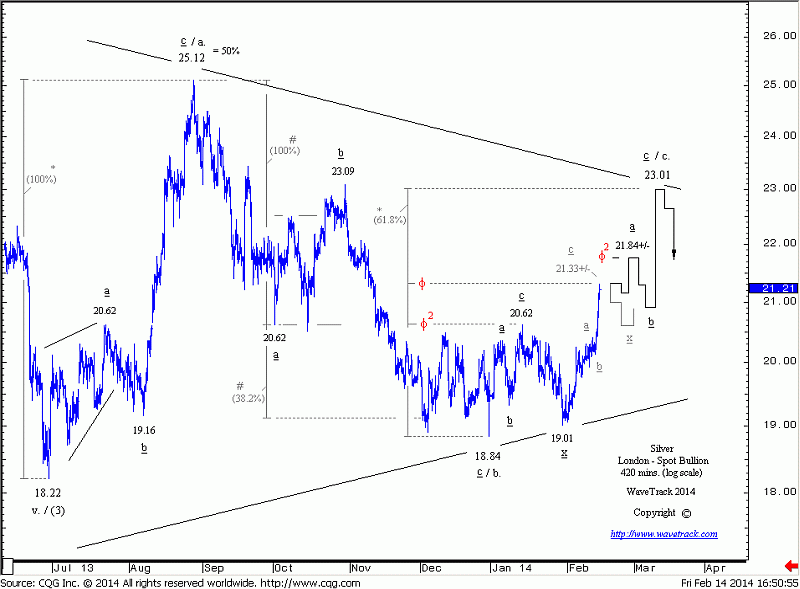
A lot of excitement today in the precious metal market since gold and silver are breaking above their 200-day moving average. However, our view remains the same – the larger declines are still in progress with lower lows yet to come. The advances that began in June ’13 depict gold is unfolding into a counter-trend horizontal flat pattern, whilst silver is unfolding into a contracting triangle. This short-term silver chart shows minor wave c. is in progress with two additional price-swings (minor waves d. and e.) required to complete the sequence.
by m.tamosauskas| February 13, 2014 | No Comments
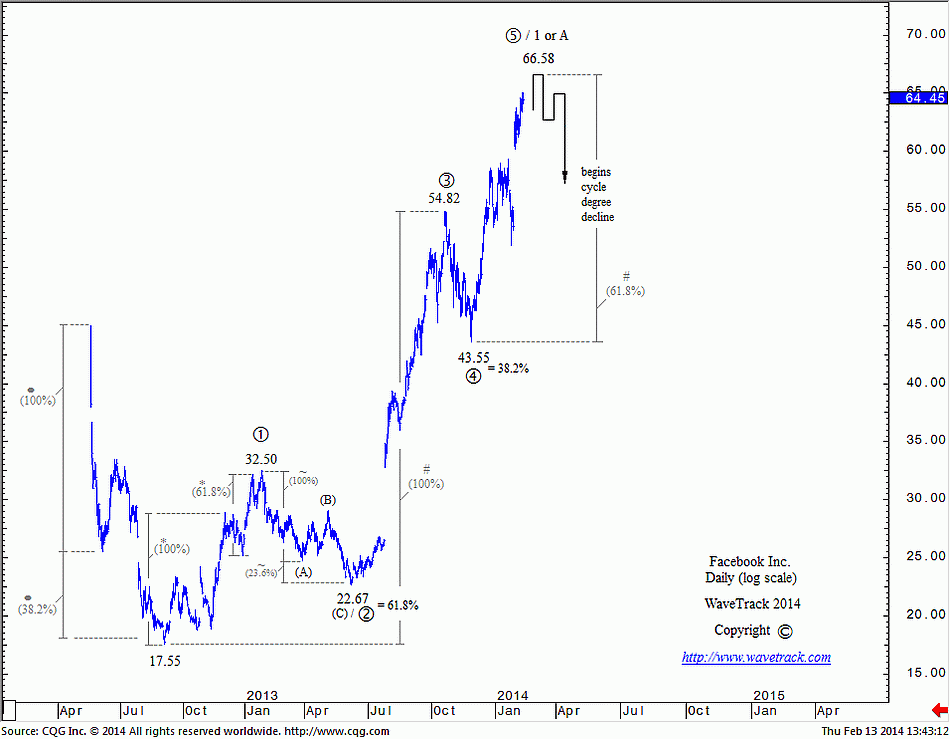
Facebook is maintaining the upside momentum. The advance that began from the Sep.’12 low of 17.55 is expected to unfold into a five wave expanding-impulse pattern labelled 1-2-3-4-5 in primary degree. Ultimate upside target is extended towards 66.58 and is derived by using a fib. 61.8% correlation ratio between the net advance of primary waves 1 to 3 (17.55-54.82) and wave 5.
Since the data history of Facebook is limited, it is difficult to extrapolate the larger degree pattern; however, any five wave advance must be balanced by a counter-trend decline and so, once upside target to 66.58 has been tested, Facebook is expected to stage a multi-month decline with minimum downside targets measured towards 43.35+/- – back to a smaller degree 4th wave preceding.

Recent Posts
Recent Comments
Archives
- August 2026
- July 2026
- June 2026
- February 2026
- December 2025
- August 2025
- July 2025
- June 2025
- March 2025
- February 2025
- January 2025
- December 2024
- August 2024
- July 2024
- June 2024
- May 2024
- April 2024
- February 2024
- January 2024
- December 2023
- August 2023
- July 2023
- June 2023
- March 2023
- February 2023
- January 2023
- December 2022
- November 2022
- October 2022
- August 2022
- July 2022
- June 2022
- May 2022
- March 2022
- February 2022
- January 2022
- December 2021
- August 2021
- July 2021
- June 2021
- March 2021
- February 2021
- January 2021
- December 2020
- November 2020
- August 2020
- July 2020
- June 2020
- May 2020
- April 2020
- March 2020
- February 2020
- January 2020
- December 2019
- October 2019
- September 2019
- July 2019
- June 2019
- May 2019
- April 2019
- March 2019
- February 2019
- January 2019
- December 2018
- November 2018
- September 2018
- August 2018
- July 2018
- June 2018
- May 2018
- April 2018
- March 2018
- February 2018
- January 2018
- December 2017
- November 2017
- October 2017
- September 2017
- August 2017
- July 2017
- June 2017
- May 2017
- March 2017
- February 2017
- January 2017
- December 2016
- November 2016
- October 2016
- September 2016
- August 2016
- July 2016
- June 2016
- May 2016
- April 2016
- March 2016
- February 2016
- January 2016
- December 2015
- November 2015
- October 2015
- September 2015
- August 2015
- July 2015
- June 2015
- May 2015
- April 2015
- March 2015
- February 2015
- January 2015
- December 2014
- November 2014
- October 2014
- September 2014
- August 2014
- July 2014
- June 2014
- May 2014
- April 2014
- March 2014
- February 2014
- January 2014
- December 2013
- November 2013
- October 2013
- September 2013
- August 2013
- July 2013
- June 2013
- May 2013
- April 2013
- March 2013
- February 2013
- January 2013
- December 2012
- November 2012
- October 2012
- September 2012
- August 2012
Categories
- ADXY Index
- Agnico Eagle Mines
- AI Artificial Intelligence
- Alcoa
- Amazon
- AngloGold Ashanti
- Antofagasta
- APPL
- Apple
- ASX 200
- AUD vs USD
- AUD/YEN
- AUDNZD
- AUDUSD
- Australia ASX 200
- Baltic Dry Index
- Banking
- Base Metals
- Biotechnology
- Bitcoin
- Bovespa
- Broadcom
- Campanhia Siderugica
- Catalexit
- central banks
- CHF/Yen
- Christmas
- Commodities
- Commodities Video Outlook
- Commodities Video Outlook 2020
- Conference
- Copper
- Coronavirus Sell-Off
- CRB
- Crude oil
- crude oil price chart
- CryptoCurrency
- Currencies
- Currencies + Interest Rates Video Outlook
- Cycles
- Dax 30
- deutsche bank
- Dewey Cycle
- DJ Transportation Average
- DJ Utilities
- Dow Jones 30
- Dow Theory
- ECB
- economy
- Elliott Wave
- Elliott Wave Charts
- Elliott Wave Patterns
- Elliott Wave Principle
- Emerging Markets
- Ending-Diagonal Elliott Wave Pattern
- Equity
- EUR vs CHF
- EUR/CHF
- EUR/USD
- Euro / US$
- Eurostoxx 50
- EuroStoxx50
- EuroStoxxBanks
- EURUSD
- Expanding Flat Pattern
- FAAMG
- FANG+
- fib-price-ratio
- Fibonacci Trading
- Fibonacci-Price-Ratio
- Financial Forecasting
- Fixed Income
- forex
- Fortescu Metals
- Freeport McMoran
- FTSE 100
- Fund Management
- FX
- FXStreet
- GBP/AUD
- GBP/USD
- GDX
- GDXJ
- Gerdau Steel
- Germany 10 year Euro Bund future
- Gilead Sciences
- Glencore
- Global Economy
- Gold
- Gold Mining
- Golden Ratio
- goldman sachs
- Google Inc.
- Google/Alphabeth
- Greek debt crisis
- Hang Seng
- Harbinger
- Hungarian Forint
- IBEX 35 Index Spain
- Independent Research
- India-CNX Nifty 50
- Interest Rates
- Interview
- IRP Independent Research
- kbw bank index
- Lonmin
- MAG-7
- McDonald's
- MID-YEAR VIDEO UPDATE!
- Mifid II
- Mines
- Mining
- MSCI China
- MSCI Emerging Markets
- Nasdaq 100
- Nasdaq Biotechnology Index
- Nasdaq Composite
- Nasdaq100
- Netflix
- Newmont Mining
- Nikkei 225
- NVIDIA
- NYSE Composite Index
- Palladium
- Platinum
- Precious Metals
- Ralph Nelson Elliott
- Reversal-Signature
- Russell 2000
- Russia RTS
- S&P 500
- Sector
- Secular-Bull
- Sentiment Survey
- Shanghai Composite Index
- Silver
- Slanting Flat Elliott Wave Pattern
- SP100
- SP400 Mid-Cap
- SP500
- SPX 500
- STLG/AUD
- Stlg/US$
- STLG/USD
- STLG/YEN
- STLG/ZAR
- Stock Index
- Stock Index Tracking
- Stock Index Video
- Stock Indices
- Stock Indices Video Outlook 2023
- Stock Indices Video Outlook 2025
- Sugar
- Summary
- Tesla
- Tesla Inc
- Toyota
- Track Record
- trading
- Trusts
- Tutorial
- Uncategorized
- UniCredit
- US
- US Dollar Index (DXY) (USDX)
- US$ Index
- US-Dollar Index
- US10yrYields
- USD
- USD/ARS
- USD/CNY
- USD/IDR
- USD/INR
- USD/MXN
- USD/NOK
- USD/SEK
- USD/SGD
- USD/THB
- USD/YEN
- USD/ZAR
- Vale
- Value Line Index
- video
- VIDEO OUTLOOK 2018
- VIDEO OUTLOOK 2020
- VIX
- W.D. Gann
- WaveTrack International
- XAU Gold/Silver Index
- Xetra Dax
- XOP
- Yields
- Zig Zag
- Zinc
- ‘INFLATION-POP’
- ‘SHOCK-POP-DROP’