Australia ASX 200
by m.tamosauskas| May 23, 2014 | No Comments
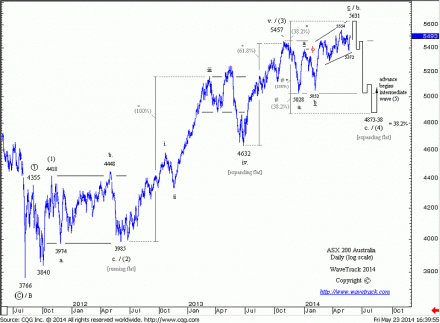
Due to the price spike into Wednesday’s low of 5372 which renders the sell-off from 5554 into a more complex single zig zag sequence, the ending diagonal in progress from the Feb.’14 low of 5052 now has to be described as an expanding type. This does not however change original upside targets that are still measured by a fib. 38.2% upside extension of the 5457-5028 decline and project to 5631 during the next few weeks. These upside levels are in line with expectations based on the assumption of an expanding flat sequence that is shown unfolding as intermediate wave (4) and subdividing into a 3-3-5 sequence in minor degree, a-b-c. Wave a. declines to 5028 are currently followed by wave b. advances. Once a reversal from 5631+/- occurs, it will trigger wave c. declines to ultimate downside at 4873-38 measured by a fib. 38.2% downside extension of wave a. and the fib. 38.2% retracement of intermediate wave (3).
Crude Oil
by m.tamosauskas| May 16, 2014 | No Comments
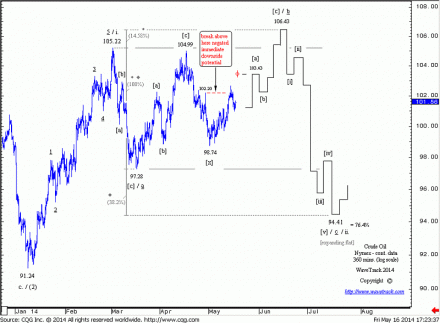
Crude oil continues to trade in a very complex pattern sequence since establishing its upswing from January’s low of 91.24 into the March high of 105.22. Our latest short-term update describes a subsequent three wave decline from 105.22 into the March low at 97.28 followed by three waves up into the April high of 104.99 – another three price-swing decline into the early May low at 98.74 and now a break above the interim high of 102.20. Unscrambling these sequences into a visible Elliott Wave pattern translates into a developing expanding flat in progress as minor wave ii. from the 105.22 high. Three price swings down form a zig zag to 97.28 as minute wave a followed by a double zig zag upswing in progress as wave b to 106.43. A final five wave impulse decline then begins minute wave c towards 94.41 derived by extending wave a by a fib. 38.2% ratio. We remain alert to alternatives although this current pattern seems the most obvious for its current development. The medium-term uptrend remains intact.
Crude Oil
by m.tamosauskas| May 9, 2014 | No Comments
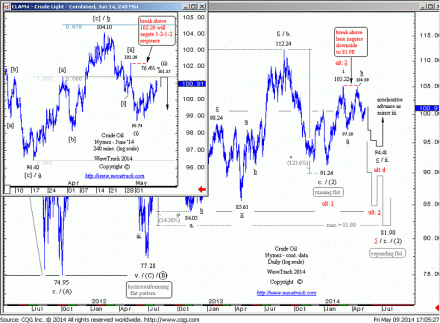
The advance from the 1st of May low of 98.74 is seen as a counter-trend rally that is balancing the preceding sell-off from 102.20. The entire decline from 104.10 (outright contract) or 104.99 (continuation chart) can be labelled as a 1-2-1 sequence which limits current upside potential – the 102.20 high should not be broken in order to maintain downside momentum. What is the Elliott Wave count? There are two scenarios which are both assigned a high probability – the first depicts a 2nd wave counter-trend decline labelled minor wave ii. that is unfolding into a single zig zag decline from the 105.22 high and projected to downside at 94.41; the second advocates much lower objectives towards 81.90 in the months ahead as a larger expanding flat pattern labelled intermediate wave (2) is about to finalise.
India Nifty 50
by m.tamosauskas| May 2, 2014 | 1 Comment
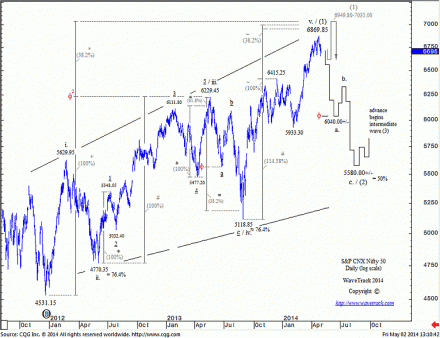
The Nifty 50 has advanced into a similar leading expanding-diagonal pattern as compared to the Hang Seng from its Dec.’11 low of 4531.15 but has outperformed since last December, and only now approaching a terminal upside completion of the pattern at 6869.85. There is now an increasing risk that it has begun a severe multi-month counter-trend decline. Idealised fib-price-ratio targets still a little higher, to 6949.80-7035.00 but these will be put aside should the current decline from the high extend lower during the next week. A counter-trend decline is labelled as a 2nd wave with interim targets to 6040.00 but an ultimate downside test to the fib. 50% retracement level at 5580.00+/-.
Can 3’s end a 5 wave pattern?
by m.tamosauskas| April 11, 2014 | No Comments
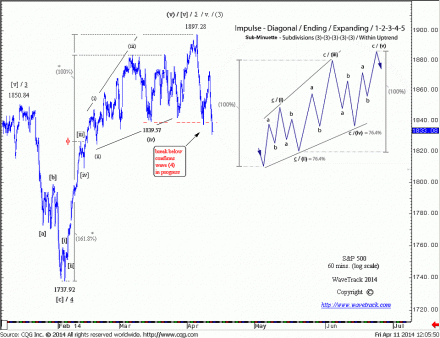
The S&P 500 has been approaching an important high during the last few weeks as its five wave impulse advance beginning from the June ’12 low of 1266.74 nears the completion for intermediate wave (3). This is affirmed where minor wave i. one of (3) is extended by a fib. 161.8% ratio to project minor wave v. five of (3) to a high at 1885.26.
Minor wave v. five began a final upswing from the June ’13 low of 1560.33 and this subdivides into a smaller five wave expanding-impulse pattern, 1–2–3–4–5. Minute wave 5 five began its final advance from the early-Feb.’14 low of 1737.92 – see chart. But when subdividing this into a smaller five wave sequence, there is one visible stand-out – the final advance from the mid-March low of 1839.57 unfolded into a three wave sequence, a zig zag. How can a mature uptrend finalise into a three wave pattern, when ordinarily, a five is required?
This three wave sequence has certainly muddled the picture and eluded the casual Elliott Wave practitioner’s eye – but look closely, and the answer can be found.
Following last Friday’s ‘key-reversal-signature’ (April 4th) and now Thursday’s break (April 10th) below key support levels at 1839.57, there is no doubt that the 1897.28 high ended the 21 month advance as wave (3) – but what about that three wave sequence into the high?
The fifth wave of the Feb.’14 advance has taken the form of an ending expanding-diagonal pattern. Composed of five price-swings, each of its ‘impulse’ sequences, waves (i)-(iii)-(v) commonly subdivide into three price-swing patterns, zig zags (or multiples, doubles/triples). The finalising advance as wave (v) from the 1839.57 level can be clearly seen unfolding higher into a zig zag to the 1897.28 high – this explains why the overall advance has ended into a ‘three’ wave sequence, not a usual ‘five’ – see inset tutorial chart, top-right for comparison.
Russell 2000 leading U.S. decline
by m.tamosauskas| April 9, 2014 | No Comments
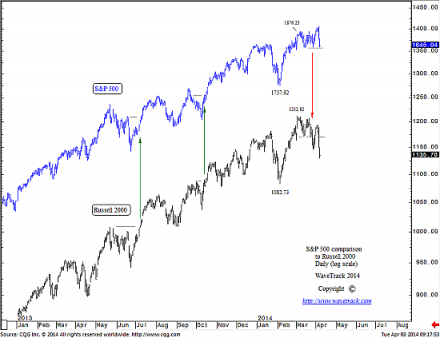
The Russell 2000 index which is compiled of small capitalisation companies tends to lead the broader U.S. stock market – directionally upwards and downwards. Small companies are more sensitive to economic conditions and assume more risk than larger, more-established companies that make up the S&P 500. The relationship between the S&P 500 and the Russell 2000 has provided reliable guidance in the past in identifying early changes in market direction. This phenomenon is expected to remain constant in the future.
Last year, in 2013, the Russell 2000 was leading to the upside on two separate occasions by breaking first into new record highs whilst the S&P 500 was trading well below its previous highs. Ultimately, the S&P 500 caught up later and broke into new record highs proving that once again, the Russell 2000 was the leading index.
But so far, in early 2014, a different story is developing – the Russell now appears to be leading to the downside. Last week, whilst the Russell 2000 was trading well below its early March’14 high of 1212.82, the S&P index recorded yet another record high forming a bearish divergence. The Russell’s decline is forming lower highs and lower lows confirming a downtrend in progress as the S&P stages a reversal signature demonstrating it preparedness in following its index counter-part lower.
In our latest EW-Compass reports, both the S&P 500 and the Russell 2000 were forewarned as completing advances that began from the June ’12 lows. The negative divergence between these two indices and a subsequent reversal signature for the S&P last Friday has since confirmed a multi-month decline is underway.
We’re really excited about this next decline because it will be the largest we’ve seen for almost two years – but this is still labelled as a counter-trend pattern. For the last several years, our ‘inflation-pop’ scenario has forecast upside price levels into new record highs – whilst this has been realised, the measured targets remain untested. Once the current counter-trend decline has reached downside targets, the larger advance is set to resume.
We’d like to invite you to join us in this next part of our journey of the ‘inflation-pop’ scenario by becoming a member of the EW-Compass community!
A little bit of practice
by m.tamosauskas| April 4, 2014 | No Comments
Dear Elliott Wave Enthusiasts!
I’d like to tell you that we’ve just published a BONUS REPORT on Precious Metals into the Elliott Wave Compass report. But first, I’d like to ask you a question. How good are your eyes at recognising and identifying Elliott Wave patterns?
R.N.Elliott documented 13 specific price-patterns that form his Theory – they are composed into two groups, ‘impulse’ (action/growth/expansion/progress etc. ) and ‘corrective’ (reaction/decay/contraction/regress etc.) – they are,
IMPULSE:
Five wave ‘expanding-impulse’
Five wave ‘contracting diagonal-impulse’
Five wave ‘expanding diagonal-impulse’
CORRECTIVE:
Zig Zag – single
Zig Zag – double
Zig Zag – triple
Flat – horizontal
Flat – expanding
Flat – running
Triangle – contracting
Triangle – ascending
Triangle – descending
Triangle – expanding
You can check these out here:
https://www.wavetrack.com//tutorials/the-wave-principle.html#Thirteen-Patterns
TEST YOUR KNOWLEDGE
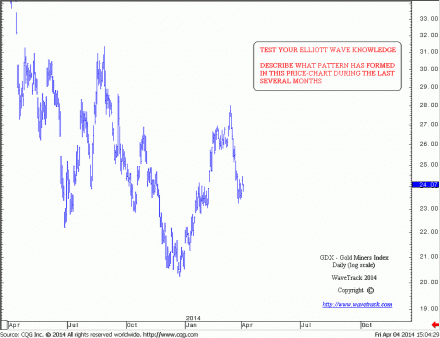
But when it comes to applying the Elliott Wave Principle in real-time, can you transform the chaotic ‘noise’ into one of those patterns he described? We have a good example to test you.
You’ve perhaps noticed that Gold has changed direction again since forming a high in Mid-March. Take a look at this chart in fig #1 below – this is the GDX Gold Miners ETF – what pattern do you see?
Don’t scroll immediately lower, or you’ll see the result, test your knowledge first by selecting one of the above patterns in R.N.Elliott’s list (do you remember what they look like? – if not, refer to the website graphics in the link above). Once you have your answer, scroll down to see the result!
THE ANSWER IS BELOW
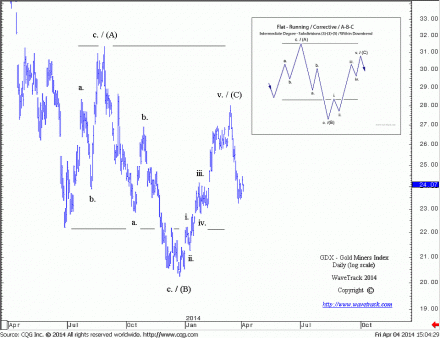
The answer is a RUNNING FLAT – see fig #2 below. The running flat is a ‘corrective’ pattern, unfolding in the opposite direction to the prevailing trend – in this case downwards. It is composed of three main price-swings and we have labelled this in intermediate degree, (A)-(B)-(C). Notice its subdivides 3-3-5, so that wave (A) unfolds into a three wave zig zag, wave (B) as another zig zag and finally wave (C) as a five wave ‘expanding-impulse’ pattern.
The RUNNING FLAT is distinguished from an expanding flat because wave (C) does not exceed the termination (high) of wave (A) – this means it effectively ‘truncates’ and is a sign of a weakening condition – buyers into the high are not strong enough to push prices above the more common price target level above wave (A).
Did you recognise it?
From an Elliott Wave perspective, this is a picture-perfect example of the archetypal running flat pattern, not only from the structural aspect, but also from the geometric Fibonacci-ratio aspect.
SPECIAL BONUS REPORT – Precious Metals
We have just updated this pattern into our current forecasts for precious metals and have now published the results into a special BONUS REPORT that is added to the EW-Compass subscription. The report shows how the running flat pattern fits into the larger/aggregate pattern developing from the 2011 highs for the GDX but also for the XAU Gold/Silver index, and of course for GOLD & SILVER bullion.
This report is invaluable because it describes the finalisation of declines within the up-coming ‘INFLATION-POP’ scenario. We have posted a lot of analysis on this subject on our website at wavetrack.com – just type in INFLATION POP into the text search function and take a look for yourself. I can’t stress how important it is to track the precious metals at the moment.
The latest PRECIOUS METALS BONUS report is refers to previous reports – you can compare these forecasts and see how well they have performed – just go the ‘SPECIALS TAB’ in the EW-COMPASS software to download them FREE, as part of your subscription.
And one last thing – WaveTrack International’s 2014 price-forecasts can also be viewed in two hour-long videos, PART I and PART II. These Elliott Wave forecasts remain valid, and are vitally important especially when we follow the path that precious metals are unfolding into during the next several years.
So don’t delay – take a look at the latest short-term price forecasts, but also how the medium and long-term forecasts are corroborating something spectacular is developing. And don’t forget to send us your feedback! Just use the Help-Desk located in the main-page of wavetrack.com.
All the very best to you!
Peter Goodburn
Chief Elliott Wave Analyst
WaveTrack International
geometric beauty and harmony (AMAZON)
by m.tamosauskas| March 28, 2014 | No Comments
R. N. Elliott’s monograph entitled ‘Nature’s Law’ published in 1946 dedicated an entire chapter to the geometric ratio and proportion qualities of the Elliott Wave Principle. This was the result of his earlier introduction to the Fibonacci Summation Series by Charles J. Collins. Its application was ‘work in progress’ but unfortunately, R. N. Elliott passed away two years later. Despite this however, he left a legacy for us to continue its development and discovery. The use of modern-day computers has accelerated our understanding and our realisation of its frequency within developing EW patterns. This adherence of fib-price-ratios has increased pattern identification whilst helping to minimise the inherent ‘subjectivity’ of human pre-conception that so often results in erroneous wave counting.
We’d like to introduce you to an excellent example of fib-price-ratio adherence within an action-reaction process, an impulse wave followed by a progressive corrective wave. The equity Amazon.com Inc. has recently completed a text-book five wave expanding-impulse pattern into the Jan.’14 high whilst unfolding into archetypal fib-price-ratio measurements.
The complete analysis is added to this month’s Bonus Chart in the latest edition of the EW-Compass report – so don’t miss this chance to explore the geometric beauty and harmony embedded within the price development of Elliott Wave Principle.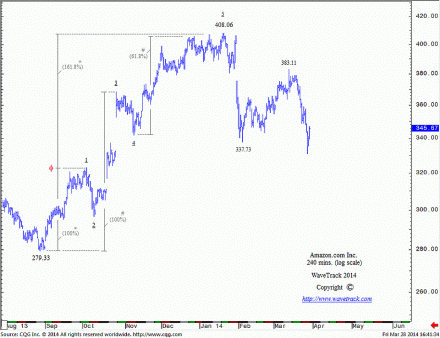
EW-Compass improvements!
by m.tamosauskas| March 19, 2014 | No Comments
Following on the results of the questionnaire (see EW-Compass announcement, March 13th), and in response to your feedback, we’ve decided to make some improvements to the report. We introduced and will rotate additional contracts that you voted for inclusion U.S. Russell 2000 index, Australian ASX200 and China’s Shanghai Composite index – we will also add to this list the Aussie/US$ currency, US$/CAD$, US$/Swiss Franc and something else time from time depending on market activity and your interest!
S&P 500 major resistance level
by m.tamosauskas| March 14, 2014 | No Comments
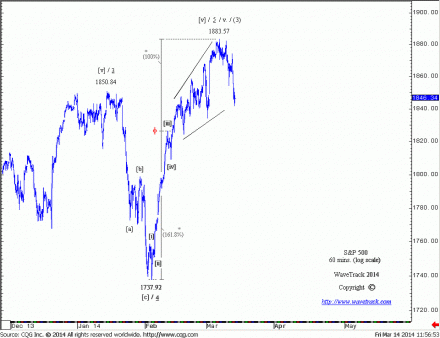
The advance that began from the early Feb.’14 low of 1737.92 unfolded into a five wave expanding-impulse pattern, labelled in minuette degree, with a completion into the recent high of 1883.57. Extending the next advance between waves [i] and [iii] by a fib. 61.8% ratio it depicts the exact high of wave [v] at 1883.57. Precisely to the point! Moreover, there is another hidden golden ratio – extending minor wave i. (1266.74-1475.51) by a fib. 161.8% ratio, upside targets was measured towards 1885.26, less than 2 points to the exact high. Now, it becomes a double convergence and an additional proves S&P 500 has reached a strong resistance level. The following decline began a balancing process of the preceding advance. Become an EW-Compass subscriber and find out the next fib-price-ratios and there the next major support level is located!
