Gold begins Bull Market
by WaveTrack International| March 2, 2016 | No Comments
This third follow-up interview by Dale Pinkert from FX Street is called ‘Gold Call Manifests’. Dale informs his viewers that Peter’s call in his previous interview was spot on for a major gold low at $1043. Peter now provides his latest insights that a pullback towards $1163 is possible before completing this first wave up at $1,300. Peter’s call for the US-dollar has two possible paths that lead to the same destination of a move through 100 to 1.0250-1.0350 before a major decline. The bull case in SPX is intact for a target of 2230.
Listen to the full interview at the #FXroom Online TV channel on the two main topics: Gold begins a bull market and why a US-Dollar peak is ahead!
Interested in more market updates by Peter and his Elliott Wave team? Check out WaveTrack’s bi-weekly Elliott Wave Compass report features many short-term updates of various asset classes.
Successful trading with WaveTrack International
Subscribe to the EW-Compass here…
NIKKEI 225 – Track Record
by WaveTrack International| February 18, 2016 | No Comments
As a part of our Elliott Wave success pattern series we chose this time to show Japan’s Nikkei 225 index which underwent a spectacular reversal-signature during 2015. These patterns allow you to get insights into WaveTrack’s forecasting style and quality.
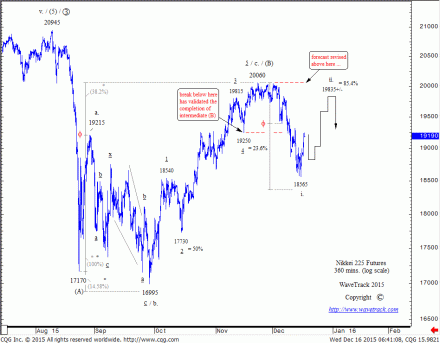
In early-December, we concluded that the top was in when the Nikkei broke below ‘4th wave preceding’ support at 19250 (futures data). Intra-hourly substructure of this initial five wave expanding-impulse decline pointed to an idealised low at 18365+/- prior to a hefty counter-trend rally.
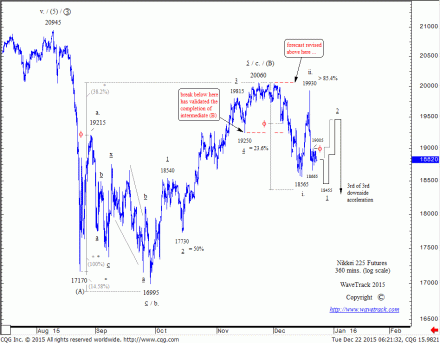
In mid-December, a reversal-signature from a low at 18565 (close to the 18365+/- target range) was identified which implied that the expected counter-trend rally was underway. Upside projections basis our interrelated-market analysis suggested a very deep 2nd wave counter-trend correction to the 1st wave decline from 20060 to 18565 – the most likely target was the 19835+/- resistance area, defined by a fib. 85.4% retracement.
Then came the announcement by the Bank of Japan to increase their bond-buying programme and lengthen the maturity of bonds purchased in order to stimulate the economy. The Nikkei’s reaction in fact was intriguing! It spiked higher in an attempt to take out the 20060 high but failed in a dramatic fashion: within the next session it almost returned to the December lows and has since been unable to recover!
This is a fine example to underline the validity of Elliott Wave analysis. As we know due to Elliott’s guidelines and our own long experience, 2nd waves tend to be rather deep – this is exactly what happened as the Nikkei even exceeded the fib. 85.4% retracement but failed to break the 1st wave’s high. The outlook is clear: despite the possibility of a secondary (but more docile) attempt higher as a smaller second wave, the Nikkei remains poised to the downside.
Don’t forget – our bi-weekly Elliott Wave Compass report features many short-term updates next to the Nikkei 225 of various asset classes.
Deepen your Elliott Wave Knowledge
Subscribe to the EW-Compass here…
KBW Bank Index: U.S. & European Banks – Correction Over? Or Bust?
by WaveTrack International| February 10, 2016 | 5 Comments
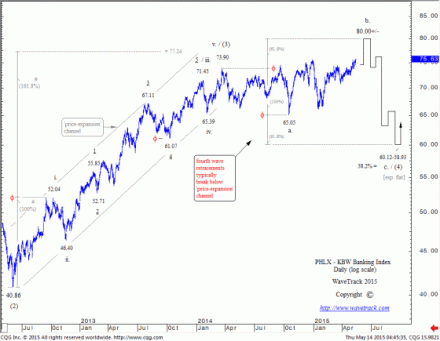
In WaveTrack’s May 2015 forecast (May 14th 2015 – this report is available for free via the Research Pool website) the U.S. KBW Banking index highlighted an imminent downside risk for the banking sector. What we witness now has already been predicted nearly a year in advance by Peter Goodburn head analyst and founding partner of WaveTrack International.
Banking stocks that made headline news once again this week as the price of shares in Goldman Sachs and Deutsche Bank plunged ever lower. Commentators are already comparing these recent declines to those seen during the Lehman crisis of 2009 – but are these declines symptomatic of a new secular-bear downtrend, or are they simply deep corrections within a brighter outlook?
The Update covers the KBW Banking Index as well as Goldman, Deutsche Bank and EuroStoxx Banks charts.
Get access to the new updated report via our partners @
www.researchpool.com
Forex Spotlight: USD forming major peaks vs. Yuan and Rand
by WaveTrack International| January 29, 2016 | No Comments
China’s influence on the world economy made recent headlines in a Bloomberg interview with financier and philantropist George Soros. According to Soros (published 17th January 2016 – font page of the Financial Times): “China is the ‘root cause’ for this years global bear market, citing deflation and excessive debt as a key issues. A hard landing for the Chinese economy was ‘practically unavoidable’.” This remark prompted a strong responds from the Chinese government ‘Beijing warns Soros against declaring ‘war on the renminbi’. Read the FT’s shortened online article here:
China mouthpiece warns Soros against shorting renminbi
The term global economy with all its implications becomes now more apparent then ever when we consider that the Chinese Renminbi/Yuan has dropped 5.7 per cent against the USD since last August.
In the light of these recent events Peter Goodburn’s latest forex article on the USD/CNY and the USD/ZAR is especially interesting as he remarks that “China’s stock market continues to trade lower although the recent accelerative decline is in-line with our annual forecasts (see Stock Index video announcement) and shows the implications of this trend for China’s Renminbi/Yuan -USD/CNY as well as the South African Rand. Download the free IRP Journal here to review the full article and Elliott Wave charts WaveTrack has updated to show an independent view on this development:
Enjoy and stay tuned for more interesting news one Elliott Wave and Financial Markets…
Tags: China > Forex > USD/CNY > USD/ZAR
Stock Indices video for 2016 is available now
by WaveTrack International| January 28, 2016 | No Comments
ANNOUNCEMENT
UPDATED VIDEO – PART I – STOCK INDICES is available now
Elliott Wave Price Forecasts & Cycle Projections for 2016 and beyond.
WaveTrack’s new semi-annual video IS AVAILABLE NOW. This video takes a look at trends for global STOCK INDICES – including longer-term forecasts for the S&P 500, Dow Jones, Russell 2000, Nadaq 100, KBW Banking, EuroStoxx 50, Hang Seng, Kospi, Singapore Straits, Nikkei, Bovespa and more.
There are in total 36 chart updates for stock indices in this update, lasting around 90 minutes! Each chart is drawn with Elliott Wave patterns and intricate fib-price-ratio’s. The main content focuses on the location and progress of the different global stock markets and the disparate performances comparing the U.S./Europe to Asia/Emerging Markets. I believe the differences reinforce the concept that commodity prices will soon begin an upward surge sometime in 2016.
PART I, STOCK INDICES video can be watched immediately, by logging into the EW-Compass software (subscription content) and clicking on the text-link provided within the SUMMARY text – it contains extremely valuable information!
All the best to you,
Peter Goodburn
Would you like to watch this global Stock Indices video? Simply subscribe to WaveTrack’s bi-weekly Elliott Wave Compass below and receive short-term updates of various asset classes.
Successful trading with WaveTrack International
Subscribe to the EW-Compass here…
Tags: China Enterprises Index > Sensex > Singapore Straits Times
S&P 500, SPX & more | FXStreet Interview with Dale Pinkert
by WaveTrack International| January 20, 2016 | No Comments
Dale Pinkert asked Peter Goodburn back to join the FXStreet’s Live Forex Room. The #FXroom is the new Online TV channel 100% Forex. In this latest interview Peter provides updates on many instruments including the possibility if the S&P500 hold last August’s lows a rally to new highs towards 2200 in SPX is possible. Peter’s work also allows for another move lower in EURO to under parity and Gold downside of $1016. Crude oil after a bounce should bottom in the $25 range.
Listen to this interview and connect with FXStreet and Dale Pinkert!
Interested in more market updates by Peter and his Elliott Wave team? Check out WaveTrack’s bi-weekly Elliott Wave Compass report features many short-term updates of various asset classes.
Successful trading with WaveTrack International
Subscribe to the EW-Compass here…
Independent Research = IRP Journal – The New Generation of Research
by WaveTrack International| January 7, 2016 | No Comments
ANNOUNCEMENT | IRP JOURNAL | Latest Edition
To all our Subscribers, Club/Registrant members and Twitter/Facebook followers, we are pleased to announce WaveTrack International’s latest article published in the Independent Research Provider’s magazine. Issue 8/Volume 1 for December 2015 is off the press and you can read our article and others right now with this FREE complimentary download – just click on the link below:
Furthermore, if you are interested in receiving the online-magazine each month, you can sign up for FREE, using this link:
Ensure that you insert your contact details into the correct category – for ‘Buy-Side’ (institutional) companies, Investment Banks, Pension Funds, Total/Absolute-Return/Hedge Funds, Sovereign Wealth Funds, Corporate and Market-Making/Trading institutions and informed individuals, use the ‘registration’ to the left of the page.
Why is Independent Research important?
Only conflict-free research can be used as an viable tool in investment decision-making.
How can you insure unbiased research?
Member business models are based on revenues paid to them for providing quality research – not from investment banking, underwriting, proprietary trading or market making, advisory or consultancy services for clients other than investors, or from companies that are the subject of their research.
What does IRP stand for?
Independent Research stands for quality, impartial investment research.
Connect to the IRP Journal via Twitter: IRP Journal TWITTER
WaveTrack is memember of the EuroIRP Association and supports the development of Independent Research.
The next Generation: Learn more why Independent Research is best financial trend in the last decade:
EU rules demand transparent research fees – Financial Times
ASX 200
by WaveTrack International| January 6, 2016 | No Comments
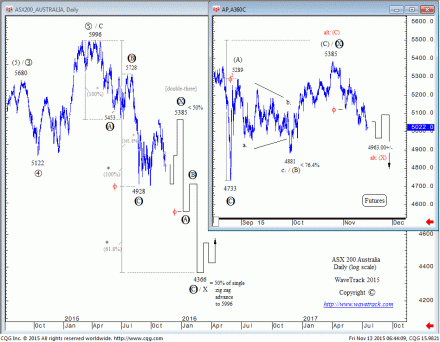
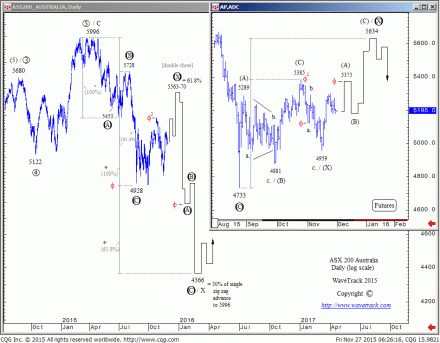
In November, we spotted a very interesting pattern developing for Australia’s ASX 200. The underlying story line is that the index (chart in the background) unfolded into an expanding flat counter-trend correction from its 4928 low whilst the futures (inset chart) synchronised with a single zig zag advance from their corresponding (deeper) 4733 low.
In the 13th November issue of our report, we forecast the ASX 200 to build to the downside in the weeks ahead as this convergence of pattern finalisation (an expanding flat for the index, a single zig zag for the futures) indicated the completion of the entire counter-trend correction labelled wave X in primary degree. But: we also forewarned of a possible halt at the 4963.00+/- level (see futures inset) that was derived by a fib. 61.8% extension of the initial sell-off from the October high of 5385.
What happened during the following weeks? The ASX 200 traded into a low of 4959 (see inset) and immediately reversed to the upside. This was no coincidence but the proof of well-established fib-price-ratio measurements – when prices react to these, it is almost always a strong sign of a more pronounced change in direction. In terms of the current situation for the ASX 200, it meant that the downswing from the October high of 5385 was only a temporary pullback – primary wave X would have to extend into a more complex correction: in case of the index, into a rare double three sequence (see background chart); in case of the futures, into a progressive double zig zag pattern (see inset).
Don’t forget – our bi-weekly Elliott Wave Compass report features many short-term updates of various asset classes.
Start your New Year with Success
Subscribe to the EW-Compass here…
Merry Christmas
by WaveTrack International| December 25, 2015 | 1 Comment
Announcement – Christmas/New Year Schedule
by m.tamosauskas| December 24, 2015 | No Comments
 We’ll be taking the opportunity to rest the team a little during the following week, so this week’s EW-Compass report is the last for the year – the next edition will be published on Wednesday 6th January.

