SP500 + Nasdaq 100 = Bullish!
by WaveTrack International| December 10, 2018 | 1 Comment
SP500 and Nasdaq 100 holding above Oct/Nov. lows – Bullish!
Read more «SP500 + Nasdaq 100 = Bullish!»
Elliott Wave Theory Bullish – Dow Theory Bearish
by WaveTrack International| November 27, 2018 | 6 Comments
Dow Theory vs. Elliott Wave Theory
Read more «Elliott Wave Theory Bullish – Dow Theory Bearish»
Nasdaq 100 Heading for Major Support
by WaveTrack International| November 21, 2018 | 3 Comments
Nasdaq 100 Breaks October Low but Heading for Major Support
Read more «Nasdaq 100 Heading for Major Support»
STLG/USD Declines Following Cabinet Brexit Approval
by WaveTrack International| November 15, 2018 | No Comments
Read more «STLG/USD Declines Following Cabinet Brexit Approval»
NYSE Composite Index – Latest Development
by WaveTrack International| November 6, 2018 | No Comments
NYSE Composite Index – Fib. 100% Equality Ratio in Waves (iii) – (v) – No ‘Extended’ Wave
The Elliott Wave pattern development within the third phase of U.S. stock index declines during September/October’s sell-off varied according to each index’s performance from earlier this year. For example, the large-caps like the SP500 and Dow Jones (DJAI) declined into three wave patterns. In zig zags to be precise, from the late-Sep./early-Oct. highs as wave [c] within a developing triangle. These lows terminated in late-October but above the February lows. In this way reflecting their outperformance during April’s strong advances that broke above the January highs.
Other indices like the underperforming Russell 2000 small-cap index declined during September/October’s sell-off into a five wave impulse pattern. This reflected its underperformance and an entirely different corrective pattern. In this case, a running flat, unfolding from last January’s high.
The NYSE Composite index was one of the underperforming indices for this year. It unfolded into a zig zag pattern, [a]-[b]-[c] and one of the exceptions by breaking below the Feb’18 lows in wave [c] ending at 11820.32 – see fig #1.
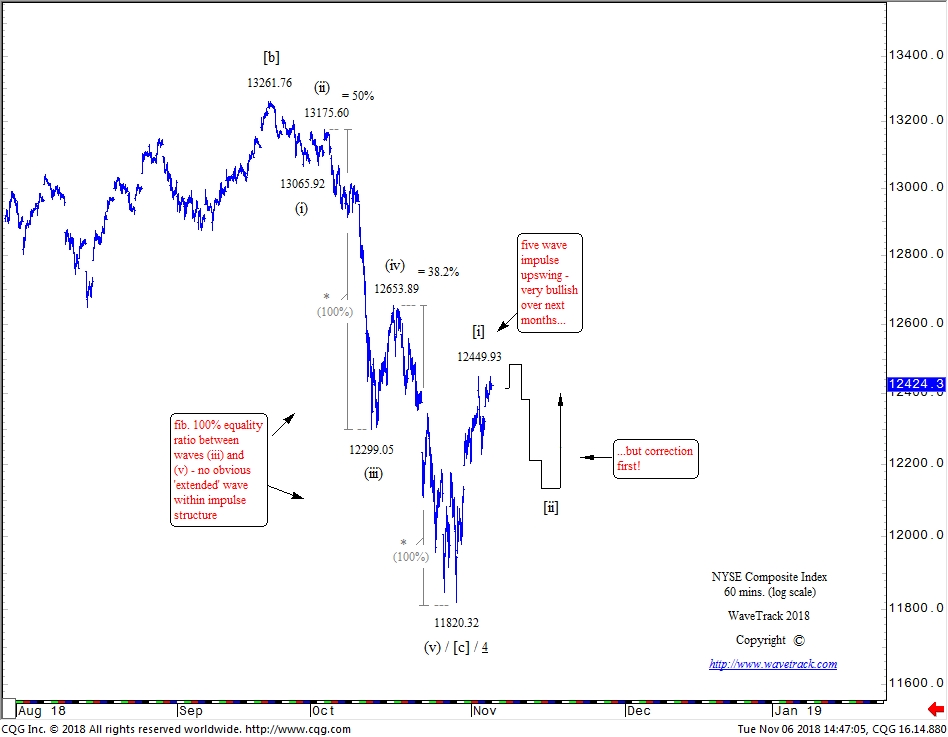
NYSE Composite Index – 60 mins. – www.wavetrack.com
Wave [c] unfolded into a necessary five wave impulse pattern from September’s high of 13261.76 subdividing (i)-(ii)-(iii)-(iv)-(v). What was interesting from a Ratio/Proportion basis was that there was no ‘extended’ wave in this sequence. Rather, waves (iii) and (v) measured equally by a fib. 100% equality ratio. That’s somewhat unusual because R.N. Elliott stated that one wave must ‘extend’ or measure larger than the other two. But occasionally, this hasn’t occurred as this example proves. Although this is statistically uncommon, it’s enough to qualify his statement as a ‘guideline’ rather than a ‘rule’.
NYSE Composite Index – Looking Ahead
With this year’s zig zag decline out of the way, the NYSE Composite index, like the others, can now begin a multi-month recovery, extending the bull market, impulse uptrend that began from the Feb.’16 lows.
Shorter-term, the advance from 11820.32 has unfolded into an intra-hourly five wave impulse pattern ending last Friday at 12449.93 as minuette wave [i]. Wave [ii] has since begun a three wave counter-trend correction but this remains incomplete. Await some downside pull across the U.S. mid-term election results before the trend resumes higher.
What has the SP500 and Nasdaq 100 in common?
by WaveTrack International| November 1, 2018 | 5 Comments
Three Wave Zig Zag Decline Completed for SP500 + Nasdaq 100
The SP500’s decline from September’s high has completed a three wave zig zag corrective pattern into last Monday evening’s low of 2603.00. This development changes this year’s expanding flat into developing triangle pattern. Turning this into a bullish outlook from current levels through to year-end and into H1-2019. The Nasdaq 100 follows the same pattern. Ending into zig zag from October high at 6580.50 and again turning this into a bullish outlook into year-end.
This year’s declines from January’s highs have been labelled as unfolding into an expanding flat corrective pattern as minute wave 4. However, it is now changing into a triangle. See latest EW-Compass Report.
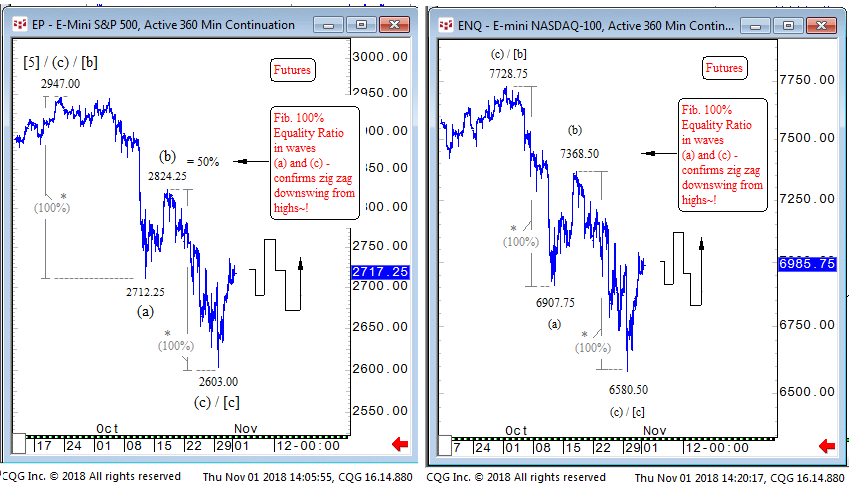
SP500 + Nasdaq 100 – Elliott Wave Forecasting by WaveTrack International
The original expanding flat patterns were labelled [a]-[b]-[c], subdividing [3]-[3]-[5]. They were requiring a five wave downswing from the late-September/early-October highs. Hence, for the SP500 from 2940.91 (cash) and 2947.00 (futures) and for the Nasdaq 100 from 7700.56 (cash) and 7728.75 (futures). But we’ve detected a visible three wave zig zag pattern unfolding in wave [c]’s decline rather than a developing five wave sequence. The two downswings from 2947.00-2712.25 and from 2824.25-2603.00 measure equally. In case of the SP500 by a fib. 100% equality ratio (see SP 500 – inset left) and for the Nasdaq 100 from 7728.75-6907.75 and 7368.50-6850.50 (see Nasdaq 100 – inset right). This fits the characteristic of the zig zag. It therefore ends wave [c] but within a developing triangle because a triangle is labelled [a]-[b]-[c]-[d]-[e] but importantly, subdivides [3]-[3]-[3]-[3]-[3].
Conclusion
These zig zags confirm a good recovery can begin as wave [d] within the triangle. As a result, the SP500’s upside targets are aiming towards 2855.75+/- and Nasdaq 100’s towards 7544.00+/- into year-end, perhaps into January. Looking ahead, the triangle confirms minute wave 4 and upon completion, wave 5’s push to record highs.
Bi-weekly updates on the SP500, Nasdaq 100, US Dollar Index, Crude Oil, EuroStoxx, Russell 2000, Dow Jones 30, Dax, ASX200 and more! Don’t miss WaveTrack’s regular updates in our bi-weekly EW-Compass Report! Ensure you’re tracking our Forex forecasts – subscribe online for the EW-COMPASS REPORT.
Visit us @ www.wavetrack.com and subsribe to our latest EW-COMPASS report!
US$ Dollar Gains After Fed – Shouldn’t Crude Oil Also Decline?
by WaveTrack International| September 28, 2018 | No Comments
US$ Dollar Gains After Fed – Shouldn’t Crude Oil Also Decline?
Following Wednesday’s Federal Reserve interest rate hike of 0.25% to 2.25%, the US$ dollar has pulled higher by 1.23% per cent from 93.95 to 95.11. The US$ dollar looks set to continue higher over the next week or two as the finalising sequence of the expanding flat pattern (see Twitter post 26th September 2018).
Now what about Crude Oil?
But the intriguing question now relates to Crude Oil – see fig #1.
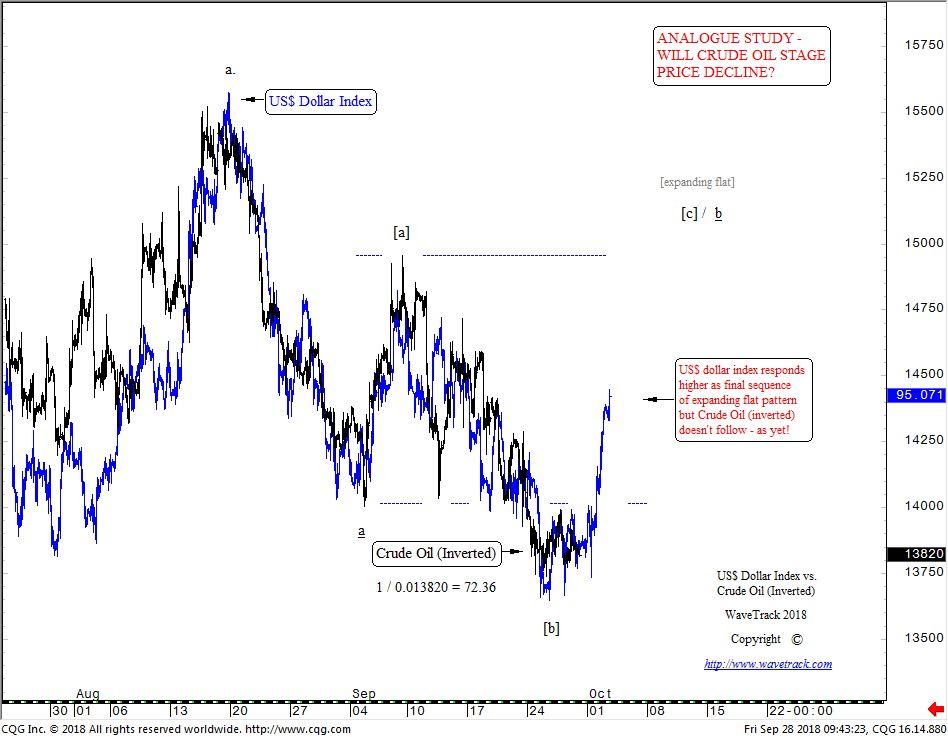
US Dollar Index vs. Crude Oil – Elliott Wave by WaveTrack International
As you can see from this analogue, there’s currently a high-negative correlation with the US$ dollar index. Even price-amplitudes are closely aligned. The US$ dollar index pulled higher through Wednesday/Thursday and continuing this advance today (Friday). However, Crude Oil has failed to respond lower in reaction to the stronger US$ dollar. Is there any obvious reason for this breakdown in the correlation?
Crude Oil – 120 mins.- Elliott Wave by WaveTrack International
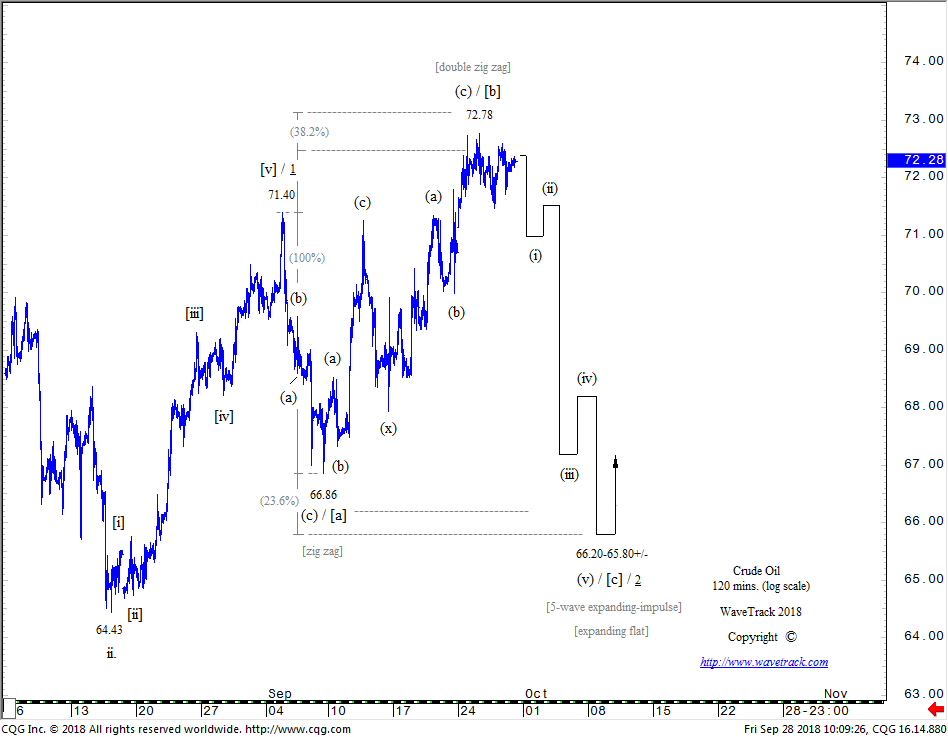
From an Elliott Wave perspective, the exact same Elliott Wave count is applied to Crude Oil, where an expanding flat is unfolding from Crude Oil’s early-September high of 71.40 – see fig #2. Labelled [a]-[b]-[c]. Wave [a] declined into a zig zag ending at 66.86 on September 7th. And was followed by a double zig zag upswing as wave [b] into the Sep. 25th high of 72.78. If correct, as we believe, then it really should decline now as wave [c] towards levels of 66.20-65.80+/-.
Conclusion
Perhaps it’s simply a case of playing ‘catch-up’. However, delays in these types of set-ups are not uncommon. One might view the delay as a complete breakdown of the negative correlation. In this case, Crude Oil’s underlying uptrend is so strong that it’s able to withstand a shorter-term US$ dollar rally. But often, trading opportunities exist where the divergence is simply delayed. Consequently, Crude Oil will perhaps suddenly, trade sharply lower.
Differentiation between the two possibilities comes down to the qualitative assessment of Crude Oil’s pattern. September’s advance does certainly conform to a double zig zag pattern (66.86-72.78). Therefore, the probability that it can still decline as wave [c] to 66.20-65.80+/- is increased.
Risk/Reward becomes a factor in whatever trade set-up is taken. Ensure close stops are applied, e.g. Crude Oil above the fib. 38.2% extension level of wave [a]’s trading-range at 73.15 would probably negate this high area as wave [b] of the expanding flat.
Bi-weekly updates on the US Dollar Index, Crude Oil, SP500, EuroStoxx, Nasdaq 100, Russell 2000, Dow Jones 30, Dax, ASX200 and more! Don’t miss WaveTrack’s regular updates in our bi-weekly EW-Compass Report! Ensure you’re tracking our Forex forecasts – subscribe online for the EW-COMPASS REPORT.
Visit us @ www.wavetrack.com and subsribe to our latest EW-COMPASS report!
Apple Inc. – Right on Target!
by WaveTrack International| September 24, 2018 | 2 Comments
Apple Inc. Hits Upside Targets of 228.42+/- Then Stages Reversal-Signature!
The August 3rd update of Apple Inc. forecast upside price acceleration following the publication of strong quarterly earnings results. Elliott Wave analysis had identified this latest push to record highs as a concluding 5th wave within the five wave impulse pattern unfolding higher from February’s low of 150.24. But this was minor wave v. five within the larger impulse uptrend. This wave dates back to the May ’16 low of 89.47, labelled intermediate wave (5) which means a much larger uptrend was approaching completion.
Using fib-price-ratios, Apple Inc. was forecast higher from 207.39 ending minor wave v. five at 228.42+/-. The actual test of this price level occurred on September 5th at 229.67. It was derived where minor wave v. five unfolds by a common fib. 61.8% correlative ratio of waves i-iii one-three.
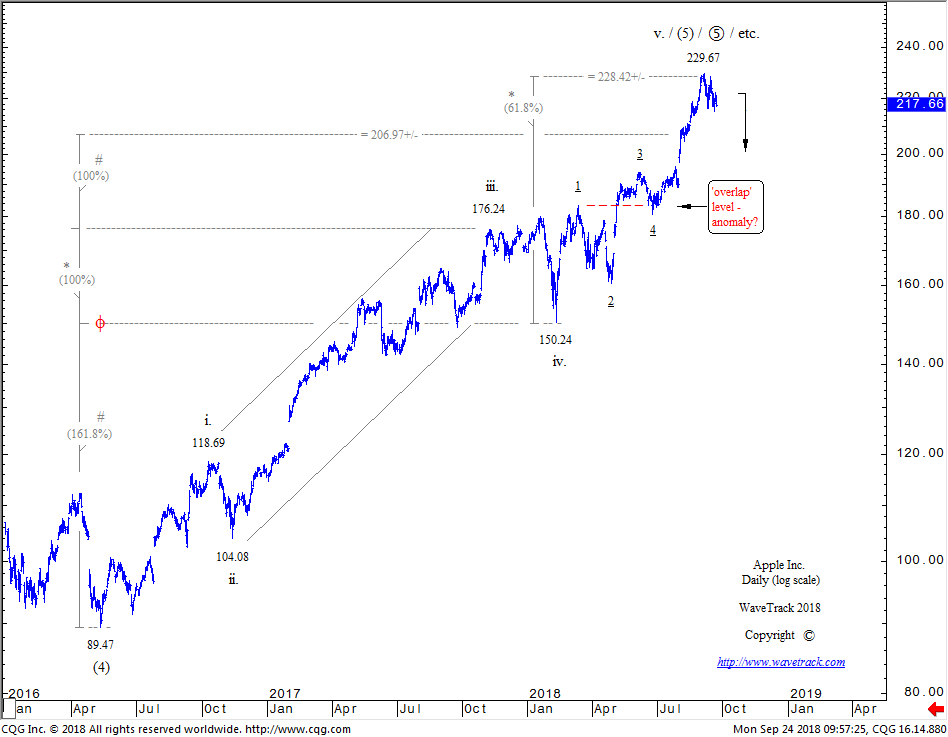
Apple Inc. – Daily – Elliott Wave Forecast by WaveTrack International
Since achieving this upside target for wave v. five of (5), Apple Inc. has now staged price-rejection. The subsequent reversal-signature confirms that a counter-trend decline has begun.
What Next?
The next question is how far can Apple Inc. decline in this correction? Intermediate wave (5)’s advance from the May ’16 low was also the concluding 5th wave of primary wave 5. It stretches back to the April ’13 low of 55.01. And primary wave 5 is also part of the longer-term impulse uptrend that began from the July ’82 low of 0.19. If correct, then Apple Inc. could begin a major correction lasting a decade or more. Returning prices back to low-double-digit levels! But is this likely at this juncture of the secular-bull uptrend? After all, the Nasdaq 100 is still some way off Elliott Wave upside targets of 11946.00+/- (see bi-annual video series).
Apple Inc. – Alternate Counts
Although Apple Inc.’s historical data begins in December 1980, this isn’t enough to verify an absolute terminal price-peak for ending its long-term uptrend. Major indices bottomed in 1974, six years earlier so we can only guess what Apple Inc. would have traded then. It makes a huge difference in Fibonacci-Price-Ratio measurements of the secular-bull uptrend and of course, the Elliott Wave pattern itself.
The current long-term wave analysis is therefore one of a few potentialities labelling primary wave 1 ending into the April ’91 high of 2.61, primary wave 2 into the Dec.’97 low of 0.45, primary wave 3 ending into the Sep.’12 high of 100.72 and now primary wave 5 completing in Sep.’18 at 229.67.
But what we can determine with some surety is that a five wave impulse upswing from the May ’16 low of 89.47 did end into the early-September high of 229.67 which at the very least, indicates a corrective retracement towards ‘fourth wave of preceding degree’ which is at the Feb.’18 level of 150.24.
One alternate count that prolongs Apple Inc.’s secular-bull uptrend relabels the intermediate degree subdivision of primary wave 5’s advance from the April ’13 low of 55.01 so that wave (1) ends into the April ’15 high of 134.54, wave (2) into the May ’16 low of 89.47, wave (3) into the Sep.’18 high of 229.67 with wave (4) now engaged in a corrective downswing towards the fib. 38.2% retracement level of 160.00+/-. Naturally, this decline would necessitate unfolding into a three wave pattern, or a multiple seven/eleven wave sequence to validate its corrective credentials so would be easily spotted and differentiated to a more bearish impulse pattern.
Conclusion
Apple Inc. has underperformed over the last weeks. In fact, coming bottom of the Dow Jones 30 index table of component stocks. Apple reached a decline of -2.8% per cent over the last week alone and down -6.25% per cent from the high. This is consistent action following the completion of the 5th wave at 229.67. However, it’s too early to verify Apple Inc.’s long-term consequences. This means for the time being, downside targets are at least towards the 160.00+/- area.
Are you trading the SP500, EuroStoxx, Nasdaq 100, Russell 2000, Dow Jones 30, Dax, FTSE100 or ASX200? Don’t miss WaveTrack’s regular updates in our bi-weekly EW-Compass Report! Ensure you’re tracking our Forex forecasts – subscribe online for the EW-COMPASS REPORT.
Visit us @ www.wavetrack.com and subsribe to our latest EW-COMPASS report!
Dow Jones – Expanding Flats + Triangles
by WaveTrack International| August 24, 2018 | 3 Comments
Elliott Wave Patterns – Expanding Flats + Triangles
Expanding Flats
This year’s corrective downswing in the Dow Futures from January’s high is of particular interest. Mainly, because its early-April low at 23344.50 briefly penetrated below the early-February low 23360.20. This allows an expanding flat to develop from the February low as a corrective sequence. At the same time confirming April’s advance as the third sequence of the pattern rather than part of a sustainable uptrend. (See latest EW-Compass Report). April’s advance is labelled wave (c) unfolding into an ending/expanding-diagonal.
The final stage of April’s diagonal can be seen approaching a terminal high into current levels. A perfectly formed expanding flat formed from the late-July high of 25572 (futures) into the mid-August low of 24955 – see fig #1. Labelled (a)-(b)-(c) subdividing 3-3-5. Wave (a) declined into a zig zag. Wave (b) rallied into another zig zag prior to wave (c)’s decline as a five wave impulse into the 24955 low.
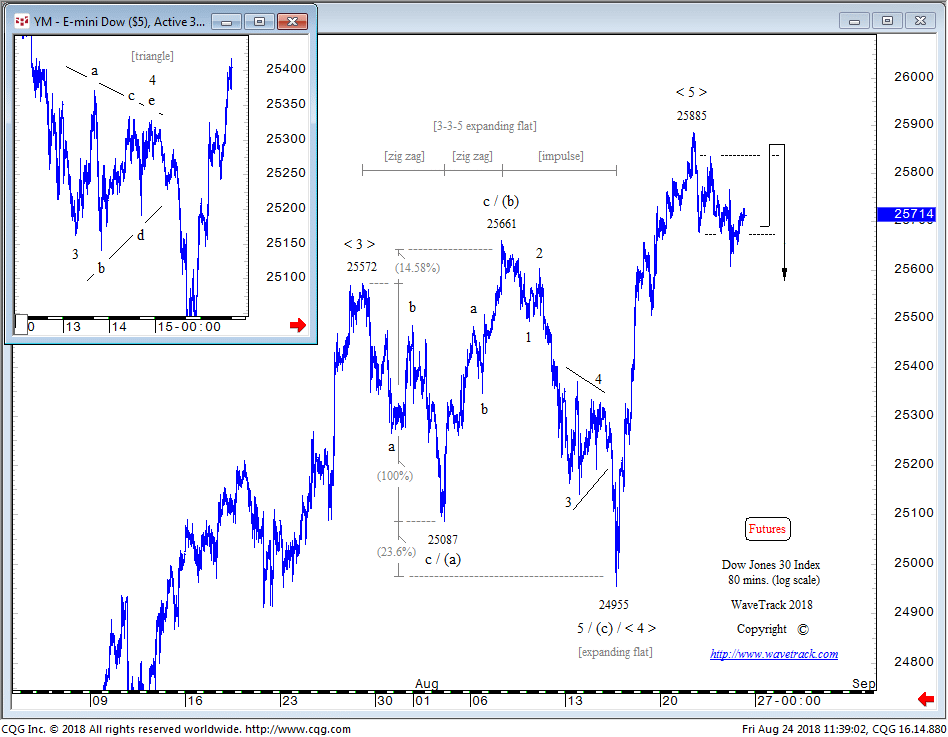
Dow Jones 30 – 80 mins. – WaveTrack International
Moreover, fib-price-ratios (FPR’s) are evident. Providing authenticity to the pattern – extending wave (a) by a fib. 14.58% ratio projects within a few points of wave (b)’s high – extending wave (a) by a fib. 23.6% ratio projects wave (c) to within a few points of the actual low.
Triangles
Within wave (c)’s impulse decline, 1-2-3-4-5, wave 4 can be seen unfolding into a triangle (see inset, top-left). We bring attention to this because triangle patterns are actually uncommon patterns in terms of recurrence/frequency and are often misidentified in the EW community. This example is a good example of an actual triangle.
It’s important to ensure that each wave within the triangle, a-b-c-d-e develops within a near-symmetrical formation with approximately equal boundary lines. This ensures each wave gets close to touching the upper and lower boundary lines. If one sequence is too short so that it doesn’t approach the boundary line, then it probably isn’t a triangle at all which means the analyst must look at other possible wave counts. The only exception is in wave ‘e’ when sometimes, it does fall short. However, none of the others should exhibit this aspect.
Conclusion
The Dow has since traded to a higher-high at 25885. And whilst it could extend a little higher, this existing high has done enough to end the 5th wave thrust from the mid-August low whilst ending the larger 5th within April’s diagonal and the expanding flat from February’s low. That’s bearish!
SP500 – Higher-Highs but Approaching a Terminal Peak
by WaveTrack International| August 7, 2018 | 4 Comments
Despite the SP500’s intra-hourly five wave impulse decline from the July 25th high of 2849.50, the index has manged to secure a higher-high this week. Something that shouldn’t have occurred if a new downtrend was about to begin. There’s only one explanation. The five wave pattern was the concluding sequence within an expanding flat correction. In this case, a-b-c where its three price-swings subdivide 3-3-5 with the five sequence ending at 2791.00 – see fig #1.
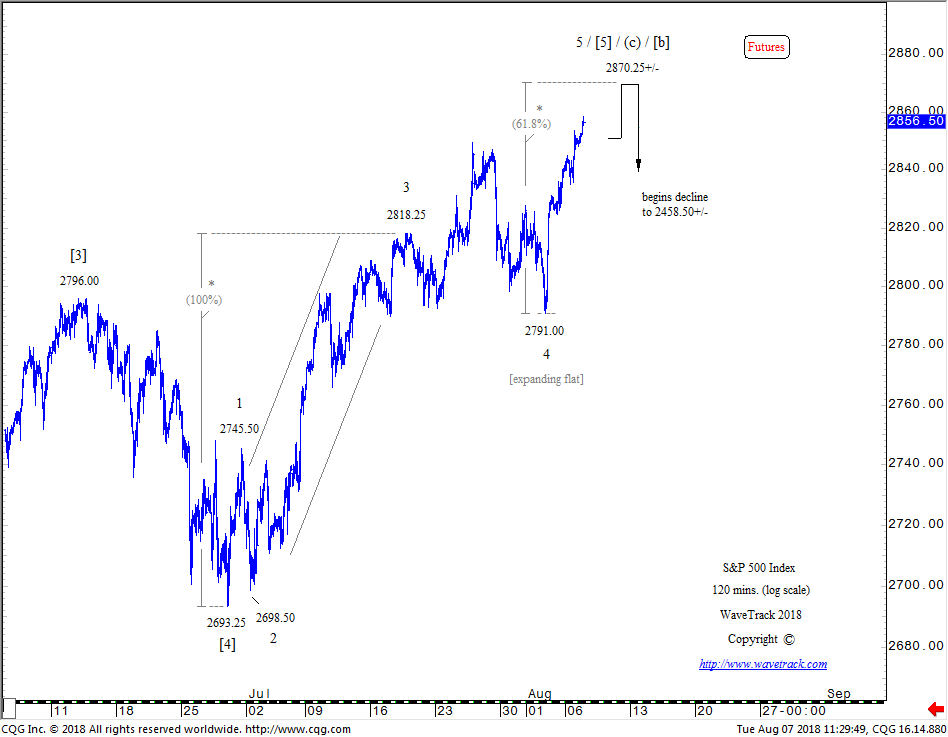
SP500 – 120 mins.
The expanding flat is then incorporated into the developing five wave upswing that began from the late-June low of 2693.25 as micro wave [5]. Subdividing 1-2-3-4-5, the expanding flat becomes wave 4 with wave 5 already in upside progress. The fib-price-ratio measurements project to 2870.25+/- where wave [5] unfolds by a fib. 61.8% ratio of waves 1-3. If the same ratio measurement is used but including the ‘b’ high within wave 4, then wave 5 could push as high as 2890.00+/- but this is seen as a lower probability event.
It’s worth noting that the recent five wave decline in the Nasdaq 100 (not shown) from 7530.00 to 7166.75 was too large to be incorporated as wave 4 within the same five wave upswing from the late-June low as the SP500. Which means there is a heightened probability it will crash lower from below the existing 7530.00 high.
Conclusion
April’s diagonal pattern remains the best description for this uptrend from 2553.80. Comparing this with other indices like the Nasdaq 100 simply reinforces the bearish implications. Even the Dow Jones Industrial Average which is simply attempting a retest of its late-February high is alerting to bearish divergence across the major U.S. indices. We anticipate a -12% per cent decline unfolding over the next few months.
Are you trading the SP500, EuroStoxx, Nasdaq 100, Russell 2000, Dow Jones 30, Dax, FTSE100 or ASX200? Don’t miss WaveTrack’s regular updates in our bi-weekly EW-Compass Report! Ensure you’re tracking our Forex forecasts – subscribe online for the EW-COMPASS REPORT.
Visit us @ www.wavetrack.com and subsribe to our latest EW-COMPASS report!
« go back — keep looking »
Recent Posts
Recent Comments
Archives
- June 2026
- February 2026
- December 2025
- August 2025
- July 2025
- June 2025
- March 2025
- February 2025
- January 2025
- December 2024
- August 2024
- July 2024
- June 2024
- May 2024
- April 2024
- February 2024
- January 2024
- December 2023
- August 2023
- July 2023
- June 2023
- March 2023
- February 2023
- January 2023
- December 2022
- November 2022
- October 2022
- August 2022
- July 2022
- June 2022
- May 2022
- March 2022
- February 2022
- January 2022
- December 2021
- August 2021
- July 2021
- June 2021
- March 2021
- February 2021
- January 2021
- December 2020
- November 2020
- August 2020
- July 2020
- June 2020
- May 2020
- April 2020
- March 2020
- February 2020
- January 2020
- December 2019
- October 2019
- September 2019
- July 2019
- June 2019
- May 2019
- April 2019
- March 2019
- February 2019
- January 2019
- December 2018
- November 2018
- September 2018
- August 2018
- July 2018
- June 2018
- May 2018
- April 2018
- March 2018
- February 2018
- January 2018
- December 2017
- November 2017
- October 2017
- September 2017
- August 2017
- July 2017
- June 2017
- May 2017
- March 2017
- February 2017
- January 2017
- December 2016
- November 2016
- October 2016
- September 2016
- August 2016
- July 2016
- June 2016
- May 2016
- April 2016
- March 2016
- February 2016
- January 2016
- December 2015
- November 2015
- October 2015
- September 2015
- August 2015
- July 2015
- June 2015
- May 2015
- April 2015
- March 2015
- February 2015
- January 2015
- December 2014
- November 2014
- October 2014
- September 2014
- August 2014
- July 2014
- June 2014
- May 2014
- April 2014
- March 2014
- February 2014
- January 2014
- December 2013
- November 2013
- October 2013
- September 2013
- August 2013
- July 2013
- June 2013
- May 2013
- April 2013
- March 2013
- February 2013
- January 2013
- December 2012
- November 2012
- October 2012
- September 2012
- August 2012
Categories
- ADXY Index
- Agnico Eagle Mines
- AI Artificial Intelligence
- Alcoa
- Amazon
- AngloGold Ashanti
- Antofagasta
- APPL
- Apple
- ASX 200
- AUD vs USD
- AUDNZD
- AUDUSD
- Australia ASX 200
- Baltic Dry Index
- Banking
- Base Metals
- Biotechnology
- Bitcoin
- Bovespa
- Broadcom
- Catalexit
- central banks
- Christmas
- Commodities
- Commodities Video Outlook 2020
- Conference
- Copper
- Coronavirus Sell-Off
- CRB
- Crude oil
- crude oil price chart
- CryptoCurrency
- Currencies
- Currencies + Interest Rates Video Outlook
- Cycles
- Dax 30
- deutsche bank
- Dewey Cycle
- DJ Transportation Average
- DJ Utilities
- Dow Jones 30
- Dow Theory
- ECB
- economy
- Elliott Wave
- Elliott Wave Charts
- Elliott Wave Patterns
- Elliott Wave Principle
- Emerging Markets
- Ending-Diagonal Elliott Wave Pattern
- Equity
- EUR vs CHF
- EUR/USD
- Euro / US$
- Eurostoxx 50
- EuroStoxx50
- EuroStoxxBanks
- EURUSD
- Expanding Flat Pattern
- FAAMG
- FANG+
- fib-price-ratio
- Fibonacci Trading
- Fibonacci-Price-Ratio
- Financial Forecasting
- Fixed Income
- forex
- Freeport McMoran
- FTSE 100
- Fund Management
- FX
- FXStreet
- GBP/AUD
- GBP/USD
- GDX
- GDXJ
- Germany 10 year Euro Bund future
- Gilead Sciences
- Glencore
- Global Economy
- Gold
- Gold Mining
- Golden Ratio
- goldman sachs
- Google Inc.
- Google/Alphabeth
- Greek debt crisis
- Hang Seng
- Harbinger
- Hungarian Forint
- IBEX 35 Index Spain
- Independent Research
- India-CNX Nifty 50
- Interest Rates
- Interview
- IRP Independent Research
- kbw bank index
- Lonmin
- MAG-7
- McDonald's
- MID-YEAR VIDEO UPDATE!
- Mifid II
- Mines
- Mining
- MSCI China
- MSCI Emerging Markets
- Nasdaq 100
- Nasdaq Biotechnology Index
- Nasdaq Composite
- Nasdaq100
- Netflix
- Newmont Mining
- Nikkei 225
- NVIDIA
- NYSE Composite Index
- Palladium
- Platinum
- Precious Metals
- Ralph Nelson Elliott
- Reversal-Signature
- Russell 2000
- Russia RTS
- S&P 500
- Sector
- Secular-Bull
- Sentiment Survey
- Shanghai Composite Index
- Silver
- Slanting Flat Elliott Wave Pattern
- SP100
- SP400 Mid-Cap
- SP500
- SPX 500
- STLG/AUD
- Stlg/US$
- STLG/USD
- STLG/YEN
- STLG/ZAR
- Stock Index
- Stock Index Tracking
- Stock Index Video
- Stock Indices
- Stock Indices Video Outlook 2023
- Stock Indices Video Outlook 2025
- Sugar
- Summary
- Tesla
- Tesla Inc
- Toyota
- Track Record
- trading
- Trusts
- Tutorial
- Uncategorized
- UniCredit
- US
- US Dollar Index (DXY) (USDX)
- US$ Index
- US-Dollar Index
- US10yrYields
- USD
- USD/ARS
- USD/CNY
- USD/IDR
- USD/INR
- USD/MXN
- USD/SGD
- USD/THB
- USD/YEN
- USD/ZAR
- Vale
- Value Line Index
- video
- VIDEO OUTLOOK 2018
- VIDEO OUTLOOK 2020
- VIX
- W.D. Gann
- WaveTrack International
- XAU Gold/Silver Index
- Xetra Dax
- XOP
- Yields
- Zig Zag
- Zinc
- ‘INFLATION-POP’
- ‘SHOCK-POP-DROP’