NIFTY 50 BREAKS HIGHER – BUT PART OF EXPANDING FLAT
by WaveTrack International| July 11, 2018 | 5 Comments
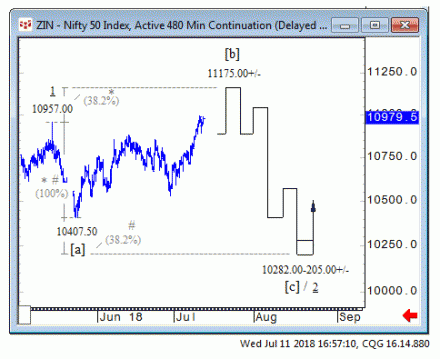
• The Nifty 50 has just broken above the May high. However, it is unfolding ina ann expanding flat from 10957.00 as minute wave 2. This allows a -8.6% decline during next couple of months
The Nifty 50 has broken above the May high of 10957.00 which negates declines to 9795.00+/- as the continuation of January’s zig zag corrective downswing. This revised count relabels the correction as ending last March at 9903.00 as minor wave iv. four within the Feb.’16 impulse uptrend as part of intermediate wave (5).
Minor wave v. five begins with minute wave 1 ending into the May high at 10957.00. Yet, wave 2 is most likely unfolding into an expanding flat – see fig #1. This requires a more immediate upside test towards 11175.00+/-. But afterwards expect a decline to 10282.00-205.00+/- before completion and a resumption of the larger uptrend.
Regular updates for India’s Nifty 50 are available via WaveTrack’s bi-weekly Elliott Wave Compass report – click here
And in our latest Mid-Year Stock Indices Video – click here and see below.
CONTACT US NOW VIA EMAIL – SELECT YOUR PACKAGE
Single Video – *$48.00 – PART I STOCK INDICES (June/July 2018)
Triple Package offer – *$96.00 (saving 33%)! – PART I – PART II – PART III (June/July 2018)
*(additional VAT may be added depending on your country – currently US, Canada, Asia have no added VAT but most European countries do)
PARTS II & III will be available in a few weeks’ time (2018!) – we’re working on it!
HOW CAN YOU RECEIVE THE VIDEO FORECAST?
To receive your VIDEO UPDATE please click here to contact us.
– Please state if you wish to purchase the SINGLE VIDEO for STOCK INDICES for USD *48.00?
– Or opt for the TRIPLE PACKAGE for USD *96.00 in total?
– Next we will send you a PayPal payment request and provide you with the video link & PDF report once confirmed.
*(additional VAT may be added depending on your country or residence. Currently, the US, Canada, Asia have no added VAT but most European countries do)
We’re sure you’ll reap the benefits – don’t forget to contact us with any Elliott Wave questions – Peter is always keen to hear you views, queries and comments.
Most sincerely,
WaveTrack’s Elliott Wave Team
Visit us @ www.wavetrack.com
Comments
5 Responses to “NIFTY 50 BREAKS HIGHER – BUT PART OF EXPANDING FLAT”
Leave a Reply


July 11th, 2018 @ 3:59 pm
Thank you very much.
July 11th, 2018 @ 4:08 pm
You are most welcome! Very best wishes!
August 8th, 2018 @ 7:58 am
Nifty has now gone way beyond 38% extension and son not an extended flat. What is your view now?
August 8th, 2018 @ 10:57 am
Hello! We already know that January’s decline between 11191.00 and 9903.00 unfolded into a zig zag. This would mean that the following advance is either a new impulse uptrend or another zig zag – if the latter, then resistance will be at 11726.00+/-…should a ‘reversal-signature’ occur from 1726.00+/-, then this will be labelled wave ‘b’ within a developing triangle or expanding flat – either way, wave ‘c’ would pull the index sharply lower over the following weeks. We hope this is of help. Very best wishes, WaveTrack’s EW-team
August 8th, 2018 @ 1:46 pm
Thank you very much.