‘SHOCK-POP-DROP’ & ‘INFLATION-POP’ Explained!
by WaveTrack International| February 2, 2019 | 1 Comment
INFLATION-POP and SHOCK-POP-DROP Explained!
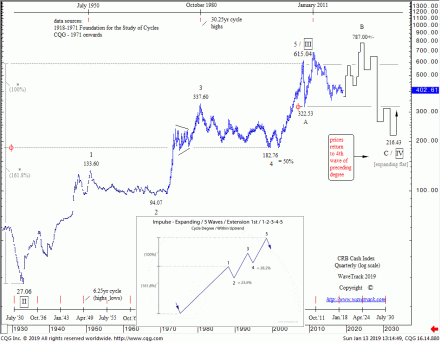
Almost all commodities ended their ‘SUPER-CYCLE’ uptrends around the year’s 2006-2008. We define the super-cycle uptrend not from the 1999 lows as is generally considered in the financial industry but from the ‘GREAT DEPRESSION’ lows of 1932. This is because most commodities reached all-time lows at that time. Even lower than levels traded several hundred years earlier and this provides a strong basis for historical Elliott Wave analysis. The subsequent uptrends from the 1932 lows unfolded into five wave impulse patterns. Consequently completing the ‘Super-Cycle’ into the 2006-08 highs, for benchmarks like the CRB-Cash index, Copper, Crude oil and Emerging Market indices – see fig #1.
Shock-Pop-Drop – Deflationary Cycle
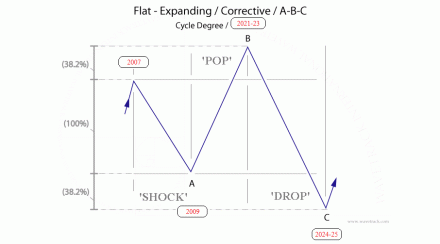
The SHOCK-POP-DROP is a term that describes how various Commodities, Emerging Markets and other major Stock Indices are unfolding as the ‘corrective’ or ‘balancing’ phase in the aftermath of ending their super-cycle uptrends. In Economics, this is designated as a multi-decennial ‘DEFLATIONARY PERIOD’. In Elliott Wave terms, the same period is designated taking the form of an ‘EXPANDING FLAT’ pattern lasting over several decades, heading into the next major cycle low due in the years 2024-2025. This is composed of three main price-swings. This is composed of three main price-swings, labelled A-B-C. In this case wave A as the ‘SHOCK’ phase, wave B as the ‘POP’ or Inflation-Pop and finally wave C as the final deflationary ‘DROP’ phase – see fig #2.
The ‘Financial-Crisis’ or ‘Great Recession’ developed between 2007-2009. It is simply the 1st phase of this multi-decennial corrective price decline that ended into the late-December/early-March lows of 2008/09. This is labelled as wave A, i.e. the ‘SHOCK’ phase.
The post-financial-crisis recovery is the 2nd phase of the corrective deflationary cycle. Yet, this phase is capable of pushing many commodities into new record highs. This phenomenon is not recognised in conventional fundamental/economic or even technical analysis. Because analysts see this as part of the previous super-cycle uptrend. However, the Elliott Wave Principle (EWP) specifically identifies such price developments alongside pattern identification methods as the 2nd sequence of the expanding flat pattern, i.e. wave B.
Inflation-Pop
This 2nd sequence of the expanding flat as wave B can be broken-down or ‘subdivided’ into a three price-swing event. More specifically, an Elliott Wave Zig Zag pattern, up-down-up until prices reach new record highs. We know markets adhere to ‘fractal’ qualities of subdivision and this is a good example. The Zig Zag is therefore labelled A-B-C and given the term of the INFLATION-POP. Mainly because it will undoubtedly trigger a resurgence of inflationary pressures by the time prices reach new record highs.
Wave A represents the 1st stage of the INFLATION-POP and wave C as the 2nd phase – see fig #3 [left].
Grand Re-Synchronisation
The 2nd phase of the INFLATION-POP began in January/February 2016 when corrective declines in Commodities and Emerging-Markets formed synchronous lows with major Developed Market Stock Indices. We termed this as the grand ‘RE-SYNCHRONISATION’ lows. This is why significant price rises have since followed. Continuing the secular-bull uptrend for stock markets (see fig #3, right) whilst beginning the next but final phase of inflationary price rises for Commodities and Emerging Markets.
2nd Phase of Inflation-Pop – Base Metals
This second phase of price rises is typical. But it is not exclusively unfolding into five price-swings or waves, 1-2-3-4-5 over a period of several years, into the culmination of the next cyclical peak due around the early part of the next decade, years-2021-24. So far, wave 1 ended its advance in Base Metals having taken two years to develop into January/February 2018’s highs. This has since given way to a period or regression or correction in wave 2. This is a necessary function before prices can resume higher in wave 3 and so on. Wave 2 is currently in downside progress from the 2018 highs, for Copper, and the rest of the base metals group.
The upside progress of the ‘Inflation-pop’ for precious metals is somewhat different. It too will succumb to the gradual build-up of inflationary pressures. However, maintaining it within the overall schematic. Yet its Elliott Wave pattern progress is different to base metals which means it has already begun its next surge higher from Q3-2018, onwards.
Performance Measures – Precious Metals
There exists some alternate long-term bearish counts for Gold and Silver which otherwise depict the end of their super-cycle uptrends into the year-2011 highs. These forecasts can be viewed in the Elliott Wave Forecast database (Institutional clients, please contact us for details). Or via the annual Elliott Wave Video Series (private clients, please contact us for details) – or see these links below:
Institutional Clients please click here
Private Clients please click here
When comparing underlying industrial commodities like Copper and inflationary sensitive measures like Gold with economic driven commodities like Crude/Brent oil, we again see some short-term pattern-dislocation but overall, fitting the ‘Inflation-Pop’ schematic.
Energy – Crude/Brent Oil
Crude/Brent oil are ultimately heading for new record highs as part of the 2nd phase of the inflation-pop. But this isn’t expected to resume until sometime after mid-year 2019. It began this sequence from the grand ‘RE-SYNCHRONISATION’ lows of January/February 2016. However, is unfolding into a seven price-swing sequence which is labelled A-B-C-X-A-B-C, or in Elliott Wave terminology, a double zig zag. The first cycle degree zig zag, or A-B-C ended last October (2018) and is currently being balanced by an ‘X’ wave correction into Q2 2019. Once completed, the next A-B-C zig zag pattern can get underway lasting through to the next cycle-peak due in 2021-22, attaining record highs.
The Deflationary Drop
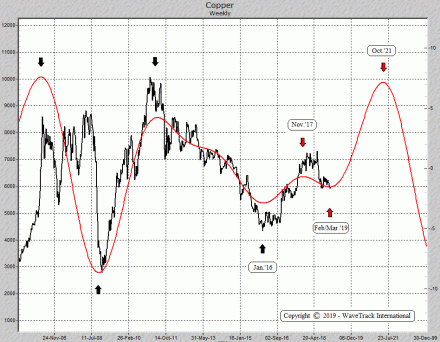
Looking further ahead, the final phase of the ‘Shock-Pop-Drop’ is the ultimate period when rapid, accelerative price declines unfold. The ‘DROP’ sequence when deflationary pressures exert into the end of the next decade. This will be a ‘generational’ decline. Mainly because it will most likely wipe-out stock market and commodity values by around -80% per cent. Just as it did in the last comparable period which was the Great Depression collapse of 1929-1932. See Copper cycle, fig #4.
It will be a very difficult period for humanity. Both economically and spiritually because it will test us all, throughout our entire planet. But like all things justful, the phoenix does rise from the ashes. And and this no exception – we will rise again. It may take 20-25 years to recover from whatever lows develop, just as it did back in the 1930’s. But what emerges afterwards will resonate at higher frequencies for the generations that follow.
Comments
One Response to “‘SHOCK-POP-DROP’ & ‘INFLATION-POP’ Explained!”
Leave a Reply


February 9th, 2019 @ 4:00 am
Of course expanding flat what else:))))
At least timing is accurate – important highs 2020/2026 then commodities smashed down for major low 2030-2032.
P.S. Look at Boeing you will gonna love it possible nested expanded flat in expanded flat…. your wet dreams;))))