FOREX and BONDS Video PART III/III
by WaveTrack International| August 11, 2020 | No Comments
FOREX and BONDS Mid-Year Video Update PART III/III
US$ Dollar Completed 2nd Wave Peak Last March during COVID-19 Panic. 7.8-Year Cycle Downtrend has Resumed. Shorter-Term Rally in Dollar Over Next Few Months. Commodity Currencies Signalling Major Reversal Last March & Now Heading Higher. Asian Currencies Formed Major Lows. U.S. Long-Dated Interest Rates ended Deflationary Cycle Last March. Rising Trends Although Curve Control Expected. European Interest Rates Trending Higher From COVID-19 Lows
INCLUDES ANALYSIS ON MAJOR US$ DOLLAR PAIRS/CROSSES – ASIAN/EM CURRENCIES – MEDIUM-TERM CYCLES – LONG-DATED YIELDS US/EUROPE/JAPAN + SPREADS
We’re pleased to announce the publication of WaveTrack’s annual 2020 trilogy video series of medium-term ELLIOTT WAVE price-forecasts. Today’s release is PART III, FOREX & BONDS – Parts I & II were released during the last month – please contact us for information.
• PART I – STOCK INDICES – OUT NOW!
• PART II – COMMODITIES – OUT NOW!
• PART III – FOREX & BONDS – OUT NOW!
Forex Review – H1 2020
If you remember our January/February’s annual PART III EW-Forecast Report/Video began by forecasting the US$ dollar index approaching a major corrective high. Trading up from 98.69 finalising at 100.54+-/-, max. 102.79+/-. This was the finalising sequence of a 2-year counter-trend a-b-c zig zag rally that originated from the Feb.’18 low of 88.26. It was expected to be a landmark event. Mainly, because it had consumed an unusually long period of time within the more dominant 7.8-year downtrending cycle that began dollar descent from the higher Jan.’17 peak of 103.82.
The coronavirus pandemic was at its peak in China. However, it hadn’t yet crossed over into the consciousness of the West. But as the weeks passed, the COVID-19 pandemic spread across continental Europe and later the U.S. with devastating effect with global stock markets collapsing and their economies with it. The US$ dollar index staged a sharp decline into an early-March low of 94.65. Initially, this triggered thoughts that upside targets have been slightly short, with the dominant downtrend already in progress. Nevertheless, this was a prelude to a sudden and sharp dollar advance to 102.99 as investors sought safe-havens amidst short-term dollar funding shortages.
Ironically, the March high at 102.99 was only 20 pips above January/February’s original upside targets. But this test came and went in the most unexpected way.
The dollar’s subsequent decline from the March high has since triggered the beginning of a new multi-year downtrend. This is evident across most dollar currency pairs. With many Commodity Currencies bottoming in March, the stage is set for some impressive renaissance gains over the next several years.
Forex and Bonds – Key Drivers & Sentiment for H2 2020
The key drivers for the remainder of this year are much the same, the influence from Chinese technology firms and its growing geopolitical influence, Eurozone debt, growing populism, trade wars, a second-wave of COVID-19 and the failure of global fiscal stimulus. But there’s also a risk in the West of a push-back against mandatory vaccination, tracking/travel restrictions and all coming ahead of November’s U.S. Presidential elections. Despite lowered expectations of rising inflationary pressures since COVID-19, there’s a growing concern of a repeat of the 1970’s ‘Inflation-Pop’.
Any one of these events could send investors rushing to buy safe-haven dollars. However, from an Elliott Wave perspective, the medium and longer-term trends remain firmly downward, looking ahead over the next several years.
Global Fund Manger Surveys
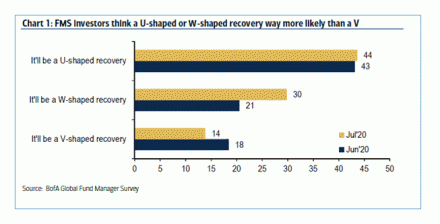
In its latest Global Fund Manager Survey, analysts at Bank of America/Merrill-Lynch have reported from its survey of investors that 44% per cent expect a U-shaped recovery following the economic fallout from COVID-19 – 30% per cent expect it to be a W-shaped recovery whilst only 14% per cent expect a V-shaped recovery – see fig #1. Obviously, 12% per cent didn’t respond, but there are clearly differences in the way economies are heading over the rest of this year.
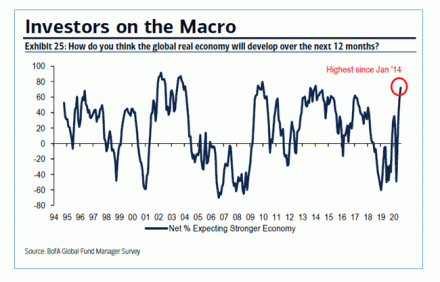
In the same survey, when asked how the economy is expected to develop over the next twelve months, the response showed 72% expected stronger growth. This is the highest level since January 2014. Whilst 36% expected economies to get a lot stronger which was the highest figure recorded in the data that began in Oct.’94 – see fig #2.
Our Elliott Wave interpretation of this suggests the post-COVID-19 economic recovery is now reaching an interim peak. And will likely take a rest period, undergoing a counter-trend correction during the coming months. That translates into a correction in the stock market. Mainly, an upside correction for the dollar, and a period of risk-off/safe-haven strategies.
Forex EW-Forecasts H2 2020
Whilst the US$ dollar remains on a downward trajectory over the medium-term, that is, over the next several years, the outlook is becoming more bullish over the shorter-term, spanning the next few months.
A five wave impulse downswing is visible in the US$ dollar index’s decline from that March spike-high of 102.99 which heightens the probability of a counter-trend upswing unfolding thorough August to October/November.
Morgan Stanley’s US Dollar Position
In a recent research note, investment bank Morgan Stanley said it had now shifted from its dollar-bearish stance and turned ‘tactically neutral’ on the U.S. currency, citing the dollar is at its most oversold level in over 40-years. The bank has exited its short position on the dollar index whilst also closing long positions on the euro and Australian dollar.
WaveTrack’s Elliott Wave US Dollar Forecast
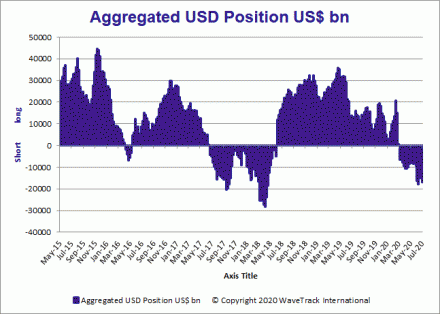
That certainly seems to concur with our Elliott Wave count! The latest aggregated US$ dollar positioning basis COT data also supports the idea that the dollar has entered an oversold condition – see fig #3. Whilst this doesn’t necessarily ensure a dollar rally is ahead because an oversold reading can remain that way in a strong downtrend, it does hint of one especially if supported by an Elliott Wave count. The COT data shows the dollar’s net speculative positioning has been declining since May ’19 and is now negative at minus -$19.1bn dollars. That’s approaching levels not seen since May ’18, shortly after the dollar ended is intermediate wave (1) downtrend at 88.26 that began from the Jan.’17 peak of 103.82.
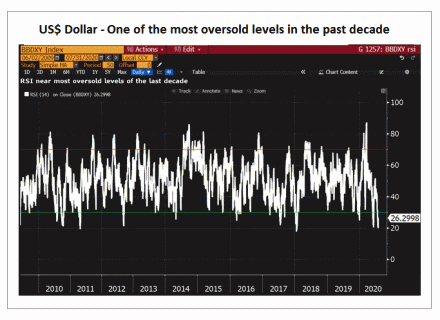
In this next graphic, we see the same oversold signal basis a ‘relative strength index’, or RSI – see fig #4. The current reading at the beginning of August is 26.2998 registering one of the most oversold levels of the past decade.
EUR Component
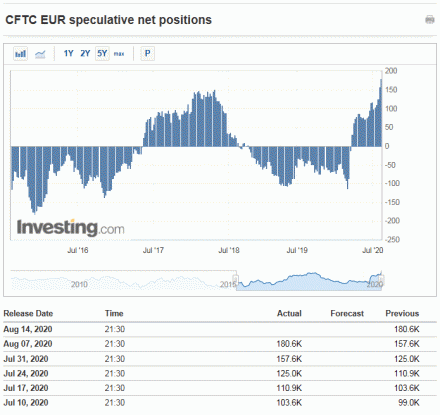
Of course, the US$ dollar index weighting of its basket of currencies shows the EURO currency as the largest component at 57.6%. So it’s not surprising the EURO is correspondingly at an overbought condition right now. The latest COT net speculative positioning is at plus +180,600 contracts, historically very high, even higher than the previous peak of April ’18 when it was at 151,500 contracts and trading at 1.2556 (now at 1.1785) – see fig #5. The equivalent dollar positioning value is at plus +16.016bn dollars, extremely high and from an Elliott Wave count, is approaching the completion of a corresponding five wave impulse uptrend that began last March from 1.0635.
G8 Currencies
When taking a comparative look across all of the G8 currencies, the medium-term and shorter-term outlooks suggest a similar story. Certainly, where the US$ dollar is firmly engaged in a downtrend for the next several years but positioning for a shorter-term counter-trend rally.
Sterling vs. US Dollar
This is definitely the case for Stlg/US$, although we expect some level of short-term outperformance. US$/Yen is set to trend higher over the coming year or two although this contradicts the idea of a weaker dollar. This is more to do with its positive-correlation with the Nikkei 225’s stock index uptrend, and its correlation to the US10yr yield, both of which reflect risk-on strategies over the period, thus weakening the Yen more than the dollar.
US Dollar vs. CHF/NOK/CAD
The US$/CHF Swiss Franc is poised to benefit by a weaker US$ dollar downtrend with Elliott Wave projections below the Aug.’11 low of 0.7064. The US$/NOK is forecast to trend significantly lower over the next several years reflecting Norwegian Krona strength as a commodity-based currency, linked to a major ‘Inflation-Pop’ recovery in Crude/Brent oil prices. Another commodity currency is the Australian dollar – the AUD/US$ is also tipped to strengthen dramatically, trending higher through the final stages of the ‘Inflation-Pop’ cycle, ultimately breaking above its previous year-2011 high of 1.1083. This is also true for another petro currency, the Canadian dollar where the US$/CAD ended its pre-financial-crisis counter-trend advance only recently, into the March ’20 COVID-19 high of 1.4669 and now in the early stages of a multi-year downtrend.
Currency Crosses – Euro/GBP/AUD/NOK/CAD
The latest Elliott Wave analysis of currency crosses has extended our portfolio to include AUD/NOK, CAD/NOK and AUD/CAD – these suggest AUD strength over NOK and CAD through the final stage of the ‘Inflation-Pop’ cycle – the CAD/NOK cross is trending lower. See report for full details.
Asian & Global Currency Pairs
Something very special occurred last March when many Asian currencies continued to weaken against the US$ dollar. The Asian Dollar Index (ADXY) sold-off sharply during the COVID-19 panic but trading down into long-awaited targets of 99.80+/- to only a fraction above, at 100.30. This low coincided with a major high in the dollar index (DXY) at 102.99 but confirming the ADXY ending a 12-year corrective expanding flat pattern from the Feb.’08 high of 116.40.
See Forex report for full details.
US$/BRL/RUB/ZAR/MXN/ARS/TRY/PLZ
See Forex and Bonds report for full details.
Bitcoin
A recent survey from a U.S. investment bank noted that baby-boomers were inclined to buy gold as a safe-haven investment but millennials prefer to invest in Bitcoin.
As for Bitcoin, our Elliott Wave analysis continues the same theme outlined earlier this year – the multi-year outlook remains very bullish, with the prospect of outperforming gold by a huge margin over the next decade.
Interest Rates – Review
Last January/February’s Elliott Wave analysis forecasted long-dated treasury yields declining to new record lows during the 1st quarter 2020 period. But little did we know just how far those yields would decline!
U.S. Treasury Yields Cycles and Elliott Wave Forecasts
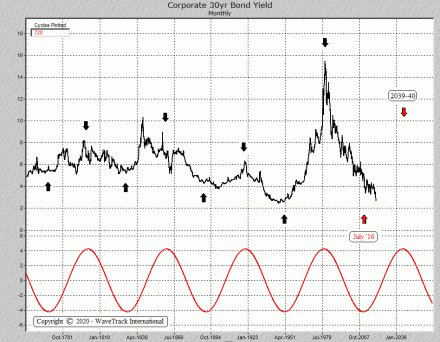
The triple AAA rated corporate bond yield has a 60-year cycle dating back to the early 1700’s – see fig #6. Its last peak was the ‘inflationary’ high traded back in year-1981 at 15.84%. The subsequent ‘deflationary’ era has so far, extended beyond the half-60yr cycle of 30 years which was due to end in mid-2016 to this year, 2020. This is most probably a result of central bank intervention. Specifically, its quantitative easing and accommodative monetary policies. However, the further the yield passes beyond this date, the more risk of a springboard effect higher later.
US10yr yield
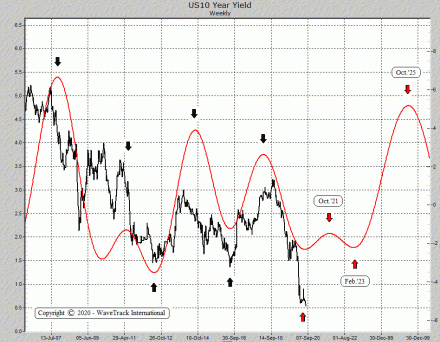
The US10yr yield hit a low last March at 0.377% before responding immediately higher to begin a new longer-term uptrend. Like the thirty-year yield, once primary wave 3 begins, its pace and trajectory could be slow, at least in its early stages of development.
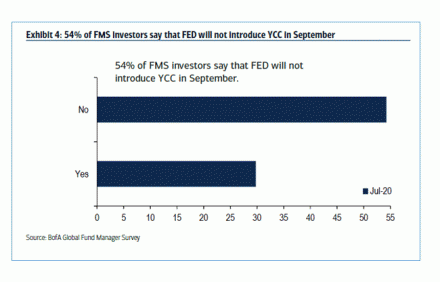
The Bank of America/Merrill-Lynch’s recent Global Fund Manager Survey reported that 54% of investors said the Fed would not introduce Yield Curve Control at its next meeting in September. About 30% did say they expected it. However, in this case, we’re interested in what the majority think and expect – see fig #7.
Basis our weekly composite cycle of the US10yr yield, the yield forms an important low in August/September. It should then turn higher. Consequently, this would start a primary wave 3’s advance. Yet, it may not necessarily accelerate higher, at least in the beginning, basis the cycle – see fig #8. Note how the cycle turns higher. However, not to any significant trajectory. Rather, it trends higher gradually until October ’21. Could that suggest the Federal Reserve will implement yield curve control soon?
Dollar Spreads
See Forex report for full details.
Dollar/Euro Spread
See Forex report for full details.
Inflation TIPS
The US10yr Breakeven Inflation Rate hit a low last March at 0.727, extending primary wave B’s corrective downswing that began from year-2011’s high of 2.654. But importantly, the spread remained above the financial-crisis low of 0.077 which defined the beginning of the ‘Inflation-Pop’ cycle. The TIPS has since traded up to 1.571% which is perfectly in-line with upside progress as primary wave C. Inflationary pressures are on the rise!
European Yields
The benchmark DE10yr yield edged slightly below the Aug.’19 low of -0.743% during the COVID-19 panic last March. Touching a new historical low at -0.910%. It immediately traded higher later in the month to -0.146 confirming its multi-decennial corrective downswing from the year-1981 inflation-pop high of 11.500% had completed whilst opening the way for a new era of rising interest rates to begin. Over the next few years, we expect the yield to trend higher. Possibly, attempting targets towards 2.085+/- as primary wave 1.
Spreads
See Forex and Bond report for full details.
Italy
See Forex and Bond report for full details.
Japan
See Forex and Bond report for full details.
New Forex & Interest Rates mid-year 2020 Video – PART III/III
We’ve amassed over 100 charts (a new record!!) from our EW-Forecast database in this mid-year Forex and Interest Rates 2020 video. Each one provides a telling story into the way Elliott Wave price trends are developing in this next INFLATION-POP’ phase of cycle development. We’re taking a look at some very specific patterns that span the entire 15.6-year US$ dollar cycle. And explaining their current location and why inflation will trigger huge US$ dollar declines. Yet, simultaneously appreciating major Emerging Market and Asian Currencies.
We’re updating some amazing Elliott Wave forecasts for U.S. interest rates, US10yr, US10yr, US05yr, and even US02yr together with a schematic look at several spread relationships with European rates not forgetting upside targets for the US10yr Inflation Tips. It’s a must-see!
We invite you to take this next step in our financial journey with us – video subscription details are below – just follow the links and we’ll see you soon!
Most sincerely,
Peter Goodburn
Founder and Chief Elliott Wave Analyst
WaveTrack International
What you get
Contents: 100 charts | Video duration: 2 hours 15 mins.
The contents of this FOREX & BONDS VIDEO include Elliott Wave analysis for:
• US$ Index + Cycles
• Euro/US$ + Cycles
• Stlg/US$
• US$/Yen
• US$/CHF
• US$/NOK
• AUD/US$
• NZD/US$
• US$/CAD
• Euro/Stlg
• Euro/CHF
• Euro/NOK
• Euro/Yen
• Euro/AUD
• Stlg/YEN
• Stlg/CHF
• Stlg/NOK
• Stlg/ZAR
• Stlg/AUD
• AUD/NOK
• CAD/NOK
• AUD/CAD
• Asian ADXY
• US$/Renminbi
• US$/KRW
• US$/SGD
• US$/INR
• US$/TWD
• USD/THB
• US$/MYR
• US$/IDR
• US$/PHP
• USD/BRL
• USD/RUB
• US$/ZAR
• US$/MXN
• US$/ARS
• US$/TRY
• US$/PLZ
• Bitcoin
Interest Rates (30 charts):
• US30yr Yield + Cycles
• US10yr Yield + Cycles
• US5yr Yield
• US2yr Yield
• US2yr-10yr Yield Spread
• US10yr-30yr Yield Spread
• 3mth EuroDollar-US10yr Yield Spread
• Comparison US10-DE10yr vs S&P 500
• US10yr TIPS Break Even Inflation Rate
• US10-DE10yr Yield Spread
• DE10yr Yield
• ITY10yr Yield
• JPY10yr Yield
BUY NOW on WaveTrack’s VIMEO Video On Demand Page
Click here to buy the CURRENCIES and INTEREST RATES Mid-Year Video Update 2020
*(additional VAT may be added depending on your country – currently US, Canada, Asia have no added VAT but most European countries do)
We’re sure you’ll reap the benefits – don’t forget to contact us with any Elliott Wave questions – Peter is always keen to hear you views, queries and comments.
Visit us @ www.wavetrack.com
Comments
Leave a Reply
